Journal of Geology & Geophysics
Open Access
ISSN: 2381-8719
ISSN: 2381-8719
Review Article - (2017) Volume 6, Issue 4
The study is aimed at estimating the natural vulnerability of groundwater resources using Dar Zarrouk geoelectrical parameters. Hence, ground-based earth resistance measuring device (OYO McOHM resistivity meter, Model 2115A) and its accessories were deployed for the study. 15 Schlumberger vertical electrical soundings (VES) points distributed along three profiles within the Mbo plain area were conducted. The VES field data were interpreted manually on bilogarithmic plot and then by applying the auxiliary point-partial resistivity curve matching technique. The interpretation was enhanced by sophisticated computer software (IPI2Win). The Dar Zarrouk geoelectrical parameters were deduced from the advanced interpreted results and use to produce contour maps. The lithology identified was of sands sequence of different grain sizes for aquifer zone. The absence of clay formation in the lithology log and low resistivity value (21.49 Ωm) at aquifer’s depth within the VES 5 column suggested saline water ingress. The low range of overburden thickness lies between 0.3 and 4.6 m. The associated overburden longitudinal conductance was found to range from 0.000 to 0.019 Siemens, which was generally low. Therefore, suggesting that groundwater resources in the study area are vulnerable to contamination. Hence, aquifers in the study area were considered to be at high risk of contamination from environmental activities and saline water ingress. The information from study could help in the planning, monitoring and management of potable water supply and development in deltaic coastal aquifer system.
Keywords: Dar Zarrouk geoelectrical parameters; Lithology; Groundwater; Protection capacity; Aquifer
Water resources in the entire Niger Delta are threatened by increasing exploration for oil and gas which has not only increased the demand for potable water due to population influx, but has also contaminated most of the surface water means. Groundwater resources are not free from contamination; however some local geologic formations have the potential to protect groundwater resources from contamination, which can occur naturally or artificially. The natural vulnerability expresses the sensitivity of aquifers to be adversely impacted upon by an imposed contaminant loads. The natural contamination of groundwater resources in coastal areas have been traced to the hydraulic connection between groundwater and seawater [1]. Seawater has the natural advantage of higher hydraulic pressure (due to higher mineral contents and sea level rise), therefore will always migrate into freshwater thereby contaminating the aquifers. At saline water ingress, groundwater system is overridden by a wedge of higher saline water that grades into seawater. The Dar-Zarrouk (D-Z) variables provide easily decipherable vision about the occurrence and distribution of fresh and saline water aquifers.
Freshwater aquifers contamination can also occur artificially by some anthropogenic activities such as navigation channels, drainage channels, agriculture, hysterical leakages of products from oil and gas installations such as pipelines and storage tanks and mobile vessels (oil tankers) and pumping of groundwater from coastal freshwater wells, etc. Contamination effect on groundwater resources can become very serious where the geologic materials are not capable of protecting the aquifers in an area [1]. Groundwater contamination makes an aquifer endorheic, this puts the populace at high risk of waterborne diseases, since some soil borne verses can survive for days in unsaturated zone, and eventually get to the saturated zone [2].
Resistivity of earth materials is widely influenced by a number of factors including salinity, moisture content, metallic mineral content, porosity, clay content, temperature and resistivity of pore fluid. Deviation of the resistivity of rock layer from that of the country rock indicates anomaly. Resistivity survey seeks to delineate anomalies, which are representations of the ground conditions. Ideally, in a clayey or saline environment, high resistivity anomalies are most probably indicators of potable water; while low resistivity anomalies would be the target for groundwater exploration in basement terrain.
Electrical resistivity data have a threefold intention: to identify external corrosion threat on buried facilities [3-6]; identify ore bodies, depth to bedrock and other geological processes [7] and for groundwater resources and environmental protection and management. The combination of thickness and resistivity of the overburden rock into single variables known as Dar Zarrouk parameters [8,9] can be used as a plinth for a proper estimation of the safety condition of aquifers as well as the protection of groundwater resources in any environment [6,10,11].
Researchers noted that groundwater is also susceptible to pollution from infiltration of leachate due to decomposed refuse from dump sites as well as leakage from septic tanks of various houses [12-14]. However, despite the large numbers of hydrogeological studies within the vicinity of the study area [15-17] only aquifer potential and groundwater reserve had been addressed using interpreted resistivity value of earth materials. Issues bordering on the safety of the aquifers within the study area are yet to receive adequate attention. It is for the purpose of safety of the rapid growing population witnessed in the study area that this investigation is carried out to ascertain the vulnerable level of aquifers in the area. Hence, the prime objective of this study to identify the local lithology and to determine if the local geologic formation has the natural capacity of protecting groundwater resources in the study area from contamination using Dar Zarrouk geoelectrical parameters.
Akwa Ibom State lies entirely within coastal plain sand (otherwise known as the Benin Formation), which is a deltaic deposition environment and has a thickness in excess of about 800 m. The Benin formation extends from the west across the Niger Delta and southward beyond the present coastline. It is over 90 percent sandstone with silicon as the dominant element, though some places have minor shale intercalations. It is coarse grained, gravely, locally fine grained, poorly sorted, sub-angular to well-rounded, and bears lignite streaks and wood fragments. The Benin formation is thus partly marine, partly deltaic, partly estuarine and partly lagoonal and fluviolacustrine in origin [13]. Its age ranges from Miocene to recent. The terrain of the area is characterized by two types of land forms: highly undulating ridges and nearly flat topography. Various structural units (point bars, channel fills, natural levees, back swamp deposits and oxbow fills) are particular within the formation indicating the variability of the shallow water depositional medium [18]. Stratigraphically, the coastal plain sand is overlain by recent alluvium and recent sediments and underlain by the Agbada formation. Its outcrop lateral equivalent is probably the Bende Amake sands (Figure 1). The coastal plain sand harbours prolific aquifers, which are the major source of potable water for domestic, agricultural, and industrial use in the study area [19].

Figure 1: Geologic map of Akwa Ibom State showing the study area.
The technique of the vertical electrical soundings with Schlumberger array was used for imaging the vertical variations in the ground electrical properties. The technique consists of a quite fast and versatile procedure of geophysical investigation. In addition, it is an extensively known technique to determine the location of the water table [9,15,16,20], whose information is essential for the elaboration of the piezometric surface map. The OYO McOHM resistivity meter (Model 2115A) was used to carry out 15 soundings along three profiles in July, 2016 in Ibaka community, Mbo Local Government Area. Electrodes were configured such that potential electrodes also called the inner electrodes (MN) were nested between the current electrodes (AB) also known as outer electrodes. The current electrodes separation was gradually adjusted (from 1 m to a maximum of 300 or 400 m depending on the terrain) to ensure the progressive penetration of current into deeper layers. The potential electrodes (MN) separation was also adjusted from a minimum of 0.5 m to a maximum of 15 m. The adjustment was controlled such that MN separation did not exceed 1/5 of half AB separation in order to maintain measurable subsurface electrical potential.
The quantitative treatment of field data started with the conversion of measured resistance (Ra) to apparent resistivity (ρa) using a standard equation given as
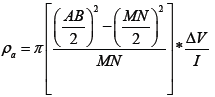 (1)
(1)
Data obtained were manually plotted on bi-logarithmic graph to produce apparent resistivity against half current electrodes spacing curves. The curves were manually smoothened to check resistivity curve discontinuities generated by different “MN” spacing of the same “AB” spacing induced by lateral inhomogeneity, anisotropy effect and other signatures arising from ambient noise on the resistivity curves [14,16,21]. Smoothened curves were subjected to curve matching procedure using master curves (Figure 2). Data obtained were inputted into the computer for inversion modeling interpretation using the IPI2Win computer software which generated models of the subsurface resistivity variation with depth. The inversion yielded resistivity models with fitting error between the observed and theoretical resistivity values of less than 10% and was considered to produce valued results. In addition, the computer processed and interpreted VES curves yielded geoelectrical layer thickness as close as possible to the actual values of boreholes information in the study area (Figure 3). This was important because VES results are influenced by a number of factors such as salinity, lithology, water content, clay content and porosity [11,22].

Figure 2: Two-layer master set of sounding curves for the interpretation of manually smoothened field curves [23].

Figure 3: Lithologic log of borehole in the study area.
The combination of subsurface resistivity and thickness into single parameter (Figure 4) gives rise to the Dar Zarrouk parameters deployed for the study. For a sequence of n horizontal stratified, homogeneous and isotropic layered earth model of resistivity ρi and thickness hi, Orellana [20] and Zohdy [23] presented the combinations of the layer parameters (ρi and hi) as

Figure 4: The theory and application for the combination of subsurface resistivity and thickness for two cases [24].
 (2)
(2)
and
 (3)
(3)
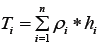
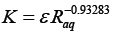
where Si and Ti represent longitudinal conductance (Siemens) and transverse resistance (ohm-m2) respectively. The combined resistance and thickness of earth layers was necessary because it checks some limitations, such as: heterogeneities effects, topographic effect and assumptions that beddings are horizontal associated with VES data interpretation. There was a need to correct for aquifers’ resistivity in order to determine the hydrogeological characteristics of the underground water [24,25]. Hence, transverse resistance (T) was applied to reveal resistive layer confined between two or more conductive layers. While conductive layer sandwiched between two or more resistive layers was unraveled by its horizontal conductance (S). Therefore, analysis of Dar Zarrouk parameters was used as the basis for evaluating the groundwater properties such as aquifers’ transmissivity, and groundwater resources protection. In order to determine the values for transmissivity, aquifers’ hydraulic conductance were computed from
 (4)
(4)
where ε is an empirical constant given by 386.4 for coastal aquifers and Raq is the aquifer’s resistivity. According to Singh [24], Braga et al. [9] and Harb et al. [26] aquifer transmissivity is the product of its hydraulic conductivity and layer thickness (hi), mathematically represented as
 (5)
(5)
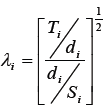
The transverse resistivity (ρT), longitudinal resistivity (ρL), pseudoanisotropy (λ) and the root mean square resistivity (ρrms) were determined using equations (6, 7, 8 and 9 respectively). This further helps in reducing ambiguities related to VES interpretation, which are mainly produced by principles of equivalence and suppression and cause intermixing in identifying depth limits for the electrical zones during interpretation.
 (6)
(6)
 (7)
(7)
 (8)
(8)
 (9)
(9)
The quantitative interpretation of VES provided geoelectrical information characterized by the values of resistivity and thickness (Table 1). Quantitatively, the correlation of geoelectrical interpreted depth with borehole depth (near VES 5) produced a strong result (Figure 5) with a correlation coefficient of 0.98. This gave the researchers more confident that the VES data interpreted represents to a great extent, the true nature of the local geology of the study area.
| VES | N | ρ Ωm | ρ Ωm | ρ Ωm | ρ Ωm | d1 m | d2 m | d3 m | h1 m | h2 m | h3 m | % Er | Curve | Lat | Long |
|---|---|---|---|---|---|---|---|---|---|---|---|---|---|---|---|
| 1 | 4 | 90.3 | 683 | 1390 | 368 | 0.5 | 12.5 | 42.4 | 0.5 | 12 | 29.9 | 1.1 | AK | 4.653 | 8.314 |
| 2 | 3 | 485 | 167 | 2383 | - | 2.3 | 4.73 | - | 2.3 | 2.5 | - | 2.2 | H | 4.633 | 8.305 |
| 3 | 4 | 154 | 475 | 4021 | 491 | 2.72 | 12.2 | 62.9 | 2.72 | 9.48 | 50.7 | 1.6 | AK | 4.645 | 8.302 |
| 4 | 3 | 398 | 285 | 5867 | - | 1.9 | 10.8 | - | 1.9 | 8.9 | - | 2.2 | H | 4.638 | 8.286 |
| 5 | 4 | 279.2 | 1042 | 1913 | 21.49 | 0.3 | 7 | 48.9 | 0.3 | 6.7 | 41.9 | 2.3 | AK | 4.663 | 8.251 |
| 6 | 3 | 42.4 | 2923 | 5579 | - | 0.8 | 7.9 | - | 0.8 | 7.2 | - | 2.3 | A | 4.68 | 8.242 |
| 7 | 3 | 510 | 4221 | 510 | - | 4.1 | 27.8 | - | 4.6 | 23.7 | - | 1.8 | K | 4.696 | 8.26 |
| 8 | 4 | 1010 | 4736 | 2787 | 1464 | 0.8 | 10.6 | 26.7 | 0.8 | 9.8 | 15.6 | 1.4 | KH | 4.703 | 8.245 |
| 9 | 4 | 1010 | 473 | 2847 | 1489 | 0.8 | 10.1 | 24.6 | 0.8 | 9.7 | 14 | 1.5 | HK | 4.684 | 8.263 |
| 10 | 3 | 867 | 6130 | 1587 | - | 3 | 18.6 | - | 3 | 15.5 | - | 1.9 | K | 4.687 | 8.264 |
| 11 | 3 | 53.1 | 1282 | 1586 | - | 0.5 | 19.1 | - | 0.5 | 18.6 | - | 2 | A | 4.711 | 8.26 |
| 12 | 3 | 42.4 | 1132 | 64.6 | - | 0.5 | 5.9 | - | 0.5 | 5.4 | - | 2.9 | H | 4.735 | 8.251 |
| 13 | 4 | 388 | 1596 | 8561 | 126 | 1 | 12.2 | 46.2 | 1 | 11.3 | 34 | 1.3 | AK | 4.804 | 8.219 |
| 14 | 4 | 365 | 1576 | 7581 | 117 | 1.1 | 14.5 | 47.3 | 1.1 | 13.3 | 32.8 | 1.6 | AK | 4.803 | 8.256 |
| 15 | 4 | 203.3 | 2532 | 629.4 | 845 | 0.5 | 1.34 | 9.58 | 0.5 | 0.8 | 8.2 | 4.5 | AK | 4.802 | 8.261 |
Table 1: Interpreted VES data for the subsurface studied.

Figure 5: Correlation of VES interpreted depth and nearby borehole depth data.
The interpretation also determines a shallow depth water table (about 1.5 m), which was used to define the unsaturated sediments and saturated sediments for the study area as presented in Table 2. It is a geoelectrical model correlated with the local lithology in items of prevalence of rock type. The lithology succession which defines the stratigraphic sequence for the study area shows that the aquifers are unconfined. The combination of Tables 1 and 2 aided the understanding of the spatial variation of geoelectrical parameters which demarcated the fresh water bodies and envisaged the identification of saline water ingress. This informed the interpretation of the relatively low resistivity value (21.49 Ωm) observed at the 4th geoelectrical layer along VES 5 column as saline water ingress into the aquifer. The attribution of low resistivity at this depth to saline water ingress is because there were no records of clay layer formation at this depth in the study area.
| Sediment | Lithology | Geoelectrical resistivity Ωm |
|---|---|---|
| Unsaturated sediments | Loamy top soil | 42.4 ≤ ρ ≤ 1184 |
| Saturated sediments | Medium grain sand layer | 167 ≤ ρ ≤ 6130 |
| Medium-coarse grain sand layer | 510 ≤ ρ ≤ 8561 | |
| Medium grain sand layer | 117 ≤ ρ ≤ 1489 |
Table 2: Identified lithology for the study area.
This is further supported by the fact that, in sedimentary environment high resistivity may largely be associated with the presence of fresh water in porous medium aquifer, while low resistivity may be due to the presence of clay or brackish water [25,27]. The facies variations were identified to be sands of various grain sizes forming the saturation sediments.
Table 3 presents Dar Zarrouk (D-Z) geoelectrical parameters deduced for the study area. These parameters were used to characterize aquifers, delineate the groundwater potential zones, its lateral extent and to estimate the aquifer protective capacity in the area as well as assessing its recharge capability. The low resistivity zone of the map is assumed to be the area of saline water ingress from the Atlantic Ocean. Arising from Table 3, contour maps for longitudinal conductance (S), transverse resistance (T), transverse resistivity (ρt), longitudinal resistivity (ρl), pseudoanisotropy (λ) and root mean square resistivity (ρrms) were constructed.
| VES | ρ (Ωm) | h(m) | S(Siemens) | T (Ωm2) | K(m/day) | Tr(m2/day) | ρT(Ωm) | ρL(Ωm) | λ | ρrms(Ωm) |
|---|---|---|---|---|---|---|---|---|---|---|
| 1 | 1390 | 29.2 | 0.021 | 40588 | 0.452 | 13.198 | 957.26 | 2019.05 | 0.69 | 1390.2 |
| 2 | 167 | 2.5 | 0.015 | 417.5 | 3.263 | 8.158 | 88.27 | 315.33 | 0.53 | 166.8 |
| 3 | 4021 | 50.7 | 0.0126 | 203864.7 | 0.1678 | 8.508 | 48.81 | 4992.06 | 0.1 | 493.6 |
| 4 | 285 | 8.9 | 0.0312 | 2536.5 | 1.9819 | 17.639 | 234.86 | 346.15 | 0.82 | 285.1 |
| 5 | 1913 | 41.9 | 0.0219 | 80154.7 | 0.3355 | 44.219 | 1639.16 | 2232.88 | 0.86 | 1913.3 |
| 6 | 2923 | 7.2 | 0.0025 | 21045.6 | 0.2259 | 1.626 | 2664 | 3160 | 0.92 | 2901.4 |
| 7 | 4221 | 23.7 | 0.0056 | 100037.7 | 0.1604 | 3.801 | 3598.48 | 4964.29 | 0.85 | 4226.6 |
| 8 | 2787 | 15.6 | 0.0056 | 43477.2 | 0.2362 | 3.685 | 1628.36 | 4767.86 | 0.58 | 2786.4 |
| 9 | 2847 | 14 | 0.0049 | 39858 | 0.2317 | 3.244 | 1620.24 | 5020.41 | 0.57 | 2852.1 |
| 10 | 6130 | 15.5 | 0.0025 | 95015 | 0.1132 | 1.755 | 5108.33 | 7440 | 0.83 | 6164.8 |
| 11 | 1282 | 18.6 | 0.0141 | 23845.2 | 0.4874 | 9.066 | 1248.44 | 1354.61 | 0.96 | 1300.4 |
| 12 | 1132 | 5.4 | 0.0048 | 6112.8 | 0.5474 | 2.956 | 1091.57 | 1229.17 | 0.94 | 1158.3 |
| 13 | 8561 | 34 | 0.0034 | 291074 | 0.0929 | 3.046 | 6300.38 | 13288.24 | 0.67 | 9149.9 |
| 14 | 7581 | 32.8 | 0.0043 | 248656.8 | 0.402 | 5.829 | 5257.01 | 11000 | 0.69 | 7604.4 |
| 15 | 629.4 | 8.2 | 0.013 | 5161.08 | 0.9465 | 7.761 | 543.27 | 736.92 | 0.85 | 632.7 |
Table 3: Dar Zarrouk geoelectrical parameters computed for aquifer zone in the study area.
Figure 6 presents groundwater zone for the study area showing isoresistivity (using rms values) and isopach maps of the saturated sediments. The root mean square (rms) value was preferred to the direct interpreted georesistivity because it further eliminates uncertainties from the interpreted results as well as helps in checking the certainty in the calculations of transverse resistivity (ρt) and longitudinal resistivity (ρl). It also justifies the consistency in the data.

Figure 6: Contour map for groundwater zone showing aquifers rms resistivity at C.I. of 500 Ωm and thickness at C.I. of 2 m.
The contour maps for transverse resistance, transmissivity, longitudinal conductance and anisotropy (Figure 7) clearly demonstrate the contour patterns of saline and fresh water aquifers over large regions with distinctly clear intermixing boundaries. This aided the identification of fresh water and saline water in the subsurface of the coastal environment studied. Besides, it provides useful evidences to overcome the problem of uncertainty, caused by resistivity data interpretation [24]. The maps of Dar Zarrouk geoelectrical parameters computed show that the transverse resistance (T) values were very high towards the Southeast part of the study area (Figure 7). Similar pictures are obtained for transverse resistivity and longitudinal resistivity maps, with the higher values directed towards the Southeast and these suggest the fresh water region. In sedimentary basins, high values of transverse resistance of phreatic zone is a pointer to aquifers interest, while the total longitudinal conductance of vadose layers best predicts the safety conditions of the aquifers [10,12].

Figure 7: Contour maps of aquifer’s D-Z geoelectrical properties for the study area.
The pseudoanisotropy (λ) of the aquifer zone for the study area calculated for every VES geoelectric column shows that all of the results gave value within the range 0.96 ≥ λ ≥ 0.1. The low values of anisotropy indicate that the rock constituting that aquifer’s unit in the study area do not differ significantly. This is typical of sedimentary formation. Figure 8 is the anisotropy map of the aquifer unit in the study area.

Figure 8: Resistivity anisotropy map for aquifer unit studied at C.I. of 0.5.
To determine the protective capacity of the aquifer zone (saturated zone) by the overburden using D-Z geoelectrical parameter, Table 4 was constructed for every VES point. Considering the overburden longitudinal conductance range (0.1 ≤ S >10 Siemens) for weak excellent protective capacity published by researchers [6,9,10,28,29], the overburden protection potential could be considered as being proportional to the ratio of thickness to resistivity (longitudinal conductance).
| VES | ρ(Ωm) | h1(m) | Lat | Long | S(Siemens) | Remark |
|---|---|---|---|---|---|---|
| 1 | 90.3 | 0.5 | 4.653 | 8.314 | 0.006 | V |
| 2 | 485 | 2.3 | 4.633 | 8.305 | 0.005 | V |
| 3 | 1184 | 0.8 | 4.645 | 8.302 | 0 | V |
| 4 | 398 | 1.9 | 4.638 | 8.286 | 0.005 | V |
| 5 | 279.2 | 0.3 | 4.663 | 8.251 | 0.001 | V |
| 6 | 42.4 | 0.8 | 4.68 | 8.242 | 0.019 | V |
| 7 | 510 | 4.6 | 4.696 | 8.26 | 0.009 | V |
| 8 | 1010 | 0.8 | 4.703 | 8.245 | 0 | V |
| 9 | 1010 | 0.8 | 4.684 | 8.263 | 0 | V |
| 10 | 867 | 3 | 4.687 | 8.264 | 0.003 | V |
| 11 | 53.1 | 0.5 | 4.711 | 8.26 | 0.009 | V |
| 12 | 42.4 | 0.5 | 4.735 | 8.251 | 0.012 | V |
| 13 | 388 | 1 | 4.804 | 8.219 | 0.003 | V |
| 14 | 365 | 1.1 | 4.803 | 8.256 | 0.003 | V |
| 15 | 203.3 | 0.5 | 4.802 | 8.261 | 0.002 | V |
Table 4: Dar Zarrouk parameter and groundwater resources vulnerability [V indicates vulnerability of groundwater resources to contamination].
The low range of overburden thickness (between 0.3-4.6 m) as well as the associated low values for overburden’s longitudinal conductance (0.000-0.019 Siemens) suggested that aquifers in the study area are not naturally protected, therefore, are at probable high risk of contamination from environmental activities and saline water ingress. This result is in support of Orza and Panea [30] and Emmanuel [21]. They noted in their study on “estimation of the natural protective capacity of an aquifer system using surface geophysical” that low overburdens’ longitudinal conductance is an indicator of low protective capacity of the aquifer by the overburden materials. Figure 9 is the map of the overburden protective nature determined for the area studied.

Figure 9: Contour map of overburden materials showing low longitudinal conductance of the study area at C.I. of 0.001.
The study was aimed at identifying lithology, estimating the relationship between Dar Zarrouk (D-Z) parameters and geoelectrical resistivity with groundwater resources protection. Geophysical technique involving the use of ground-based earth resistance measuring device was used to measure geoelectrical properties of the subsurface. Interpreted data shows that the aquifers delineated are unconfined and consist of sands of medium grain sizes. The high rms resistivity of the subsurface indicates opulent groundwater resources. Place with high transverse resistivity values were observed to produce high transmissivity and are potential areas were monitory wells can be drilled. This further explains the abundant of groundwater in most parts of the study area. However, the low values of the Dar Zarrouck variable (longitudinal conductance) are pointers to likely vulnerable location. For instance, the protective capacity of the overburden using the longitudinal conductance values which ranged between 0.000- 0.019 Siemens, with overburden thickness that varies between 0.3 and 4.6 m, explain that the entire aquifer is at risk of contamination from environmental activities. Also, saline water ingress is most likely to occur at depth greater than 40 m within VES 5. This is due to the very low resistivity value (21.49 Ωm) without the presences of clay mineral within the depth of current penetration. The results show that the Dar- Zarrouk (D-Z) parameters provide a useful and confident solution in delineating the saline and fresh water aquifers. The identified aquifer’s thickness, likely contamination of site, protection capacity could help in the planning, monitoring and management of potable water supply and development in deltaic coastal aquifer system.