Research Article - (2023)Volume 9, Issue 1
Mortality Rate and its Predictors among Adult Tuberculosis Patients in Debre Markos Referral Hospital, North West Ethiopia
Eyerus Tesfaw Addis1*, Getiye Dejenu1, Atsede Alle1, Animut Takele1, Samueal Derbie1 and Yichalem Worku2Abstract
Background: Tuberculosis is an infectious disease caused by the bacillus Mycobacterium tuberculosis. In spite of this, tuberculosis is curable; causes ill health in millions of people each year. It was one of the top 10 causes of death worldwide and the second cause of death in Ethiopia in 2015.
Objective: The aim of this study was to estimate mortality rate and its predictors among tuberculosis patients in Debre Markos Referral Hospital.
Methods: Institution-based retrospective follow up study was conducted among 570 tuberculosis cases at Debre Markos Referral Hospital. Data was collected from February 1 to 20/2018. A pretested checklist was used to extract the necessary data from patient record document selected using simple random sampling methods from eligible tuberculosis cases registered from January 1/2008 to June 30/2017. The collected data was entered using Epi Data version 4.2, while the analysis was done by using STATA statistical software version 14.0. Kaplan Meier method was used to estimate survival probability and Cox’s proportional hazards model was used to identify predictors of mortality.
Results: From 569 tuberculosis patients 47(8.3%) died during the follow up period. The general mortality rate was 17.3 per 1000 person months. From the total number of death (47), 65% died during the two months of treatment period. Tuberculosis patients with 31-45 age group (HR=2.93, 95% CI=1.36-6.33), 46-60 age group (HR=4.16, 95% CI=1.75-9.85) and older than 60 age group (HR=13.1, 95% CI=4.24-40.53) were 2.9, 4.2 and 13 times more likely to die early than 18-30 age group respectively. Patients with body weight >35 kg at the onset of tuberculosis treatment were 69% less likely to die than patients with body weight ≤35. (HR=0.31, 95%CI=0.12-0.79). TB/HIV co-infected patients were 2 times higher risk of dying at any time in the follow up compared to HIV negative patients (HR=2.18, 95% CI=1.09-4.23).
Conclusions: More than half of deaths occur in two months of treatment period. Patients with HIV positive, older age and less than 35 kg body weight were at increased risk of death during treatment period. Therefore, they need special follow up and support.
Keywords
Predictors, Mortality rate, TB, Human immunodeficiency virus
Abbreviations
AIDS: Acquired Immune Deficiency Syndrome; ART: Anti-Retroviral Therapy; CPT: Cotrimoxazole Preventive Therapy; DOT: Directly Observed Treatment; DOTS: Directly Observed Therapy Short Course; DMRH: Debre Markos Referral Hospital; EPTB: Extra Pulmonary Tuberculosis; HIV: Human Immunodeficiency Virus; IPT: Isoniazid Preventive Therapy; OS: Overall Survival; PLWH: People Living With HIV; PTB: Pulmonary Tuberculosis; SSA: Sub Saharan Africa; TB: Tuberculosis; WHO: World Health Organization
Introduction
Tuberculosis (TB) is an infectious disease caused by a bacterium called Mycobacterium tuberculosis. It typically attacks the lungs (pulmonary TB) but can also attack other sites (extra pulmonary TB). The disease transmits when people are sick with pulmonary TB and expels bacteria into the air, for example by sneezing, coughing. Overall, a relatively small proportion (5%-15%) of the estimated 2-3 billion people infected with Mycobacterium tuberculosis will develop TB disease during their lifetime [1].
World Health Organization (WHO) sets targets in the end TB Strategy include a 90% reduction in TB deaths and an 80% reduction in TB incidence by 2030, compared with 2015.And the most immediate milestones, set for 2020, is a 35% reduction in TB deaths and a 20% reduction in the TB incidence rate, compared with levels in 2015 [2]. Identification of predictors of death is important in reducing TB incidence, morbidity and mortality in affected individuals and may help in contributing to the achievement of the treatment targets.
Despite the significant investment in TB care and treatment, many adult patients treated for TB in Ethiopia clinics died before completing treatment. There are different risk factors for the death adult during treatment. Some of them are low baseline weight at initiation of treatment, age, gender, residence, type of TB, HIV co infection, category of TB and not receiving co-trimoxazole preventive therapy and ART among HIV positive [3-6].
Study has not been done in this study area to characterize patients that died while on TB treatment. This study investigates TB reported deaths among adult patients treated between January 2008 and June 2017 to estimate survival probability and identifies predictors of mortality among TB patients.
Materials and Methods
Study design area and period
A retrospective follow up study design was used. And the study was conducted at Debre Markos Referral Hospital TB clinic from fbriary 1-20, 2018 North West Ethiopia, which is 300 km away from Addis Ababa. The hospital provides health service to more than 3.5 million populations in its catchments.
Population
Source population: All adult tuberculosis patients in Debre Markos referral hospital.
Study population: All adult TB patients who were registered in short term directly observed treatment from January 1/2008 to December 30/2017 at Debre Markos referral hospital.
Sample size determination and sampling procedure
Sample size was determined using the formula for survival analysis.
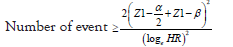
Where,
(α) Significance level=0.05
β=1-Power 0.2
HR: Hazard ratio
N: (number of event)/ (probability of event)
By using STATA 14st power command “stpower logrank 0.907, h ratio (0.389), wdprob (0.05), power (0.8) schoenfeld”.
Calculated sample size was observed in Table 1.
| Variable | Pro.event | Hazard ratio | No. event | Sample size |
|---|---|---|---|---|
| Wt. | 0.09 | 0.389 | 36 | 542 |
| HIV status | 0.09 | 0.01 | 2 | 32 |
| 570 |
Note: Missing value 5%.
Table 1: Variable sample sizes for HIV patient.
The maximum sample size was 570.
Computer generated simple random sampling method was used to recruit the predetermined sample size from 923 eligible tuberculosis patients using medical register number.
Operational definitions
Event: Death from initiation of anti TB to end of treatment.
Time origin: Initiation of anti TB.
Censor: Individuals with all TB treatment outcomes including lost to follow-up except death.
Cured: A patient who was initially smear-positive and who was smear-negative in the last month of treatment and on at least one previous occasion.
Completed treatment: A patient who completed treatment but did not meet the criteria for cure or failure.
Died: A patient who died from any cause during treatment.
Failed: A patient who was initially smear-positive and who remained smear-positive at month.
5 or later during treatment.
Defaulted: A patient whose treatment was interrupted for two consecutive months or more.
Transferred out: A patient who transferred to another reporting unit and for whom the treatment outcome was not known.
Successfully treated/Cured: A patient who was cured or who completed treatment.
Data collection procedures
The data were collected by reviewing registers, follow up form. Two nurses working at the TB clinic of DMRH were recruited and trained about methods of data collection for two days.
Data collection tool
Data extraction checklist developed using standardized TB entry and follow up form employed by the TB clinic was utilized to extract the required data from patient records.
Data quality assurance
The quality of data was maintained by designing the proper data collection materials and through continuous supervision. All completed data were examined for completeness and consistency during data management and analysis. Pretest was conducted in Debre Markos Referral Hospital. The data were entered and cleaned by a data clerk and the principal investigator before analysis.
Data processing and analysis
The data extracted from the registration book were checked for completeness and consistency. The collected data were entered using Epi Data version 4.2, while the analysis was done by using STATA statistical software version 14. Descriptive statistical methods were used to summarize the socio-demographic characteristics of the study participants. Kaplan Meier method with log rank test was used to estimate survival probability. Cox’s proportional hazards model was used to identify predictors of mortality within treatment period using backward stepwise procedure. Variables showing significant association (P<0.25) in the bi-variable analysis were included in the multivariable Cox’s proportional hazards model. Adjusted Hazard Ratio (AHR) with corresponding 95% confidence interval was considered to declared significance of predictor variables.
Results and Discussion
Demographic and clinical characteristics
In this retrospective document analysis from January 1/2008 to June 30/2017, socio demographic and medical information of 569 registered TB patients was summarized. Out of the total study participants 299 (52.55%) were males and 472 (82.95%) were from urban areas. According to their HIV status 57.3% of the study subjects were HIV negative, and their TB type 17.4% were smear positive pulmonary TB, 33.74% were extra pulmonary TB patients and 48.68% were smear negative pulmonary TB. Among 559 (98.94%) TB patients who were tested for HIV, 238 (42.35%) tested HIV positive. Of those who were tested positive for HIV, 175 (74.15%) were on antiretroviral therapy (Table 2).
| Character | Frequency | Percentage | |
|---|---|---|---|
| Sex | Male | 299 | 52.55 |
| Female | 270 | 47.45 | |
| Age | 18-30 | 305 | 53.61 |
| 31-45 | 166 | 29.17 | |
| 46-60 | 80 | 14.06 | |
| >60 | 18 | 3.16 | |
| Baseline Weight | ≤ 35 | 36 | 6.33 |
| >35 | 533 | 93.67 | |
| Residence | Urban | 472 | 82.95 |
| Rural | 97 | 17.05 | |
| TB type | Smear positive | 99 | 17.4 |
| Smear negative | 278 | 48.86 | |
| Extra pulmonary | 192 | 33.74 | |
| HIV status | HIV positive | 238 | 41.83 |
| HIV negative | 322 | 56.59 | |
| Unknown | 9 | 1.58 | |
| ART initiate (236) | Yes | 175 | 74.15 |
| No | 61 | 25.85 | |
| CPT initiate (238) | Yes | 231 | 97.06 |
| No | 7 | 2.94 |
Table 2: Baseline demographic and clinical characteristics of adult TB patients in DMRH, North West Ethiopia 2008-2017.
From the total of TB cases, 84 (14.87%) were cured and 343 (60.71%) completed their treatment. Patients treated successfully were 75.58%. The number of patients died during treatment was 47(8.3%) (Figure 1).

Figure 1: Tuberculosis treatment outcome of adult TB patients in DMRH from 2008-2017.
Rate of death among TB patients
The whole patients (569) were followed for a total of 2,711 person months. From the total patients, 47(8.3%) cases were died. The overall mortality rate was 17.3 (95%CI=13.0-23.0) per 1000 person months. Of the 569 registered patients 522(91.7%) survived at the entire follow up period. Of all the TB deaths, 31 (65.95%) occurred during the intensive phase and the rest 16 (34.04%) died during the continuation phase of TB treatment. The cumulative survival probability at the end of the intensive and the continuation phase was 93% and 90.6%, respectively. The minimum and maximum follow up time was 0.33 and 8.7 months respectively with median follow up time of 5.7 months (Table 3).
| Time interval in months | Beginning total | Deaths | Lost | Cumulative | 95% confidence interval |
|---|---|---|---|---|---|
| Survival probability | |||||
| 0-1 | 569 | 19 | 75 | 0.96 | 0.94-0.97 |
| 1-2 | 475 | 17 | 12 | 0.93 | 0.90-0.94 |
| 2- 3 | 446 | 6 | 5 | 0.92 | 0.89-0.94 |
| 3- 4 | 435 | 4 | 3 | 0.91 | 0.88-0.93 |
| 4-5 | 428 | 1 | 16 | 0.9 | 0.87-0.93 |
| 5-6 | 411 | 0 | 221 | 0.9 | 0.87-0.93 |
| 6-7 | 190 | 0 | 167 | 0.9 | 0.87-0.93 |
| 7-8 | 23 | 0 | 16 | 0.9 | 0.87-0.93 |
| 8-9 | 7 | 0 | 7 | 0.9 | 0.87-0.93 |
Table 3: Survival probability of TB patients throughout the course of TB treatment in Debre Markos Referral Hospital, Northwest Ethiopia 2008–2017.
There were statistically significant observed survival curve difference with Kaplan Meier plot among the difference categories of age, HIV status and weight (Figures 2, 3 and 4).

Figure 2: Kaplan Meier survival estimate of TB patients among difference age group in Debre Markos Referral Hospital, North West Ethiopia from
2008-2017. 

Figure 3: Kaplan Meier survival estimate of TB patients among difference weight group in Debre Markos Referral Hospital, North West Ethiopia
from 2008-2017. 

Figure 4: Kaplan Meier survival estimate of TB patients among difference HIV status in Debre Markos Referral Hospital, North West Ethiopia from
2008-2017. 
Predictors of mortality among TB patients
On bi-variable analysis variables, age, TB type, HIV status and weight, have association with increasing death rate. However, predictor’s sex, residence, CPT initiate, and ART initiate among HIV positive TB patients had not statistically significant association. According to multivariable Cox regression analysis, three variables were found to be independent predictors for an increased rate of death during the TB treatment, including age, baseline body weight and HIV status of the patients.
Tuberculosis patients with 31-45 age group (HR=2.93, 95% CI=1.36-6.33), 46-60 age group (HR=4.16, 95% CI=1.75-9.85) and older than 60 age group (HR=13.1, 95% CI=4.24-40.53) were 2.9, 4.4 and 12.4 times more likely to die early than 18-30 age group respectively. Patients with body weight >35 kg at the onset of tuberculosis treatment were 69% less likely to die compared to patients with body weight ≤35 (HR=0.31, 95% CI=0.12-0.79). HIV positive TB patients were 2 times more likely to die during tuberculosis treatment period compared to HIV negative TB patients. (HR=2.18, 95% CI=1.09-4.23) (Table 4).
| Variables | Event (%) | Censored (%) | CHR (95% CI) | AHR (95% CI) | P value | |
|---|---|---|---|---|---|---|
| Sex | Female | 24(51.04) | 246(47.1) | 1 | 1 | |
| Male | 23(48.94) | 276(52.8) | 0.82(0.46-1.45) | 0.87(0.47-1.59) | 0.66 | |
| Residence | Rural | 7(14.89) | 90(17.24) | 1 | 1 | |
| Urban | 40(85.11) | 432(82.7) | 0.69(0.31-1.55) | 0.73(0.32-1.68) | 0.46 | |
| TB type | Smear negative TB | 28(59.57) | 250(47.8) | 1 | 1 | |
| Extra pulmonary TB | 13(27.66) | 179(34.2) | 0.56(0.29-1.09) | 0.77(0.39-1.53) | 0.46 | |
| smear positive TB | 6(12.77) | 93(17.82) | 0.51(0.21-1.23) | 0.61(0.25-1.52) | 0.29 | |
| Age group | 18-30 | 11(23.40) | 294(56.3) | 1 | 1 | |
| 31-45 | 20(42.55) | 146(27.9) | 3.74(1.79-7.80) | 2.93(1.36-6.33) | 0.006 | |
| 45-60 | 11(23.40) | 80(14.06) | 4.36(1.89-10.07) | 4.16(1.75-9.85) | 0.001 | |
| >60 | 5(10.64) | 13(2.49) | 8.56(2.97-24.65) | 13.1(4.24-40.53) | <0.001 | |
| Weight group | ≤ 35 | 6(12.77) | 30(5.75) | 1 | 1 | |
| >35 | 41(87.23) | 492(94.2) | 0.36(0.15-0.860 | 0.31(0.12-0.79) | 0.014 | |
| HIV status | HIV negative | 27(57.45) | 211(40.4) | 1 | 1 | |
| HIV positive | 27(57.45) | 211(40.4) | 1.97(1.1-3.5) | 2.18(1.09-4.23) | 0.027 |
Table 4: Multivariable Cox’s proportional hazard model of predictors of mortality during treatment period in DMRH, North West Ethiopia 2018.
This retrospective follow up study was conducted to estimate mortality rate and its predictors among TB patients during the treatment period in Debre Markos Referral Hospital, Northwest Ethiopia. In this study, the proportion of treatment success was 75.58%, which is lower than studies conducted in, Tigray region (89.2%), Debre Tabor (87.1%) and Infranze health center (94.8%) [7-9]. This might be due to higher proportion of transfer patients to their nearest health center. This is higher than proportion TB treatment success (65.3%) in Metema [10]. Of the total 569 registered TB patients 522 (91.7%) were censored during the whole follow up period. Therefore, the mortality in this study was 8.3% that was consistent with mortality found in Gondar University Teaching Hospital (10.1%) [11]. This was higher than the mortality found in Northwest Ethiopia Metema hospital (3.4%). Enfranze health center (3.9%), Tigray region (3%) and Debre Tabor (5.6%) [7-10]. This may be due to difference study population. Nevertheless, lower than in those previous reports in: Nigeria (16.6%), rural south India (20.4%) [4,12].
In this study, the overall mortality rate of tuberculosis patients during their treatment period was 17.3 per 1000 person months. This is consistent with a mortality rate of 15 per 1000 person months in Dessie, Ethiopia [13]. This is higher than in previous reports in Dangla woreda and Addis Ababa where the overall mortality rate was 12.8 per 1000 person months and 63/1000 person year observation respectively [5,14]. This may be due to different population.
Among the total number of death majority (65.95%) occur during the intensive phase of treatment period. Moreover (34.04%) of death occur during continuous phase. This may be due to delayed presentation and diagnosis of TB cases that leads to advancement of the disease. This is consistent with study in Addis Ababa that is 65% of died occurred during intensive phase of period [14]. In addition this is higher than previous studies in Francis town 50% [15] and in Dangla woreda Ethiopia 57% of death occur during intensive phase of treatment period [5].
In the present study, the cumulative survival probabilities were 96% after the first month of treatment, 93% after the two months, 92% after three months and 90% after six months. This is lower than study conducted in Addis Ababa that the survival probabilities were 97.5%, after the first month of treatment, 96% after the 3 months, 95% after 6 months and 93% after 1 year [14].
This study showed that patients with a body weight of >35 kg had 69% less likely to die than patients with a body weight of ≤35 kg. This shows positive effect of nutrition on survival of TB patients. This study is similar with a study from Dangla woreda which showed that patients weighting less than or equal to 35 kg had 3.9 times higher rate of death than patients with baseline weight of more than 35 kg [5]. Similarly in Addis Ababa showed that patients more than 34 kg at the initiation of TB treatment were 11.5% less likely to die than patients were less than or equal to 34 kg [14].
In this study, the mortality rate of death in TB patients of advanced age group was higher compared to younger patients. This finding is similar with studies reported an increased mortality rate of death in older patients than younger patients [3,16,17].
In the present study, patients aged 31-45 years, 46-60 years and those older than 60 years were 2.9, 4.1 and 13.1 times more likely to die than patients were 18-30 years respectively. This is similar with study in Dangla woreda Ethiopia, there was a 5.2% increase in death rate for every year increase in age [5,15].
In the present study, HIV-positive TB patients had higher mortality rate than HIV-negative TB patients (HR=2.18; 95% CI=1.09-4.23), which may be due to the general immunosuppression of HIV-positive patients [18,19].
Conclusion
This is similar with previous prospective study that HIV positive patients were died earlier than HIV negative TB patients were (HR=22.1; 95% CI=7.3-66.4). Furthermore, report from Francis town showed that HIV positive patients had higher mortality rate than HIV negative patients. In contrast to this study in Hawassa showed that the HIV status was not significantly associated with early death of TB patients. Most TB deaths occurred in the first two months of TB treatment. Age, weight and HIV status were found to be independent predictors for an increased rate of death during the TB treatment.
Ethical Consideration
Ethical clearance was obtained from research and Ethical Review Board of Debre Markos University, college of health science, and permission was obtained from Debre Markos Referral Hospital and TB clinic. As the study conduct through review of medical records, the individual patients was not be subjected to any harm as far as the confidentiality is kept. No personal identifiers were used on data collection form. A third person was not access the recorded data.
Consent for Publication
Not Applicable
Availability of Data and Materials
The datasets used and/or analyzed during the recent study are available from the corresponding authors on reasonable request. Correspondingly, all relevant data are found in the paper.
Competing Interests
The authors announce that they have no conflict of interests in this work
Funding
Debre Markos University sponsored a financial issue to carry out this work.
Author's Contributions
The authors’ responsibilities were as follows: E.T participated in the conceptualization and writing original draft; G.D software and data curation; A.A and S.D .methodology and supervision; A.T, E.T and Y.W perform formal analysis and validation. All authors also highly participated in preparing and revising this final manuscript and approved the final manuscript.
Acknowledgements
The authors would like to thank all participants involved in the study and the staff of the data collection team. We are grateful to the Debre Markos. Referral Hospital TB unit workers for their cooperation and provision of basic information and uninterrupted support during work.
References
- World Health Organization. Global tuberculosis report 2013.
- Uplekar M, Weil D, Lonnroth K, Jaramillo E, Lienhardt C, Dias HM, et al. WHO's new end TB strategy. Lancet. 2015;385(9979):1799-1801.
- Shuldiner J, Leventhal A, Chemtob D, Mor Z. Mortality of tuberculosis patients during treatment in Israel, 2000–2010. Int J Tuberc Lung Dis. 2014;18(7):818-823.
- Adamu AL, Gadanya MA, Abubakar IS, Jibo AM, Bello MM, Gajida AU, et al. High mortality among tuberculosis patients on treatment in Nigeria: a retrospective cohort study. BMC Infect Dis. 2017;17(1):1-1.
- Birlie A, Tesfaw G, Dejene T, Woldemichael K. Time to death and associated factors among tuberculosis patients in Dangila Woreda, Northwest Ethiopia. PLoS One. 2015;10(12):e0144244.
- Moolphate S, Aung MN, Nampaisan O, Nedsuwan S, Kantipong P, Suriyon N, et al. Time of highest tuberculosis death risk and associated factors: an observation of 12 years in Northern Thailand. Int J Gen Med. 2011;4:181.
- Berhe G, Enquselassie F, Aseffa A. Treatment outcome of smear-positive pulmonary tuberculosis patients in Tigray Region, Northern Ethiopia. BMC public health. 2012;12(1):1-9.
- Endris M, Moges F, Belyhun Y, Woldehana E, Esmael A, Unakal C. Treatment outcome of tuberculosis patients at Enfraz Health Center, Northwest Ethiopia: a five-year retrospective study. Tuberc Res Treat. 2014.
- Melese A, Zeleke B, Ewnete B. Treatment outcome and associated factors among tuberculosis patients in Debre Tabor, Northwestern Ethiopia: a retrospective study. Tuberc Res Treat. 2016.
- Jemal M, Tarekegne D, Atanaw T, Ebabu A, Endris M, Tessema B, et al. Treatment outcomes of tuberculosis patients in Metema hospital, Northwest Ethiopia: a four years retrospective study. Mycobact Dis. 2015;5(4).
- Tessema B, Muche A, Bekele A, Reissig D, Emmrich F, Sack U. Treatment outcome of tuberculosis patients at Gondar University Teaching Hospital, Northwest Ethiopia. A five-year retrospective study. BMC public Health. 2009;9(1):1-8.
- Kolappan C, Subramani R, Kumaraswami V, Santha T, Narayanan PR. Excess mortality and risk factors for mortality among a cohort of TB patients from rural south India. Int J Tuberc Lung Dis. 2008;12(1):81-6.
- Beyene Y, Geresu B, Mulu A. Mortality among tuberculosis patients under DOTS programme: a historical cohort study. BMC public health. 2016;16(1):1-6.
- Getahun B, Ameni G, Biadgilign S, Medhin G. Mortality and associated risk factors in a cohort of tuberculosis patients treated under DOTS programme in Addis Ababa, Ethiopia. BMC Infect Dis. 2011;11(1):1-8.
- Dare K. Predictors of death among tuberculosis patients while on treatment in local health facilities in Francistown. 2016.
- Hannah HA, Miramontes R, Gandhi NR. Sociodemographic and clinical risk factors associated with tuberculosis mortality in the United States, 2009-2013. Public Health Rep. 2017;132(3):366-375.
- Lefebvre N, Falzon D. Risk factors for death among tuberculosis cases: analysis of European surveillance data. Eur Respir J. 2008;31(6):1256-60.
- Abedi S, Moosazadeh M, Afshari M, Charati JY, Nezammahalleh A. Determinant factors for mortality during treatment among tuberculosis patients: Cox proportional hazards model. Indian J Tuberc. 2019;66(1):39-43.
- Shaweno D, Worku A. Tuberculosis treatment survival of HIV positive TB patients on directly observed treatment short-course in Southern Ethiopia: A retrospective cohort study. BMC Res. 2012;5(1):1-8.
Author Info
Eyerus Tesfaw Addis1*, Getiye Dejenu1, Atsede Alle1, Animut Takele1, Samueal Derbie1 and Yichalem Worku22Department of Midwifery, Health Science Collage, Debre Markos University, Debre Markos, Ethiopia
Citation: Addis ET, Dejenu G, Alle A, Takele A, Derbie S, Worku Y (2023) Mortality Rate and its Predictors among Adult Tuberculosis Patients in Debre Markos Referral Hospital, North West Ethiopia. Appli Microbiol Open Access. 9:243.
Received: 13-Jan-2023, Manuscript No. AMOA-23-21384; Editor assigned: 16-Jan-2023, Pre QC No. AMOA-23-21384 (PQ); Reviewed: 01-Feb-2023, QC No. AMOA-23-21384; Revised: 09-Feb-2023, Manuscript No. AMOA-23-21384 (R); Published: 17-Feb-2023 , DOI: 10.35284/2471-9315.23.9.243
Copyright: © 2023 Addis ET, et al. This is an open-access article distributed under the terms of the Creative Commons Attribution License, which permits unrestricted use, distribution, and reproduction in any medium, provided the original author and source are credited.