Journal of Geology & Geophysics
Open Access
ISSN: 2381-8719
ISSN: 2381-8719
Research Article - (2013) Volume 2, Issue 4
The aim of the study is to delineate the morphometric characteristics of Kangshabati-Darkeswar Interfluves Area using remote sensing and GIS technology. 10 km2 grids were elaborate to delineate the relief characteristics using Advance Space Thermal Emission and Radiometer (ASTER) data. Drainage networks were automatically extracted from digital aster elevation models. Second order local polynomial (LP) interpolation technique was used to estimate the surface characteristics of the study area using ArcGIS 9.3. The absolute elevation of the study region is extended between 4.0-949.29 m with an average elevation of 484.50 m. The highest relative relief resulted 833.69 m, whereas the average ruggedness index of the study area is recorded as 0.09 per 10 km2 area. The average drainage density of the study area was computed 0.73/sq. km and the highest drainage intensity are recorded as 9.58/10 km2 grid area. The average length of overland flow of the study area was 2.56/10 km2 grid areas. The result of the study highlights an about the spatial distribution of relief and hydrological characteristics which may provide the knowledge to devise and accomplish an appropriate plan to progress agriculture and others allied activities. Hence, from the study, it can be concluded that remote sensing data (ASTER –DEM) coupled with GIS techniques prove to be a competent tool in morphometric analysis and the data can be used for basin or interfluves area management and other hydrological studies in future.
Keywords: Remote sensing, GIS, Morphometry relief characteristics,Drainage characteristics
Morphometric characteristics are the dimension and mathematical evaluation of the configuration of the earth’s surface [1]. Moreover, the morphometric characteristics may control imperative information concerning its formation and growths due to all hydrologic and geomorphic processes occur within the watershed. Morphometric techniques have been applied to a variety of earth surface features and proven to be very effective in planning and management of land surface processes [2,3]. There have been few quantitative investigations of the Lateritic upland region of West Bengal. While, more attention has been given to the morphometric and spatial distribution parameters of its surroundings. Furthermore, recognition of drainage networks within the watershed region can be obtained using conventional methods like field observations and topographic maps or instead with remote sensing and GIS technology [3,4]. However, due to absence of topographic maps in adequate scale, or the availability of data, it is difficult to observe all drainage networks from field observations by conventional methods in rough terrain and inaccessible areas.
The Remote sensing and GIS technology are a convenient method to study the morphometric characteristics as the satellite images provides detailed information of earth surface features with its synoptic coverage, high receptivity, cost effectiveness [5]. Furthermore, Digital elevation models (DEMs) are progressively more used for visual and mathematical analysis of topography, landscapes and landforms, as well as modeling the surface processes [6-8]. Actually, the automatic generation of a DEM from remotely sensed data with sub-pixel precision is promising [9] Application of GIS to spatial data has proven to be instrumental in the analysis of complex problems in the earth and environmental sciences.
The varying nature of surface characteristics due to natural hazard (e.g. agricultural drought) is a persistent phenomenon in the western part of West Bengal during the last two-three [10,11]. Due to uneven distribution of the surface properties, soil moisture and inadequate rainfall played an important role for the growth of healthy crop and cause extreme crop stress and wilt. The study of morphometric characteristics of the lateritic upland area will reveal an apparent idea about the spatial distribution of relief and hydrological characteristics and will provide the knowledge to devise and accomplish an appropriate plan to progress agriculture and others allied activities. Hence, in the present study we investigated the morphometric characteristics of Kangshabati-Darkeswar Interfluves Area using remote sensing and GIS technology.
The Kangshabati-Darkeswar Interfluves Area is extended between 24°04’02.76” N- 21°44’45.33” N latitude and 85°34’27.02” E - 87°59’46.05” E longitude (Figure 1). The Interfluves area is bounded in the Hazaribagh in North, Baripada in the South, Bardwan in the East and Ranchi in the West. It is surrounded by lateritic soil, older and younger alluvial soil, red gravel soil and red sandy soil. Geological properties of the study area showed fine and medium sands, unconsolidated sands, silt and clay, fragment of pebbles and boulder, granite gneiss, quartzite and mica schist. Geomorphologically, the study area is characterized by floodplains, upland plains, badlands, duricrust, paradeltaic fan surfaces, pediments, pediplains, ridges and hills [12].
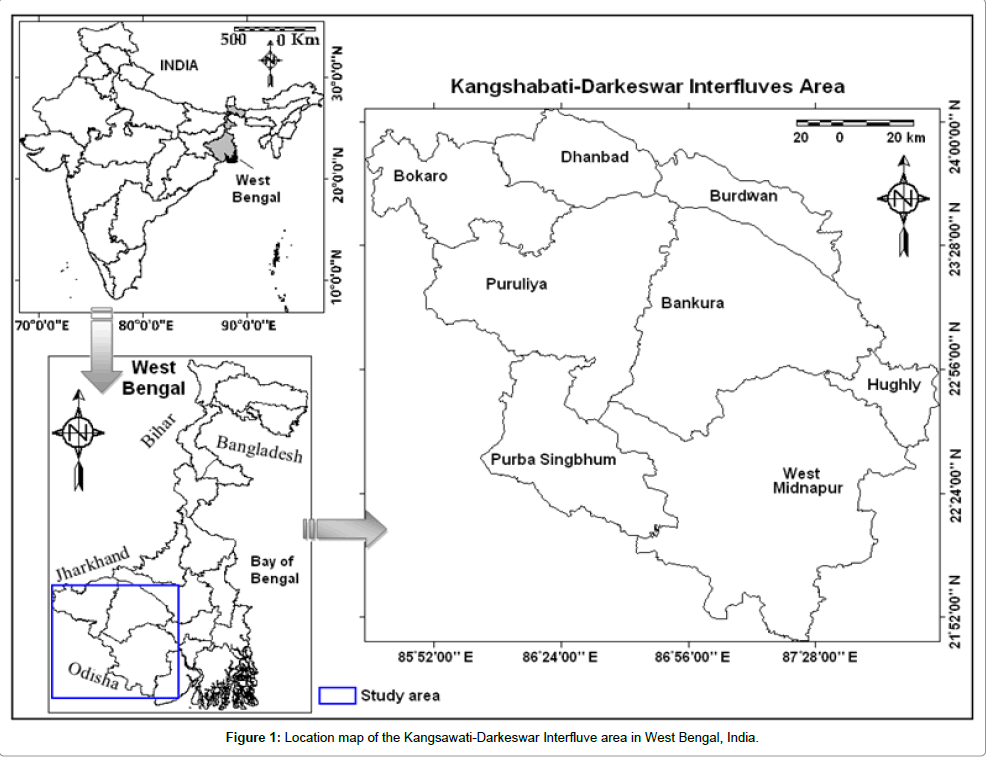
Figure 1: Location map of the Kangsawati-Darkeswar Interfluve area in West Bengal, India.
The morphometric analysis of the study area was carried out using the Advance Space Thermal Emission and Radiometer (ASTER, Spatial resolution-30 m). ASTER GDEM data was downloaded from the ASTER GDEM Project of Japan-US ASTER Science Team (http://gdem.ersdac.jspacesystems.or.jp/). For the present study a total of 16 ASTER GDEM scenes (i.e., ASTGTM2 - N21E086, N21E087, N22E085, N22E086, N22E087, N22E088, N22E089, N22E090, N23E085, N23E088, N23E089, N23E090, N24E087, N24E088 and N24E089). 10 km2 grids were generated to delineate the relief characteristics. A total of 363 grids were generated using GIS to extract the morphometric characteristics of the study sites. For each grid maximum, minimum and mean elevation was obtained separately. According to [13], the maximum rate of change in value from each cell to its neighbors is identified as slope in grid areas. The digital Elevation Model (DEM) was computed to deduce the morphometric measurement like, absolute relief, relative relief [14], dissection index [15], ruggedness index [16,17], drainage characteristics (e.g., drainage density, drainage frequency) [18], infiltration number [19], overland flow [20]. Drainage networks were automatically extracted from digital elevation models coupled with the constant stream threshold value based on the method proposed by [21].
Relative relief was derived as the difference in height between the highest and the lowest points (height) in a unit area. The study area has been categorized into ten relative relief characteristics based on the geometric interval methods. Dissection index is calculated, as the ratio between relative relief and absolute relief. Ruggedness index was computed to evaluate the complexity of topography and the roughness of the terrain. Frequency of drainage can be defined as the number of drainage segments per 10 km2 grid area. Drainage density (DD) refers as the ratio of total length of streams of all orders with in the basin to the basin area or per unit area, is expressed in terms of km/ sq. km [18]. Drainage texture ratio (RT) refers to the relative spacing of drainage lines. Stream ordering is defined as a measure of the position of a stream in the hierarchy of tributaries [22]. The length of overland flow approximately equals to half of the reciprocal of drainage density [20]. According to Smith’s classification of drainage texture, the texture value below 4 is designated as coarse; 4-10 as intermediate; above 10 as fine and above 15 as ultra-fine texture. Infiltration number is the product of drainage density and stream frequency which provides an idea of the infiltration characteristics of the basin. Drainage intensity refers to the ratio of the stream frequency to the drainage density [19].
Second order local polynomial (LP) interpolation technique was used to estimate the surface characteristics of the study area using ArcGIS v 9.3. The advantage of this technique is that it is a quite quick deterministic interpolator that is smooth and more flexible than the global polynomial method [23]. As such, there is no measurement of prediction errors and this method does not let you to examine the autocorrelation of the data, making it less flexible and more automatic than Kriging techniques.
Absolute relief
The descriptive characteristics of each morphometric analysis of the study area are represented in Table 1. The absolute elevation of the study region is between 4.0-949.29 m with an average elevation of 484.50 m (S.D. ± 277.85). The Maximum elevation is recorded in the extreme North- eastern corner and Eastern part of the study site and the minimum elevation is recorded in the Western and Southwestern part of the study site (Figure 2). The absolute mountainous relief of the study area range between 8.61-589.6 m (mean ± standard deviation 141.59 m ± 112.17). The average elevation value is recorded in the central and Northern part of the study site.
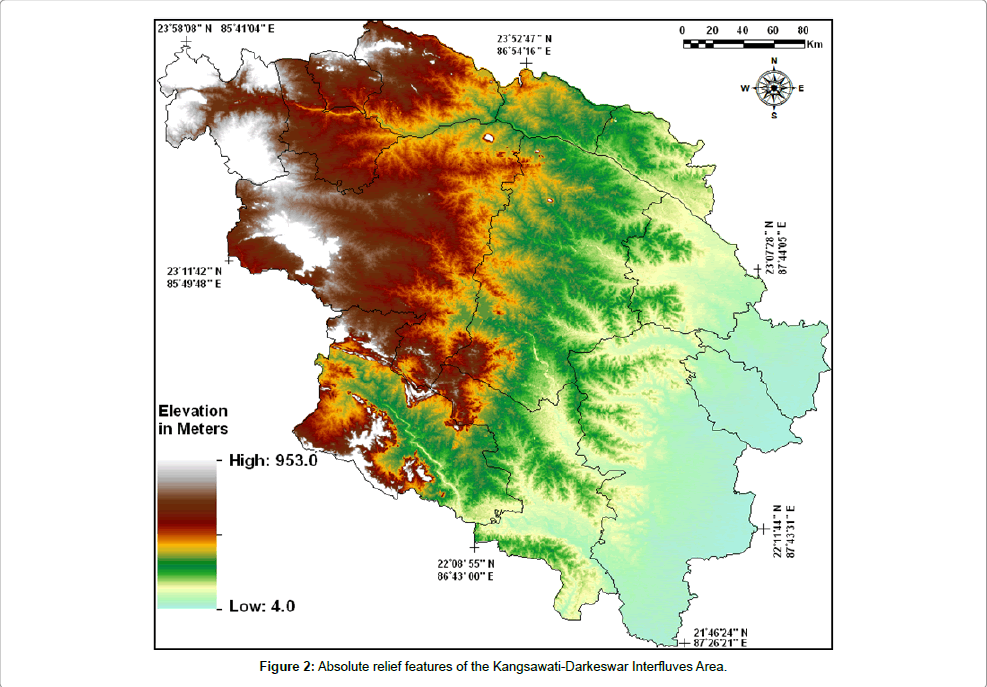
Figure 2: Absolute relief features of the Kangsawati-Darkeswar Interfluves Area.
Relative relief
Relative relief is an important morphometric variable used for the overall assessment of morphological characteristics of terrain. The highest relative relief is calculated as 833.69 m, while the lowest value is recorded as 20 m (Figure 3). The low relative relied demonstrated that the region is almost flat and appear like mature stage of geomorphic evolution. Therefore, the region could be used for agricultural purpose for its flat nature depending on water accessibility.
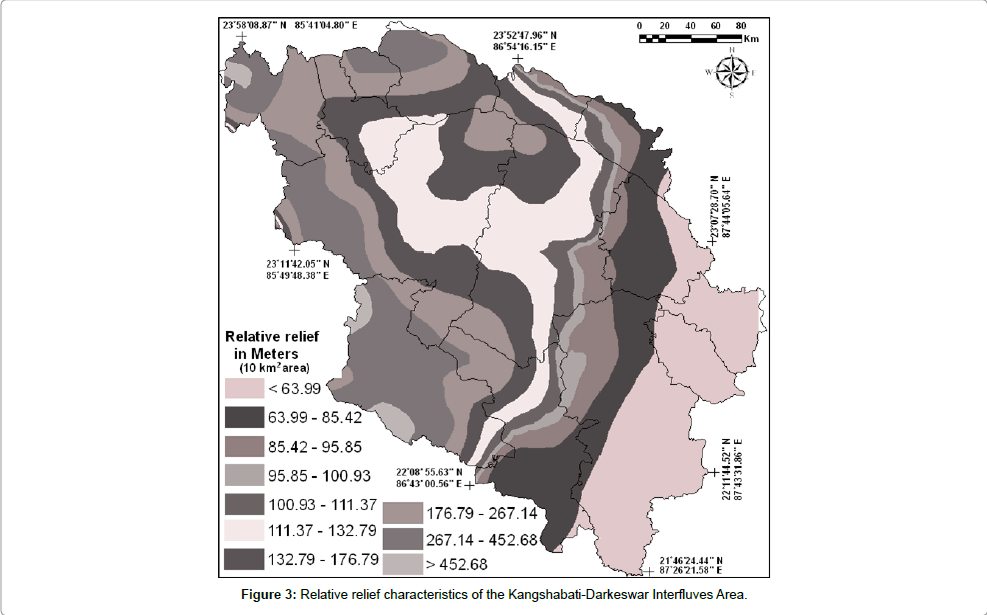
Figure 3: Relative relief characteristics of the Kangshabati-Darkeswar Interfluves Area.
Dissection index
The highest computed dissection index value was 0.99, while the lowest value is 0.20 (Figure 4). Moreover, the higher dissection index in the study area highlight that both a low river erosion and a transition of the area toward a mature stage of development.
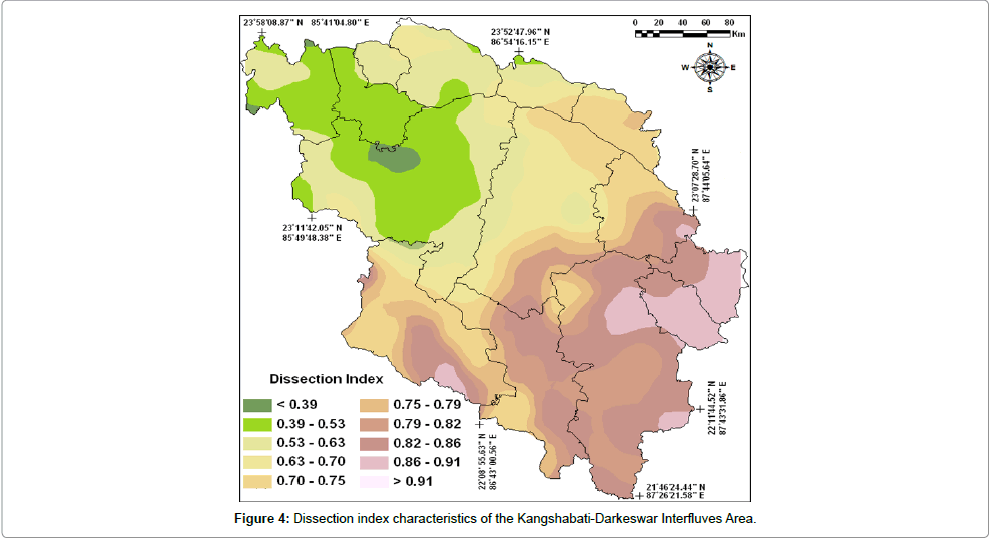
Figure 4: Dissection index characteristics of the Kangshabati-Darkeswar Interfluves Area.
Slope
The slope of a terrain refers to the amount of inclination of physical feature, topographic landform to the horizontal surface. Slope analysis is an important parameter in morphometric studies. The slope elements, in turn are controlled by climato-morphogenic processes in areas having rock of varying resistance. The degree of slope exhibited by Kangshabati-Darkeswar interfluves area varies from 0º to 65º. The average slope is 26.53 º (Table 1). The slope map of the Kangshabati- Darkeswar interfluves area (Figure 5). The higher slope gradient in the study area belongs to Chotanagpur hilly Eastern part. Higher slope gradient will result in rapid runoff with potential soil loss.
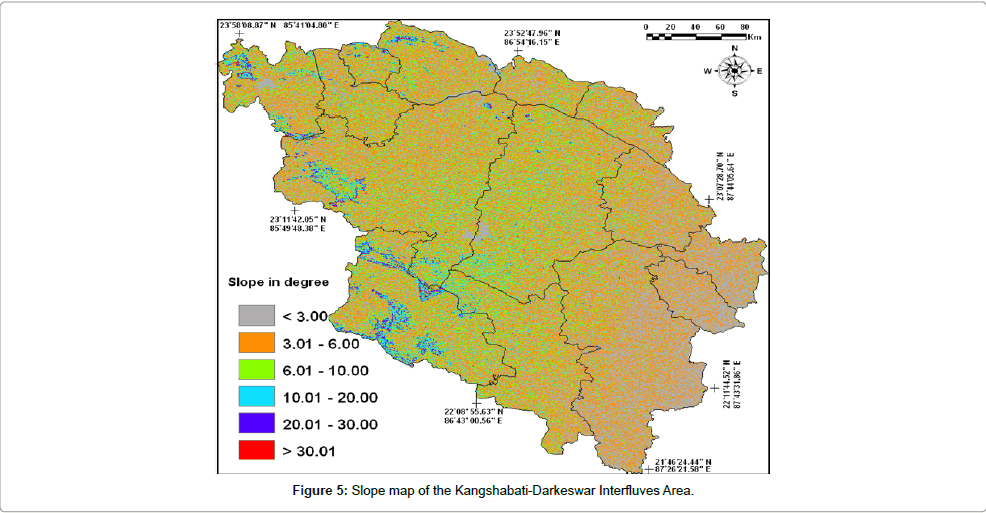
Figure 5: Slope map of the Kangshabati-Darkeswar Interfluves Area.
Stream order
The Kangshabati-Darkeswar stream interfluves area have been demarcated according to the Strahler’s system of stream ordering has been designated as a fifth-order basin (Table 2, Figure 6) the present investigation, maximum frequency is observed in the firstorder streams. The first-order streams are those that do not have any tributary and these channels normally flow during the wet weather [24]. More number of first-order streams can be observed in the hilly region of the study area, which points towards terrain complexity and compact nature of the bedrock lithology. Moreover, the presence of large number of streams in the basin indicates that the topography is still undergoing erosion and at the same time, less number of streams indicates mature topography. The calculated result matched with [16,17], which described that the total number of streams gradually decreases as the stream order increases.
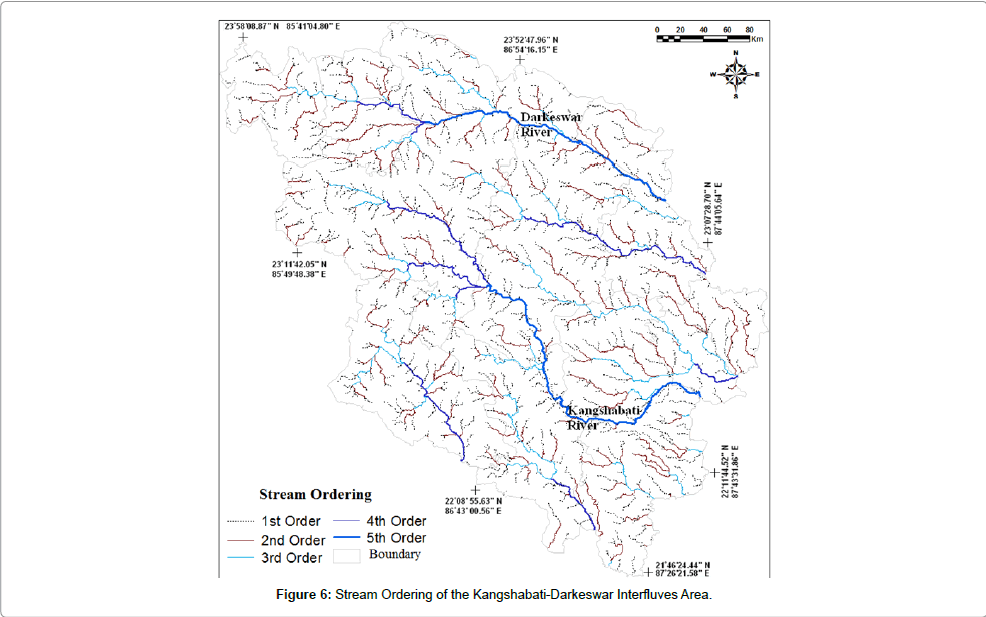
Figure 6: Stream Ordering of the Kangshabati-Darkeswar Interfluves Area.
Drainage frequency
Maximum drainage frequency of the study area is recorded as 2.78/10 km2 grid area. Very small pockets of high drainage frequency areas were found in the southern side of the study area (Figure 7). A higher stream frequency points to a larger surface runoff and steeper ground surface. According to [20], stream frequency (Fs) is defined as the ratio of the total number of stream segments of all the orders in the basin to the total area of the basin. ‘Fs’ is an index of the various stages of landscape evolution. The occurrence of stream segments depends on the nature and structure of rocks, vegetation cover, nature and amount of rainfall and soil permeability. The stream frequency for the Kangshabati-Darkeswar interfluves area is 0.62 (Table 1). The stream frequency is dependant more or less on the rainfall and the physiography of the region.
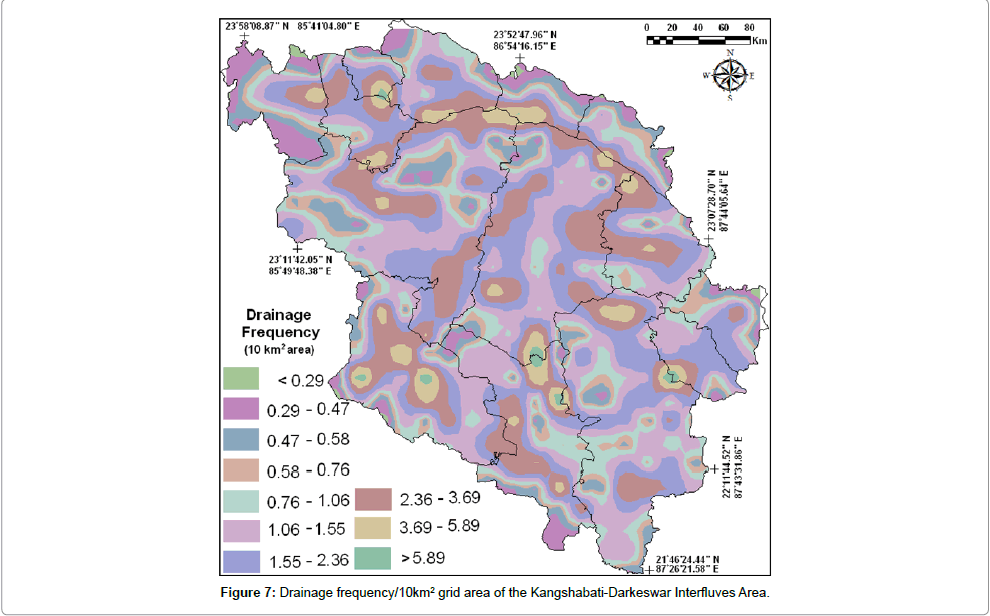
Figure 7: Drainage frequency/10km2 grid area of the Kangshabati-Darkeswar Interfluves Area.
| Parameters | Minimum | Maximum | Mean | Standard deviation | Skewness | Kurtosis | Quartile1 | Median | Quartile3 |
| Elevation (m) | 4.0 | 949.29 | 476.65 | 274.49 | 1.09 | -1.2 | 240.32 | 476.64 | 712.97 |
| Slope (°) | 0.35 | 65.42 | 26.53 | 1.10 | 0.17 | -0.93 | 13.24 | 26.13 | 39.01 |
| Absolute relief (m) | 8.61 | 589.4 | 141.59 | 112.17 | 1.02 | 3.66 | 53.61 | 110.81 | 209.79 |
| Relative relief (m) | 20 | 833.69 | 153.54 | 133.32 | 1.99 | 7.42 | 76.25 | 108.0 | 177.89 |
| Dissection Index | 0.2 | 0.99 | 0.69 | 0.17 | -0.61 | 2.47 | 0.57 | 0.72 | 0.84 |
| Ruggedness index | 0 | 1.14 | 0.09 | 0.13 | 3.85 | 25.56 | 0.02 | 0.06 | 0.13 |
| Drainage frequency (km2) | 0 | 2.78 | 0.62 | 0.36 | 0.89 | 3.70 | 0.4 | 0.6 | 0.8 |
| Drainage density (km2) | 0 | 4.55 | 0.73 | 0.58 | 2.15 | 10.96 | 0.34 | 0.59 | 0.95 |
| Infiltration number | 0 | 3.64 | 0.43 | 0.44 | 2.77 | 15.02 | 0.16 | 0.31 | 0.59 |
| Length of overland flow (km2) | 0 | 9.61 | 2.61 | 1.75 | 1.41 | 5.38 | 1.44 | 2.27 | 3.43 |
| Drainage texture ratio | 0 | 0.48 | 0.16 | 0.90 | 0.89 | 3.72 | 0.1 | 0.15 | 0.2 |
Table 1: Descriptive characteristics of morphometric parameters in the Kangsawati-Darkeswar Interfluve area in West Bengal, India.
Stream length ratio (RI)
It is the ratio between the lengths of streams in a given order to the total length of streams in the next order [18]. The Rl values for the Kangshabati-Darkeswar interfluves area vary widely from 0.5 to 0.9 (Table 2) and are strongly dependant on the topography and the slope. It shows an important relationship with the surface flow discharge and the erosional stage of the basin or interfluves area.
| Stream order | No. of stream | Length (km) | Bifurcation ratio (Rb) | Stream length ratio (RL) |
| 1st order | 1803 | 3176.437 | - | - |
| 2nd order | 848 | 1660.996 | 2.126179 | 0.522912 |
| 3rd order | 445 | 811.255 | 1.905618 | 0.488415 |
| 4th order | 303 | 509.122 | 1.468647 | 0.627573 |
| 5th order | 259 | 459.655 | 1.169884 | 0.902839 |
Table 2: Results of morphometric analysis of Kangshabati-Darkeswar interfluves area.
Bifurcation ratio (Rb)
Rb is related to the branching pattern of a drainage network and is defined as the ratio of the number of streams of any given order to the number of streams in the next higher order in a drainage basin [14]. It is a dimensionless property and shows the degree of integration prevailing between streams of various orders in a drainage basin. Rb shows a small range of variation for different regions or for different environments except those where the powerful geological control dominates. The Rb for the Kangshabati-Darkeswar interfluves area varies from 1.1 to 2.1 (Table 2) with a mean Rb of 1.67. Low Rb value indicates poor structural disturbance and the drainage patterns have not been distorted [16,17], whereas the high Rb value indicates high structural complexity and low permeability of the terrain. A low mean Rb value (0.64) indicates less structural disturbances in Kangshabati- Darkeswar interfluves area.
Drainage density
Drainage density (Dd) is one of the important indicators of the landform element and provides a numerical measurement of landscape dissection and runoff potential [25]. Dd is related to various features of landscape dissection such as valley density, channel head source area, relief [26], climate and vegetation [27], soil and rock properties [28,29] and landscape evolution processes. A low drainage density indicates permeable sub-surface strata and has a characteristic feature of coarse drainage, which generally shows values less than 5.0. [16,17] noted that low drainage density is favored where basin relief is low and vice versa. In this study highest drainage density is recorded as 4.55/sq. km and the average drainage density is 0.73/sq. km with a standard deviation of ± 0.58 which indicates that the study area has a weak or permeable subsurface material with intermediate drainage and low relief. Highest DD is recorded in the extreme northeastern and southern part of the study area. Some small pockets of highest drainage density are recorded in the central part also. Low drainage densities are often associated with widely spaced streams due to the presence of less resistant materials. Moreover, the lowest DD is recorded in the eastern and northern part of the study site (Figure 8). The result of our analysis showed that the area may have significantly moderate to good amount of surface water resource. However, it may be due to the origin of some first order streams from the highlands and it does not add significantly to the accessibility of water in the region.
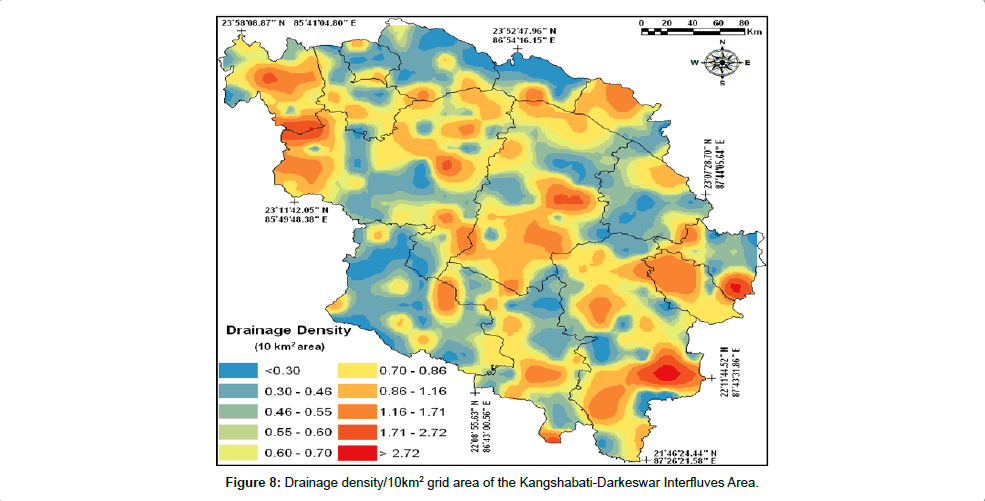
Figure 8: Drainage density/10km2 grid area of the Kangshabati-Darkeswar Interfluves Area.
Ruggedness index
The average ruggedness index of the study area is recorded as 0.09 per 10 km2 area. Maximum portion of the study area is estimated as lower ruggedness index, comprised with the central and southern part (Figure 9). The results of the study indicated that the minimum effort is needed to manage the surface water and irrigational facilities which can make the good agricultural region.
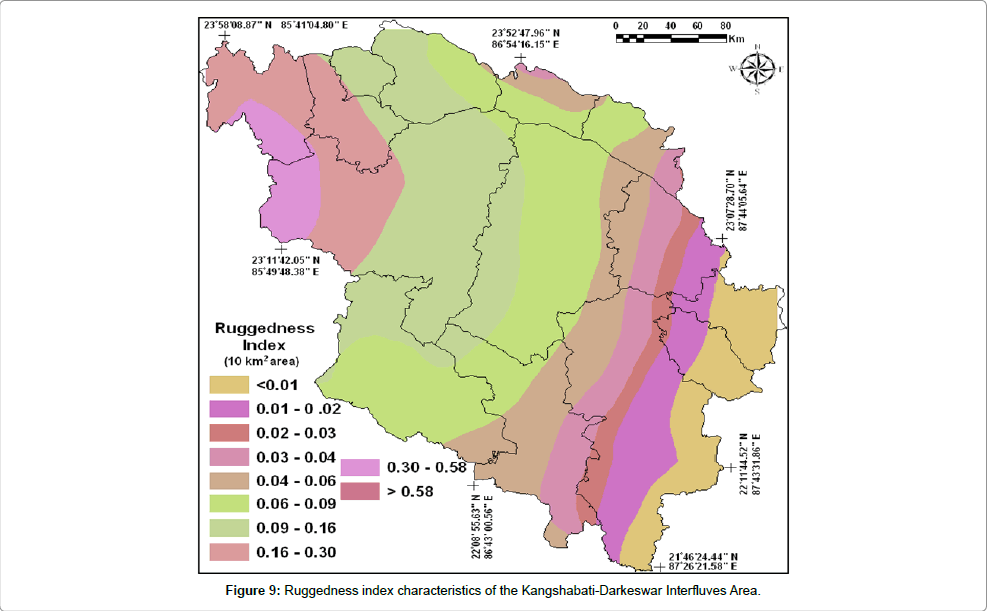
Figure 9: Ruggedness index characteristics of the Kangshabati-Darkeswar Interfluves Area.
Drainage texture
According to [28], drainage texture (T) is a product of stream frequency and drainage density (Table 1). The ‘T’ index depends on underlying lithology, infiltration capacity and relief aspect of the terrain. The drainage texture value of the Kangshabati-Darkeswar interfluves area basin is 0.48, and indicates coarser drainage texture and due to the presence of high relief in the western part of the study area (Table 2). Most of the investigated area showed coarser drainage texture per 10 km2 grid area (Figure 10).
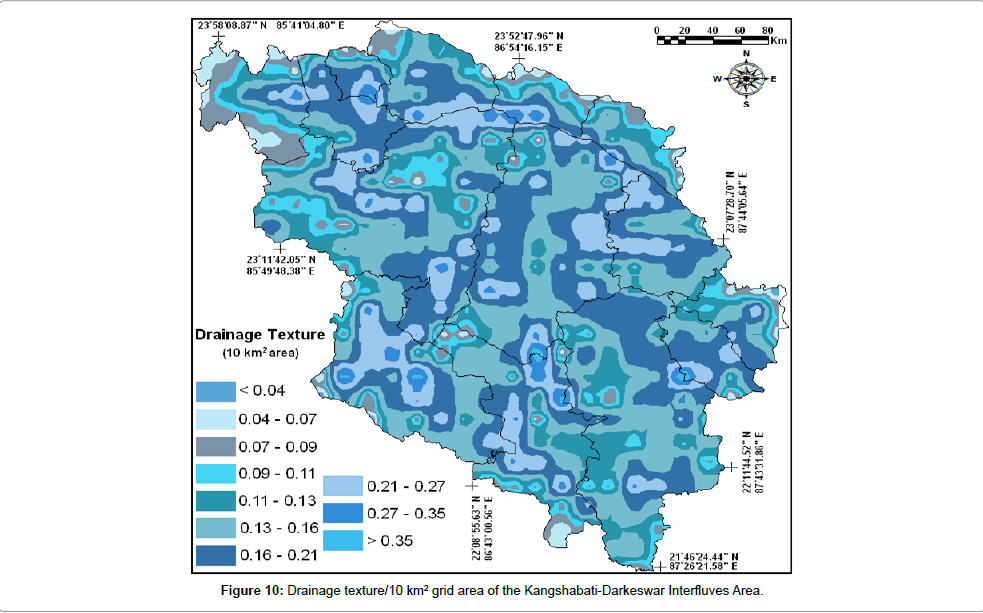
Figure 10: Drainage texture/10 km2 grid area of the Kangshabati-Darkeswar Interfluves Area.
Length of overland flow
This depends on the rock type, permeability, climatic regime, vegetation cover and relief as well as duration of erosion [14]. The high overland flow value indicates that the rainwater had to travel relatively longer distance before getting concentrated into stream channels [30,31]. The average length of overland flow of the study area is shown as 2.56/10 km2, it may be due to under the influence of high structural disturbance, low permeability, steep to very steep slopes and high surface runoff. The maximum value of overland flow is recorded in northern and some small pockets of eastern corner of the study site (Figure 11). However, the low value of overland flow concentration is recorded from the southwestern parts of the study site.
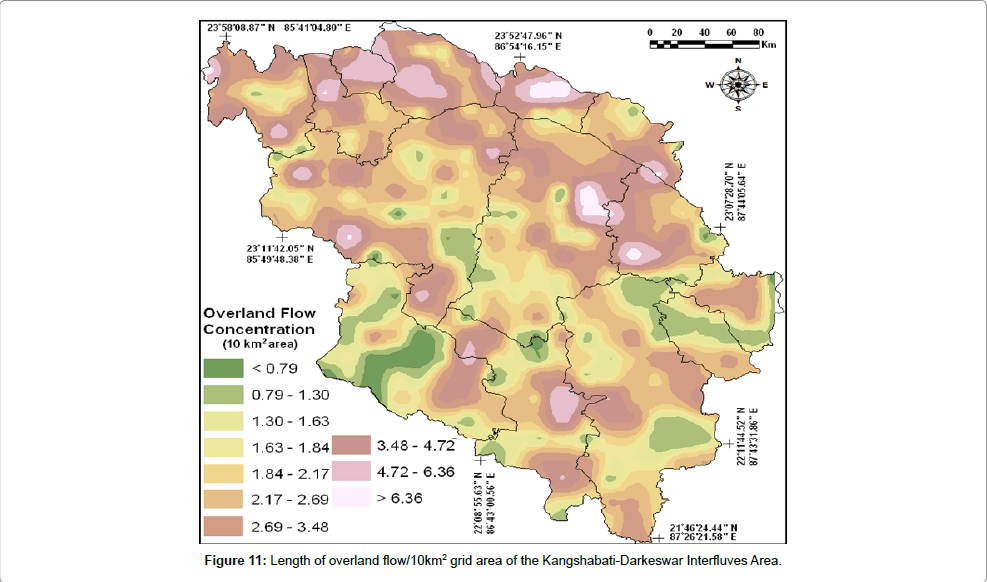
Figure 11: Length of overland flow/10km2 grid area of the Kangshabati-Darkeswar Interfluves Area.
Infiltration number
The higher value indicates low infiltration and high runoff. The infiltration number of the study area is the highest infiltration number 3.64/10 km2 grid area in the study site (Figure 12). The average infiltration number of the study site is estimated at 0.43 with a standard deviation of ± 0.44.
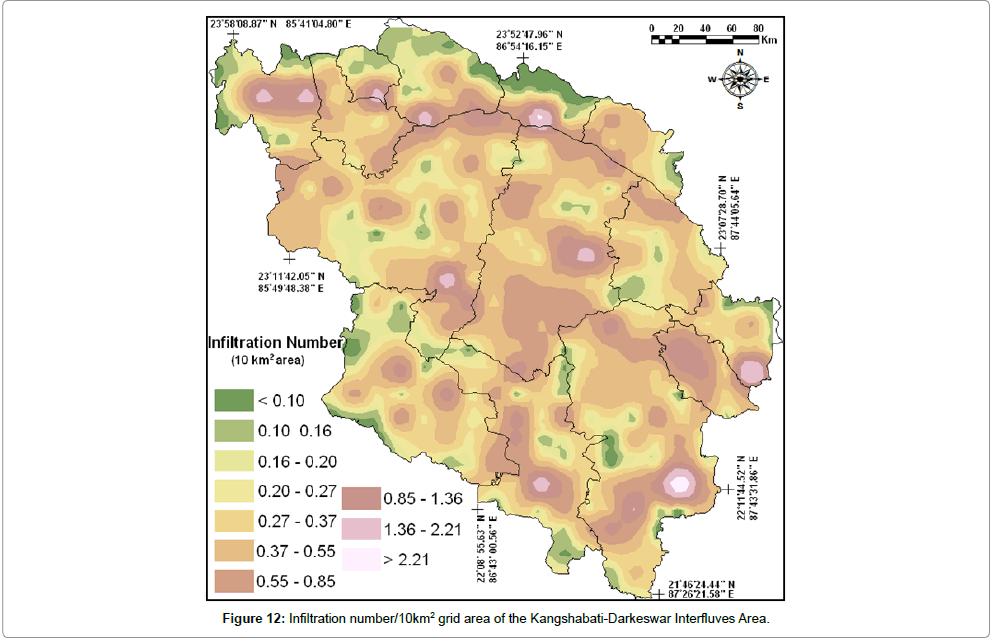
Figure 12: Infiltration number/10km2 grid area of the Kangshabati-Darkeswar Interfluves Area.
Remote sensing and GIS application employed in the demarcation and modernize of the relief and drainage characteristics in the present study. The variation in drainage characteristics might be due to changes in slope and topography. It is contingent from the study that the streams have created a mature stage which is a sign of good geomorphic development. Furthermore, by the complete analysis of drainage basin characteristics of Kangsabati-Darkeswar interfluves area can be considered as an area with moderate to poor groundwater prospect as the area has less permeable subsurface and the conditions somewhat favorable for infiltration of surface water. However, it is also required to observe the other factors like, land use, climate, soil type, etc. which are identified to influence hydrologic processes to disentangle the multivariate nature of the predicament with the view to finding a holistic elucidation.
We are very much thankful to the Ministry of Economy, Trade and Industry of Japan (METI) and the National Aeronautics and Space Administration (NASA) for freely providing the ASTER GDEM data. We also thanks to the Department of Geography, Vidyasagar University (Midnapur) for their laboratory facilities to carry out the research work.