Forest Research: Open Access
Open Access
ISSN: 2168-9776
ISSN: 2168-9776
Research Article - (2023)Volume 12, Issue 2
Arrogant practices of land use including expansion of agricultural land and infrastructural development are resulting in deforestation that goes to climate change. Cellular Automata (CA)-Markov chain combines the advantages of cellular and Markov chain analysis to simulate and predict future land use/cover trends depending on the Land Use Land Cover (LULC) changes in the past. First, spatial distribution of LULC and area changed were calculated using IDRISI software and GIS technology, and then the forest land cover conversion to other LULC was evaluated to obtain rate of deforestation during a period of 1980-2018. Second, using transition potential matrices of 1999-2018, CA-Markov chain was executed to simulate spatial distribution of land use/cover in 2018. Based on the simulated LULC map for 2018 and the actual LULC map of 2018 CA-Markov model was validated with a kappa index of 1. Finally, future land use/cover transformed during the periods of 2018-2037 and 2037-2056 were predicted using CA-Markov chain model. The results revealed that decreasing of forest land and increasing of agricultural land in the study period. Forest land was decreased by 52,156.71 hectares from 1980 to 2018, while agricultural land increased by 78,021.35 hectares during 1980-2018. Rate of deforestation between 1980 and 2018 was 1,372.54 hectares per year. Therefore, the predicted results of 2037 year suggests that forest cover would decreases by 30,204.65 hectares within 19 years and also agricultural land would be increases by 30,693.91 hectares between 2018 and 2037. It approved helping concerned bodies that work on the forest better understand and address a tough land use system, and develop.
GIS; Remote sensing; Cellular automata; Markov chain; Transition matrix; Transition probability matrix; Transition suitability map; BGRFPA
At present time, the most widely used models in land use change monitoring and prediction are analytical equation-based models, statistical models, evolutionary models, cellular models, Markov models, hybrid models, expert system models and multi agent models. Land cover change modeling means time interpolation or extrapolation when the modeling exceeds the known period.
Cellular automata are discrete models in which the states of the variables, i.e. values associated with grid cell locations, are driven by simple rules dependent on the states of the neighbors of each variable. Cellular Automata (CA) models (deterministic, stochastic or hybrid) have recently garnered tremendous popularity as spatial simulation techniques in a wide range of rural and urban modeling domains and, as such, the vital of research in this direction are rapidly expanding. Over the past few decades, Cellular Automata (CA) models have found application in spatial simulation involving a plethora of themes, including population or land use/cover dynamics, land use evaluation, urban sprawl and a host of others. Compared to conventional mathematical tools of spatial simulation such as differential equations, partial differential equations and empirical equations, CA models are relatively simple yet produce results that are stunning meaningful and useful to support decision making in a planning context. Operating in synergy with other planning models and such other cutting-edge technologies are GIS and digital image processing. CA can help to portray the dynamics and patterns of growth in a given spatial context [1].
The behavior of a CA thought of as a Markov process. The Markov process means that future probabilities of an event may be determined from the probabilities of events at the current time. The assumptions of physics in which the probability of a system being a certain state at a certain time can be determined if the earlier time state known. Markov chain method works based on developing transition probability matrix of land use change between two different dates derived from observation, which used to provide estimations of the probability that each pixel of certain LULC classes transformed to another class or remain in the same class. Therefore, this model is very good and useful to understand the stochastic nature and the stability of the land use/cover. The integrated use of CA-Markov model effectively combines the advantages of the long-term predictions of the Markov model and the ability of the Cellular Automata (CA) model to simulate the spatial variation in a complex system and this mixed model can effectively simulate land cover change. Therefore, this method adopted to obtain accruable and reliable results for Belete Gera Forest Priority Forest Area (BGFPA). In this study, the 2037 and 2056 LULCs were, predicted based on the history of 1999 and 2018 LULCs.
Ethiopia is facing rapid forest cover change and degradation that has been, principally fueled by increase of population. This in turn resulted in extensive forest clearing for agricultural use, resettlements, and exploitation of existing forests for fuel wood, timber and construction materials. Many studies have focused on the LULC dynamics at the rural and urban areas in Ethiopia. While, there are few studies on future LULC prediction in the country especially at the scale of large rural areas such as BGFPA. BGFPA is located in the southwestern Ethiopia it is one of the dominant natural high forests [2].
This study seeks to utilize remotely sensed data and GIS tools to analyze the LULCC in BGFPA, in Ethiopia country. Detecting changes in the area is, obtained by comparing images between two years. Based on the Markov model, the transfer probability was, established based on the data from 1980 and 1999, and the predicted data of 2018 was, processed using the transfer probability and forest suitability maps in the CA model. After validation, the land use and land cover in 2037 and 2056 were, predicted [3].
Description of the study area
Belete-Gera forest is one of the Regional Forest Priority Areas (RFPA) in the country. The total forest area is about 1,500 square kilometers, an area more than twice as large as Singapore. There are 30 villages and 80 sub-villages in Gera district and 14 villages and 46 sub-villages in Shabe Sombo district (Figure 1). The Belete-Gera forest is unique in that it produces wild forest coffee as well as regular garden coffee. In fact, Belete-Gera forest is one of the major candidates for being the ultimate origin of coffee (Figures 2 and 3) [4].

Figure 1: Locational map of study area.
Data collection
For this study, Landsat Thematic Mapper (TM), and Landsat-8 Operational Land Imager (OLI), for the years 1980, Landsat TM, Landsat TM for 1999 and OLI for 2018, obtained from free USGS Earth Explorer, and SRTM elevation data from GLCF could be used for this study (Table 1).
| Year | Data type | Path/Row | Date of acquisition | Resolution | Source |
|---|---|---|---|---|---|
| Satellite image | |||||
| 1980 | Landsat Tm | 170/055 | 05/03/1980 | 60 m | USGS earth explorer |
| 1999 | Landsat ETM+ | 170/055 | 08/02/1999 | 30 m | |
| 2018 | Landsat OLI | 170/055 | 27/01/2018 | 15 m | USGS earth explorer |
| 2018 | SRTM | 170/055 | 2018 | 30 m | USGS earth explorer |
Table 1: Data collection specifications.

Figure 2: Workflow chart of research methodology.
Data preprocessing and image classification
After all the pre-processing activities were, done one of the important activities of the study is image classification, which is the basis for change detection activity and prediction. As the main objective of the study is Predicting LULC focusing forest cover change in the future, land-use/cover category was, selected for the purpose. Based on the prior knowledge of the study area and additional information from different materials in the study area, five different types of land uses and land cover classes were identified (Tables 2 and 3) [5].
Landsat 8 image, Landsat 5 ETM+ and Landsat 5 TM images for 2018, 1999 and 1980 were in original 30 m resolution. Further image processing analysis was, carried out using IDRISI. The image was displayed in natural color composite using a band combination of 3, 2, 1 for Landsat 5 TM and 3, 2, 1 for Landsat 5 ETM+ and for Landsat 8 OLI 4, 3, 2. Maximum Likelihood supervised classification was performed using several selected regions, and Regions of Interest (ROI) were based on delineated classes of agricultural land, forestland, built-up area, grassland, and water body [6].
| No | LULC classes | Description of LULC classes |
|---|---|---|
| 1 | Agricultural Land | The land area that used primarily for production of crop and comprises Agroforestry land (mixture of chat and coffee plantation). |
| 2 | Forest Land | It includes all dense natural forest. |
| 3 | Built-up area | Includes residential areas like town, villages, strip transportation, and commercial areas. |
| 4 | Grassland | This land cover includes areas of shrubs, short tress, bushes, pasturelands, grazing areas dominantly covered with grasses. |
| 5 | Water body | Includes all water bodies (river, lakes, gravels, stream, canals, and reservoirs). |
Table 2: LULC classes of the study area delineated based on supervised classification.
Accuracy assessment
Accuracy assessment for the 1980, 1999, and 2018 images were carried out to determine the quality of information provided from the data. Kappa is used to measure the agreement or accuracy between the remote sensing derived classification map and the reference data as indicated by the major diagonals and the chance agreement, which is indicated by the row and column, totals [7].
The Kappa coefficient represents the proportion of agreement obtained after removing the proportion of agreement that could be expected to occur by chance. The Kappa test is a measure between predefined producer rating and user assigned rating, which can be expressed in the formula as:
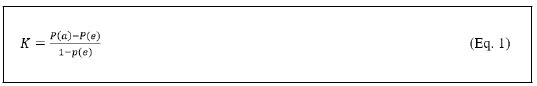
Where P (a) is the number of time the k raters agree, and P (e) is the number of time the k raters are expected to agree only by chance.
Land use/cover change detection analysis
In performing LULC change detection, the post-classification detection method was applied in the IDRISI Selva environment v.17, which involves two classified images to make a comparison to produce change information on a pixel basis. In other words, the interpretation between two image will provide changes “-from, -to” information. Classified images from two different data sets are compared using cross-tabulation in determining qualitative and quantitative aspects of changes for periods from 1980 to 2018. The magnitude of change and percentage of changes can be expressed in a simple formula as follows:
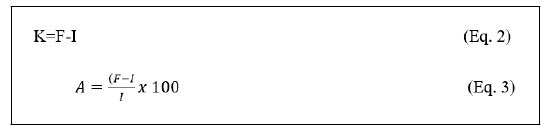
Where (K) is magnitude of changes, (A) is percentage of changes, (F) is first data, and (I), is reference data. Additional, prediction or estimation of LULC changes for 2018, 2037 and 2056 was also employed using IDRISI Selva environment v.17.
Deforestation analysis
To generate deforestation map and forest area transition matrix of 1980-1999, 1999-2018, and 1980-2018; first, the raster images of LULC was converted into feature type and selected the attribute using features names and merged into single features for all class. Then, using intersection tool the files of 1980 and 1999, 1999 and 2018, and 1980 and 2018 were, intersected and area change added into attribute table, which was the attribute of area changed. They are feature, which were one class in the former period but changes to another class in the later period. Finally, the deforestation map and forest area to other LULC change matrix were, created using merged four LULC classes matrix; agriculture, built-up, grassland and water body to other LULC categories. However, amongst the five major classes’ forest class change transition matrix was, identified as deforestation practices [8].
This kind of change detection method identifies where and how much change has occurred to each land cover. In the meantime, three conditions of forest cover change detection characteristics such as, detecting the rate of forest changes that have occurred, measuring the areal extent of the change, and mapping deforestation pattern of the change are explored. Besides, change detection matrix has been, produced to explore the trends and patterns of land use/land cover change in general and forest cover change in particular. For the current study, the rate of forest cover change was, also calculated using the formula;
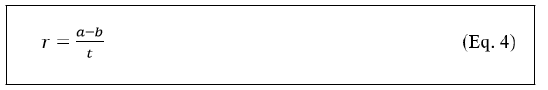
Where,
r=Rate of forest cover change in hectare,
a=Recent year forest covers in ha
b=Initial year forest covers in ha,
t=Number of years between a and b.
Simulation and prediction of land use/Cover changes
Markov-chain model analysis: The Markov chain model is a unique and widely used tool in Land Use Land Cover modeling which demonstrates the LULCCs as a stochastic process. In the Markovian system, the future state of a land use system is a modeled based on the immediate proceeding state. The change of system from one state to other state is Transition and the probability associated with this state transition is termed as transition probability. The state space and the associated transition probabilities characterize the Markov chain.
The initial estimates of pij can be computed as,
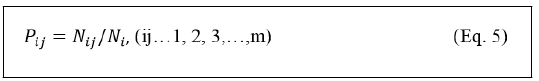
Where, Nij is the number of units transitioned from the state i to state j, Ni is the number of units in state i.
Therefore, the basic hypothesis of model simulation process mainly produces a land use area transfer matrix and a probability transfer matrix to predict land use change trends. The Markov chain model described as a set of states, S={S1, S2, S3,…..Sn} assuming that the current state is and then, it changes to state Sj at the next step with a probability denoted by transition probabilities pij. Thus, the state St+1 in the system determined by former stage St in the Markov chain using the following formula:
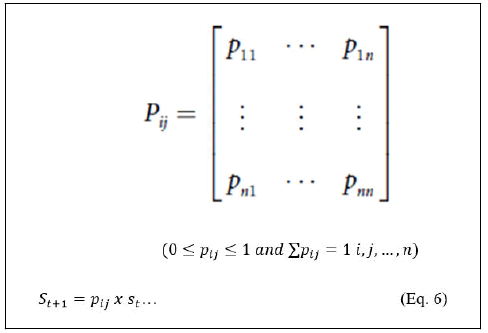
Where, p (ij,) is the state transition probability matrix and n is the land represents the number of land use type; S is land use status, t; t+1 is the time point. In this Study, the Markov chain analysis was implemented in three periods; 1980-1999, 1999-2018 and 2018-2037. Thus, the land use area transfer matrix and transition probability matrix for the introduced periods obtained.
Cellular Automata (CA)
A CA Model is a dynamic model with local interactions that reflect the evolution of a system, where space and time are considered as discrete units, and space is often represented as a regular lattice of two dimensions. Temporal and spatial complexities of land use land cover systems can be well modeled by properly defining transition rules in CA models. CA simulation provides important information for understanding forest cover theories, such as evolutions of forms and structures.
Cellular automata is a bottom-up dynamic model within a spatio-temporal calculation. It is discrete in space-time and state can carry out complex time-space simulations. The data for every cell in state St+1 are decided by the cell itself and its neighboring cells in state St, meaning that the change in the cell is decided by rules. It is consists mainly of cell, cell space, neighbor, rule and time. The filter of the CA model determines the neighbors. The closer the distance between the nuclear cell and neighbor, the larger the weight factor will be. The weight factor is combined with the probabilities of transition to predict the state of adjacent grid cells, so that land use change is not a completely random decision.
In this study, cellular automata lattice represented each land use cell, and each lattice have 8 neighboring cells; cellular state represented land use type of cell; time step is 19 years.
Transition rule was used a 3 × 3 kernel or neighborhood and followed land use transition rules. Land use transition also to be able to follows, maximum transition probability rule and hysteresis rule; if a cell is allocate with a land use type, and the cell will be not changed to other land use types within the simulation period.
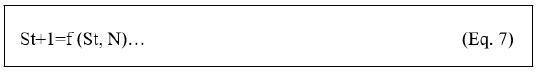
Where, S is the set of states of the finite cells. The t and t+1 are different moments; N is the neighborhood of cells; and f is the transformation rule of local space.
Markov chain and CA combination process
The CA-Markov model is considered a robust approach because of the quantitative estimation and the spatial and temporal dynamic it has for modeling the LULC dynamic.
The 1999 LULC image of Belete Gera forest priority area used as the base image while 2018 LULC map as the later image in Markov model to obtain the transition area matrix between 1999 and 2018 years for prediction of LULC in 2037. The image of 2018 used as base image to obtain the transition area matrix between the years 2018 and 2037 for prediction of LULC of the 2056. In addition to validate, model the image of 1999 as base image and the transition area matrix between 1980 and 1999 for simulation of 2018.
The real 2018 LULC map was used as the base map for estimating future LULC scenario for 2037, and the predicted 2037 LULC map was used as a base image for forecasting LULC scenario of 2056. In addition, 1999 LULC map used as base map for simulation of 2018 year. Therefore, a transition area produced by Markov based on one-year increasing steps. Therefore, for projection of future LULC 2037 year the iterations entered was 19, so that CA-Markov model was produced the predicted map based on 1-year increments. While for the second projection 3037 year was set as starting year and transition probability matrix of 2018-2037 periods was used to forecast 2056 year land use change, the number of iterations entered when CA-Markov model was running is not equal to the future prediction date specified in Markov model which was produced transition areas image and transition probability matrix. To run CA-Markov model for 2037 prediction the iterations entered was 19 based on one-year increments and for 2056 prediction the iterations entered was 10 based on two years increments.
Model validation
After any model generates a simulated map, it is desirable to validate the accuracy of the prediction. Therefore, model validation is one of the important stages in the prediction regime of land uses. The VALIDATE module involves a comparative analysis of the simulated and real maps based on the Kappa Index. However, it is different from traditional Kappa statistics in that it breaks the validation into several components, each with special form of Kappa such as K no, K location, K standard, etc. and the associated statistics.
The model output was compared to a present or actual land use map. Comparing the predicted LULC map representing the 2018 LULC with actual LULC (map of 2018) was based on Kappa Index of Agreement (KIA) approach, which is widely used in validate LULC change predictions Before CA-Markov model can be applied for estimation of the next 38 years. I must be used the validation module is available in IDRISI software for this purpose.
Land use land cover change detection analysis
Change detection, as defined by Hoffer RM, is the temporal effects as variation in spectral response involves situations where the spectral characteristics of the vegetation or other cover type in a given location change over time. To address this issue, technology has developed and the possibilities are virtually unlimited in different areas of applications, which can be addressed through earth observation satellite data and decisions support tools such as Geographic Information System (GIS).
LULC change analysis reveals that, agricultural land increased by 78,021.35 hectares in four decades in contrast forest land decreased 52,156.71 hectares from 1980 up to 2018. Therefore, in the area deforestation was started in 1970’s when the Oromo people migrated from Central Ethiopia to South western Ethiopia because of urbanization and political reason. As well as, the coverage of grassland and water bodies declined in the study periods nearly four decades by 18129.07 and 8143.75 hectares respectively. Moreover, settlement areas were increased by 408.16 hectares, this class of land use was not clearly visible during the initial year of the study period (Table 3).
| LULC type | years | |||||
|---|---|---|---|---|---|---|
| 1980 | 1999 | 2018 | ||||
| Area (ha) | % | Area (ha) | % | Area (ha) | % | |
| Agriculture | 39,180.30 | 18.24 | 66,364.09 | 30.9 | 117,201.65 | 54.57 |
| Forest | 146,684.23 | 68.3 | 139,037.30 | 64.74 | 94,527.52 | 44.01 |
| Built-up | 0 | 0 | 106.24 | 0.05 | 408.16 | 0.19 |
| Grassland | 19,085.37 | 8.89 | 4,037.32 | 1.88 | 956.3 | 0.45 |
| Water body | 9,828.97 | 4.58 | 5,233.90 | 2.44 | 1,685.22 | 0.78 |
| Total | 214,778.86 | 100 | 214,778.84 | 100 | 214,778.84 | 100 |
Table 3: Total amount of land use/cover in hectares for each category from 1980-2018.

Figure 3: Land use/cover maps of Belete Gera forest priority area of 1980, 1999 and 2018.
Transition probability matrix is from-to information, the first time interval of TPM were calculated from land use/cover maps of 1980 to 1999, the rows of the table signify the land use status and transferring out situation in the preliminary period of land use change, while the columns of the Table 4 represent the land use status and transferring in situation in the 1999 (Table 4).
| LULC type | Land classes of 1999 | ||||||
|---|---|---|---|---|---|---|---|
| Agriculture | Forest | Built-up | Grassland | Water body | Total | ||
| Land classes of 1980 | Agriculture | 26,223.58 | 8,430.68 | 75.34 | 2,372.50 | 2,078.20 | 39,180 |
| Forest | 27,301.16 | 118,678.1 | 10.9 | 33.17 | 660.9 | 1,46,684 | |
| Built-up | 0 | 0 | 0 | 0 | 0 | 0 | |
| Grassland | 10,835.22 | 5,964.09 | 18.34 | 1,430.69 | 837.03 | 19,085.40 | |
| Water body | 2,004.13 | 5,964.44 | 1.67 | 200.96 | 1,657.78 | 9,828.97 | |
| Total | 66,364.09 | 139,037.3 | 106.24 | 4,037.32 | 5,233.90 | ||
Table 4: Transition probability of area and matrix calculated using land-use maps of 1980-1999.
Transition probability matrix of 1980 and 1999 periods (Table 4) reveals the highest proportion of net increase in area is agricultural land; the net increase areas of agricultural land is 27,183.79 hectare. The main reason for the increase is the transfer of land from forest area and grassland, and the amounts of their transfer areas are 27,301.16 and 10,835.22 hectares respectively. The second highest proportion of net increase in area is built-up, which accounts for 106.24 hectare of the net increased areas. The net increase area of built-up area is mainly from agricultural land transfer-in and grassland transfer-in, and their transfer-in areas are 75.34 and 18.34 hectares respectively. In contrast forest, grassland and water body areas were decreased. Moreover, the forest area decreased 7,646.93 hectares mainly transfers into agricultural land, whose changed-out area were 27,301.16 hectares. In addition, grassland transfer-out area is 15,048.05 hectares; more areas were transferred into agricultural land and forest land, whose areas are 10,835.22 and 5,964.09 hectares respectively and water bodies reduced 4,595.07 hectare, transfers into forest and agricultural land, the changed areas were 5,964.44 and 2,004.13 hectares respectively.
Transition probability matrix of the second time interval generated from land-use maps of 1999 and 2018. The rows of the Table 5 represent the land use status and transferring out situation in the 1999 period of land use change, while the columns of the Table 5 represent the land use status and transferring in situation in the 2018 (Table 5).
| LULC Type | Land classes of 2018 | ||||||
|---|---|---|---|---|---|---|---|
| Agriculture | Forest | Built-up | Grassland | Water body | Total | ||
| Land classes of 1999 | Agriculture | 65,455.26 | 244.47 | 258.2 | 376.48 | 29.69 | 66,364.09 |
| Forest | 44,482.54 | 93,143.90 | 98.4 | 26.09 | 1,286.37 | 139,037.30 | |
| Built-up A | 77.9 | 0.06 | 27.9 | 0.2 | 0.18 | 106.24 | |
| Grassland | 3,629.02 | 10.32 | 7.54 | 383.11 | 7.32 | 4,037.32 | |
| Water body | 3,556.93 | 1,128.77 | 16.11 | 170.42 | 361.67 | 5,233.90 | |
| Total | 117,201.65 | 94,527.52 | 408.16 | 956.3 | 1,685.22 | 159,371.85 | |
Table 5: Transition probability of area and matrix calculated using land-use maps of 1999-2018.
The highest proportion of net increase in area was agricultural land the net increase area is 50,837.56 hectares. Agricultural land gain from forest land, grassland and water bodies the amount of the transfer areas were 44,482.54, 3,629.02 hectares and 3,556.93 hectares respectively. The other highest proportion of net increase in area is built-up, which was registered about 301.02 hectares of the net increased areas. The net increase area of built-up area was from agricultural land transfer-in and forest land transfer-in, and their transfer-in areas were 258.20 and 98.40 hectares respectively. Contrast forest land, water bodies and grassland areas were declined between 1999 and 2018 their decreasing areas were 44509.78 hectares, 3,548.68 hectares and 3,081.02 hectares respectively. Forest mainly transfers into agricultural land and water, whose transfer-out area is 44,482.54 hectares and 1,286.37 hectares respectively. Water bodies transfers into agricultural land and forest, whose areas were 3,556.93 and 1,128.77 hectares respectively as well as grassland transfers into agricultural land, the changed area was 3,629.02 hectares (Table 5).
Deforestation analysis
Maps of forest land cover change to other land cover were produced for the years 1980 to 1999, 1999 to 2018, and 1980 to 2018 (Figure 4). As it is indicated on the maps forest land areas changed to agricultural land area at all interval study years were identifies the maximum change of forest land cover than other land use/cover classes introduced in the classification. The change map of forest land during 1980-1999 was mapped using overlaying change map of 1980 and 1999. Forest change map of 1999-2018 was generated from change map of 1999 and 2018 as well as change map of 1980-2018 generated from change map of 1980 and 2018. The change map reveals northern, southern, north western and eastern part of the Belete Gera forest priority areas were changed to other land classes. In this case the forest cover change was due to expansion of agricultural land area which was relationship with population growth. The reduction of forest land covers in 1999 periods to 2018 periods increased by large amount of area which indicates rapid deforestation.

Figure 4: Deforestation map between 1980 and 1999, 1999 and 2018, and 1980 and 2018.
146,684.23 hectares of the area were covered with forest resource in the 1980 year. Meanwhile, the forest cover land of the area accounted for 139,037.30 and 94,527.52 hectares in the 1999 and 2018 year respectively. In the year 1980, 68.3% of the area was covered with forest resources out of the total area of the study and about 64.74 % was covered with forest resources in 1999 year (Tables 6 and 7). Therefore, forest resources of the area were turned down in to 44.01% in the 2018 year out of the total area of the BGRFPA. Deforestation is increased in the area after millennium as a result of the migration of people in to areas and turns to expansion of agricultural land and using forest for their usual income (Figures 5 and 6).
The rate of forest cover change from year 1980 to 1999 is 402.5 hectares per year (146,684.23 hectares-139,037.3 hectares/19 years) and from year 1999 to 2018, it was 2342.62 hectares annually (139,037.3 hectares-4,527.52 hectares/19 years). Besides, considering the annual rate of forest cover change between 1980 and 2018, the computed result is 1372.54 hectares per year (146,684.23 hectares -94,527.52 hectares/38 years).
| Area of forest in hectare | Rate of forest change | |||||||
|---|---|---|---|---|---|---|---|---|
| 1980-1999 | 1999-2018 | 1980-2018 | ||||||
| 1980 | 1999 | 2018 | Change(ha) | ha/year | Change(ha) | ha/year | Change (ha) | ha/year |
| 146684.2 | 139,037.3 | 94,527.50 | 7646.93 | 402.5 | 44509.78 | 2342.6 | 52156.7 | 1372.6 |
Table 6: Trends of forest change between study periods and rates of forest cover change hectares per year.
| Forest cover change | B/N 1980 and 1999 | B/N 1999 and 2018 | B/N 1980 and 2018 | |||
|---|---|---|---|---|---|---|
| Area (ha) | % | Area (ha) | % | Area (ha) | % | |
| Forest to agriculture | 27,301.16 | 97.48 | 44,482.54 | 96.93 | 58,841.77 | 98.27 |
| Forest to built-up | 10.9 | 0.04 | 98.4 | 0.21 | 166.91 | 0.28 |
| Forest to grassland | 33.17 | 0.12 | 26.09 | 0.06 | 0.57 | 0 |
| Forest to water body | 660.9 | 2.36 | 1,286.37 | 2.8 | 871.39 | 1.46 |
| Total change | 28,006.13 | 100 | 45,893.40 | 100 | 59,880.64 | 100 |
Table 7: Change Detected from Forest Land to other Land use/cover.
The pattern of forest cover change into other land use/land cover units between 1980 and 1999, 1999 and 2018 and 1980 and 2018 periods were presented in Table 7. Therefore, 28,006. Hectares of forest cover land were changed into other land cover and land use units between 1980 and 1999. Specifically, 97.48% of the forest land was changed into agricultural land followed by forest cover transformed in to water bodies are 2.36%. The remaining 0.04% and 0.12% of the forest cover land were converted into built-up and grassland respectively. From the 1999 and 2018, 45893.40 hectares of forest cover land were changed in to other land cover units. The conversion of forest land to agricultural land was also the lion share, about 96.93%. The remaining 2.8%, 0.21% and 0.06% of the forest were transformed into other land use/cover classes like water body, built-up land and grassland respectively.
Land use/cover change simulation and prediction
Deforestation suitability map: In order to produce deforestation suitability map, attributed four different factors as driving forces or decision variables for forest cover change. These factors served as criteria that defined some degree of suitability for an activity under consideration and accordingly individual factor scores were assigned. Individual factor scores either enhanced or weakened the overall suitability of an alternative, depending on the relative importance factor. Therefore, forest suitability map was prepared by assigning weights for factors like; road distance, slope, settlement area distance and forest guard station distance as 0.3888, 0.2793, 0.1745 and 0.1574, respectively, with CR of 0.02.

Figure 5: BGFPA change drivers factors (a) Slope (b) Distance to settlement area (c) Forest guard station (d)Road and Constraints (e) Existing agricultural area (f) Existing road.
Have pointed out, deforestation is a complex ecological and socio-economic process caused by a number of human and natural factors. Distance to the edge of the village or distance to the boundary of village and BGFPA, acting as proximate cause for deforestation due to agricultural land expansion and played an important role in changes of forest area and increase in new agricultural areas. This indicated that deforestation was the heaviest around the boundary of the local village and Belete Gera forest priority area. Another proximate factor for forest cover change of BGFPA was distance from road. In this study, it was one of the factors for change in forest due to new settlements following road network that in turns to agricultural land expansion. The forest area within the slope less than 65 degree mostly converted in to agricultural land. In this study forest suitability map was used during simulation and prediction of the study area.

Figure 6: Suitability map of forest cover change.
Validation of actual and simulated LULC of 2018 year
The simulation of LULC for the year 2018 was based on change in factor’s impact with time and trend of forest cover change from 1980 to 1999. In order to validate the LULC simulation generated using the CA-Markov model, the simulated land use areas were relate with the actual land use areas. Comparison of simulated and actual map for the year 2018 can be shown in Figures 7 and 8.

Figure 7: Simulated map of 2018.
Visual analysis shows that simulated LULC map and actual map have close resemblances but not exactly matched especially for Grassland and water body classes. Hence, the detailed statistical analysis based on the Kappa coefficient is used to measure the overall agreement of matrix, the ratio diagonal values summation versus total number of pixel counts within matrix, and the non-diagonal elements will be the best approach to consider the model accuracy. A kappa value of 0 illustrates the agreement between actual and reference map (equals chance agreement), the upper and lower limit of kappa is +1.00 (it is occur when there is total agreement) and -1.00 (it is happen when agreement is less chance. According to if the results are greater than 0.8 for each kappa index agreement, then the K statistics are considered accurate. The accuracy assessment of the study was done using VALIDATE module in IDRISI Selva environment v.17. The results reveals that K values (K standard=0.8370; K no=0.8780; K location=0.9033; K location Strata=0.9033) above 0.8 showing satisfactory level of accuracy. Therefore, CA-Markov modeling is suitable for accurately predict the future LULCs of the study area. Moreover, this study was useful for natural resource management as well as decision making and planning which involve protecting Belete Gera forest priority area in particular and Ethiopia forest in general.

Figure 8: Actual map of 2018.
Predicted LULC of 2037 and 2056 years
Future LULC change maps were predicted for future 38 years (Figures 9 and 10). It followed n-step Markov chain transition probability and Von Neumann’s self-Reproducing Cellular Automata 3 × 3 kernels that have 8 neighboring pixels, processed in IDRISI Selva using spatial modeling tools.
Therefore, for this study the transition probability matrix of the 1980 years-1999 years, 1999 years-2018 years and 2018 years-2037 years were generated to simulate land use/ cover of 2018 year and predict 2037 years and 2056 years respectively. 2037 year LULC prediction, was based on 2018 LULC map that was set as starting year and transition probability matrix of 1999 periods-2018 periods was the statistical input of the result of Markov chain model. In this projection the number of iterations specified were equal to the future prediction date specified when Markov was running to produce transition areas image and transition probability matrix. As a result, the expected areas to change in transition area matrix (Table 8) were observed to be forest, water body and grassland; it could be due to agricultural expansion. It was observed that agricultural expansion is the influential force for change especially in forest, water body and grassland due to conversion to settlement area, and agricultural land within rapidly increasing village population in Belete Gera forest priority area. The predicted maps reveals forest land areas were reduced in theatrical manner, while agricultural land area increased rapidly. In some manner grassland area and water body were reduced as it is visible in the predicted maps of the 2037 years and 2056 years.
| Changing from 2018 | Probability of changing by 2037 to; | Sub-totals | |||||
|---|---|---|---|---|---|---|---|
| Agriculture | Forest | Built-up | Grassland | Water body | Total | Loss | |
| Agriculture | 0.9965 | 0.0013 | 0.0017 | 0.0005 | 0 | 1 | 0.0035 |
| Forest | 0.3181 | 0.6771 | 0.0008 | 0.0003 | 0.0037 | 1 | 0.3229 |
| Built-up | 0.1055 | 0 | 0.8945 | 0 | 0 | 1 | 0.1055 |
| Grassland | 0.2388 | 0.0002 | 0.0004 | 0.7605 | 0.0001 | 1 | 0.2395 |
| Water body | 0.5341 | 0.0495 | 0.0029 | 0.0157 | 0.3978 | 1 | 0.6022 |
| Total | 2.193 | 0.7281 | 0.9003 | 0.777 | 0.4016 | 5 | |
| Gain | 1.1965 | 0.051 | 0.0058 | 0.0165 | 0.0038 | ||
Table 8: Transition probability matrix derived from the LULC maps of BGFPA during 2018-2037.
Antonio.C.A State that; migratory agriculture account for 70 percent of deforestation in Africa. According to FAO, Africa accounts -0.18% of forest loss per annum while in Latin America the rate of deforestation is -0.23% per year and in the World the rate of deforestation accounts -0.07% per year. According to transition probability matrix of 2018 and 2037 (Table 8) forest cover would be loss in 0.323% within 19 years out of this 0.318% of forest area expected to transform to agricultural land. This would be labels more area of forest cover would be converted to agriculture and the other 0.0008%, 0.0003% and 0.0037% would be expected to change to built-up, grassland and water bodies respectively. Depending on this transition probability matrix forest land would be gain 0.051 % from other LULC; this means the rate of deforestation would be occurred within the future 19 years in BGFPA may be 0.272%. Concerning this result the rate of deforestation in BGFPA would be 0.143% annually which should be the highest annual rate of deforestation. Therefore, the rate of deforestation expected in the study area is high due to agricultural land expansion is drastically changing and harms natural forests of the area. If this action would be continued in BGFPA the forest area is cleared within future seven decades.

Figure 9: Land use/cover change prediction map of 2037.
Land use land cover prediction of 2037 year shows forest land area covered 94,527.52 hectares in 2018 year and in 2037 year the forest land cover is expected to reduced 64,322.87 hectares. This means there would be a loss of 30,204.65 hectares of forest land in nineteen years. On the other hand, agricultural land is expected to increase 30,693.91 hectares within future 19 years from 117,201.65 hectares that it covers in 2018 year to the 147,895.56 hectares in 2037 year. In addition built-up area would likely to increase, in small manner from 408.16 hectares in 2018 to 647.19 hectares in the future 19 years. The other land use land covers grassland and water bodies are expected to decline within the future nineteen years. Therefore, agricultural land was covered 54.57% out of total land in the study area in 2018 and it would be expected to increased 68.86% out of total land in BGFPA in 2037, while forest land was covered 44.01% in 2018 and would be considered to decreased 29.95% in the future nineteen years [9].

Figure 10: Land use/cover change prediction map of 2056.
In addition, the predicted land use/cover change area of future 2056 year is exhibited in the Table 9 below represents forest land would be cover 20.44% out of the total land area covered in the study area. Forest land cover comprised 44.01% in 2018 year out of total land area in the study area and would be decreased to 20.44% in the future 2056 year. In other way agricultural land area shares 54.57% out of total land area of the Belete Gera Forest in 2018 and would increase to 78.59% in the future 2056 year out of the total land area of BGFPA. The other land use/cover means grassland and water body would be decreased from 0.45% and 0.78% in 2018 to 0.41%, 0.86%respectively in 2056 year out of total land coverage of the study area, on the other hand built-up area should be increase to 0.30% in 2056 year than that it shared 0.19% in 2018 year out of total land in BGFPA.
| LULC type | Year | |||||||
|---|---|---|---|---|---|---|---|---|
| 2037 | 2056 | 2018-2037 | 2037-2056 | |||||
| Area (ha) | % | Area (ha) | % | changed (ha) | % | changed (ha) | % | |
| Agriculture | 147895.6 | 68.86 | 168791.9 | 78.59 | 30693.91 | 14.29 | 20896.34 | 9.73 |
| Forest | 64322.87 | 29.95 | 43906.5 | 20.44 | 30204.65 | 14.06 | 20416.37 | 9.51 |
| Built-up | 647.19 | 0.3 | 663.3 | 0.31 | 239.03 | 0.11 | 16.11 | 0.01 |
| Grassland | 882.27 | 0.41 | 763.65 | 0.36 | 74.03 | 0.03 | 118.62 | 0.06 |
| Water Body | 1030.95 | 0.48 | 653.49 | 0.3 | 654.27 | 0.3 | 377.46 | 0.18 |
| Total | 214778.8 | 100 | 214778.8 | 100 | ||||
Table 9: Expected land use/cover change predicted area in (hectare) and percent for 2037 years and 2056 years.
Moreover, the rate changes of predicted forest land, grassland, and water body were higher in the both prediction periods. Whereas, the change rate of agricultural land was negative, means increased time to time in the all prediction years. Deforestation would be occurred as a result of conversion of the forest land cover into agriculture or into settlement area thus increasing deforestation. In Table 9 the forest cover area would be decrease from 94,527.52 ha in 2018 to 43,906.50 ha in 2056 resulting in 1,332.13 ha per year deforestation rate. That mean the forests will be cleared after seven decades if it continues in this trend. On the other hand, agricultural land would be increased from 54.57% in 2018 to 78.59% in 2056 resulting in 0.63% increasing year to year. Therefore, decreasing the areal of forestland formation leads to increasing deforestation and drought, which interns to climate change and disturbs ecosystems [10].
As a result, model suggests that forestland should reduce more around mild slope and horizontal surface which was proper for wild animals and the prediction of decreasing of forest land may be due to population growth and expansion of agricultural land area. Contemporary agricultural land increasing would be improved the amount of crop production in the BGFPA in the next 38 years. In this study, geophysical and distance based factors were considered. However, presence of these factors may reduce differences in simulation results of land use structure. In general, prediction are intended to provide environmental management decision makers to have a protect, control and monitor the potential forest cover occasions and challenges that future circumstances may possibly present [11].
Landsat 5 TM image data for 1980 years and 1999 years, and Landsat 8 OLI image data for 2018 year were used to obtain land use/cover maps for 1980, 1999, and 2018 periods. Then the overall forms of LULC of the study area was simulated for the 2018 year and predicted for the future 2037 and 2056 periods based on CA-Markov model. According to the results of the classification of 1980 and 1999 LULC maps, the forest area coverage was high out of all LULC considered, in addition the result shows there was a slight rate of change of forest land in years between 1980 and 1999 in Belete Gera forest priority Area. However, forest cover was drastically reduced during the study year interval of 1999 to 2018. The forest areas in 1980, 1999, and 2018 were 146,684.23, 139,037.30 and 94,527.52 hectares respectively. Grassland and water body were also decreased from 1980 year-2018 year to year. In contrast, agricultural land areas were increased in 1980, 1999, and 2018 by 39,180.30, 66,364.09, and 117,201.65 hectares, respectively. The built-up area was also increased time to time in BGFPA.
Moreover, the LULC changes in BGFPA from 1980-2018 were mainly related to the influence of human activities. The forest land and grassland changed areas were large, and their changes could be due to expansion of agricultural land areas, and water areas were reduced following the reduction of forest cover, which is mandatory for protecting water quantity and quality. In other way agricultural land and built-up areas were drastically increased from the beginning to the end seeking forest cover, grassland and water body areas conversion to others. BGFPA has experienced deforestation due to the increasing of population and expansion of agricultural land area; it could be resulted to uncontrolled and unmanageable of land use development. Therefore, improper continuous development of land use has led to increasing forest destruction and ecosystem degradation in the BGFPA. Hence, future land use/cover change maps can be used as a premature warning system for proper land use development to control undisturbed area of natural resources and ecosystem from human activities. Likewise, a future prediction of LULC change map could help for planning and management of natural resources.
The authors declare no conflict of interest.
[Crossref] [Google Scholar] [PubMed]
[Crossref]
Citation: Gemmechis WA. (2023) Modeling Earth Systems and Environment Land Use Land Cover Dynamics Using CA-Markov Chain Model and Geospatial Techniques: A Case of Belete Gera Regional Forest Priority Area, South Western Ethiopia. J For Res. 12:340.
Received: 13-Oct-2022, Manuscript No. JFOR-22-19579; Editor assigned: 17-Oct-2022, Pre QC No. JFOR-22-19579 (PQ); Reviewed: 31-Oct-2022, QC No. JFOR-22-19579; Revised: 27-Jan-2023, Manuscript No. JFOR-22-19579 (R); Published: 03-Feb-2023 , DOI: 10.35248/2168-9776.23.12.340
Copyright: © 2023 Gemmechis WA. This is an open-access article distributed under the terms of the Creative Commons Attribution License, which permits unrestricted use, distribution, and reproduction in any medium, provided the original author and source are credited.