Journal of Drug Metabolism & Toxicology
Open Access
ISSN: 2157-7609
ISSN: 2157-7609
Research Article - (2022)Volume 16, Issue 2
Background: The false folded protein of alpha (α) synuclein forms aggregation and causes neurodegenerative diseases known as α-synucleinopathies, such as Parkinson's disease. A radioactive fluor- labeled ligand, (Z)-{(fluoroethoxy) ethyl}-(E)-3-(4-nitrophenyl)-allylidene]-indolin-2-one (αsyn-18F), was synthesized and tested as a Positron Emission Tomography (PET) imaging agent for use in animal studies for the diagnosis of α-synucleinopathies.
Aim: To assess the synthetic products qualities of α-syn-F standard and its precursor, α-syn-Ms (Ms: methanesulfonate), determine the attendant impurities, and metabolites of α-syn-F in plasma, liver and brain biosystems.
Methods: Various sample solutions were analyzed via High-Performance Liquid Chromatography (HPLC) on a C18 column, with the identities determined via electrospray ionization-triple quardupole tandem mass spectrometry.
Results: The purities of α-syn-F and α-syn-Ms were both better than 94% with the major impurities being intermediate product residuals. The analytical method for tracing impurities in α-syn-F was applied to study the metabolites in various biomatrices, including rat liver microsomes, mice plasma, and liver and brain homogenate solutions. Here, seven, four, ten, and six metabolites were identified in the four biomatrices, respectively.
Conclusion: Biotransformation occurs in fluoroethoxyethyl, which results in the truncation and oxidation of the side chain and hydroxylation at the nitrophenylallylideneindolinone group before sulfonation, methylation, and glycine conjugation. A number of these metabolites lost their fluor and were not more traceable on the PET graph. The results suggest that PET imaging should be finalized within 30 min after intravenous administration of α-syn-F into the body.
Drug metabolism; α-Synuclein; Molecular imaging agent; Positron emission topography; Nitrophenylallylideneindolinone; Tandem mass spectrometry
The population and rate of occurrence of aging-associated Central Nervous System (CNS) diseases, including Alzheimer's Disease (AD), Parkinson's Disease (PD), Lewy Body Dementia (LBD), and Multiple System Atrophy (MSA), are increasing rapidly with the increased aging of the global population. These chronic neurodegenerative diseases cause extreme suffering for both the patient and their families. Noninvasive molecular imaging techniques, such as Positron Emission Tomography (PET), Single Photon Emission Computed Tomography (SPECT) and Magnetic Resonance Imaging (MRI), provide insights into pathophysiology and inform the development and evaluation of the best methods for early diagnosis of CNS retrogressive diseases [1,2], as well as the subsequent management of the patient’s condition while facilitating research on new drugs. Herein, developing the appropriate precise imaging probes is the key point [2].
PD is characterized by motor dysfunctions, such as resting tremors, bradykinesia, and rigidity, and by nonmotor symptoms, such as depression, fatigue, and cognitive impairment. It is the second most common neurodegenerative disorder after AD [1]. Meanwhile, pathological section examinations of PD patients indicate that dopaminergic neurons in mesostriatal and deposits of alpha (α)- synuclein protein are the major characterizations.
The common pathological hallmark of PD and LBD is that abnormal α-synuclein protein aggregates in Lewy Body (LB) and Lewy Neurites (LN). In normal CNS, α-synuclein is a protein in the presynaptic nerve terminal with 140 amino acid units at an unfolded and highly soluble state [3]. But in PD patients, β-sheet stabilized α-synuclein forms highly ordered insoluble aggregates, known as α-synuclein fibrils, with the involvement of divalent metal ions, including Cu2+, Ca2+ and Fe2+ [3-6]. It is also present in AD and MSA patients at various locations, such as the cingulate cortex, substantia nigra, thalamus, and cerebellum. This condition is termed α-synucleinopathy [7,8] because α-synuclein oligomers induce lipid peroxidation, the release of oxy-radicals, and dopaminergic neuro cell death known as ferroptosis [4,5]. As such, false-folded α-synuclein is a biomarker for PD [9], and the modulation of lipid peroxidation or ferroptosis may present a new potential therapeutic approaches for PD [4].
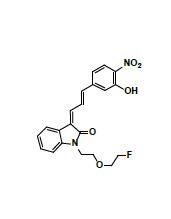
With the identification of the roles and structure of α-synuclein fibrils in neuro-degenerated patients’ CNS, designing higher selectivity/sensitivity PET molecular probes for the diagnosis of α-synucleinopathies has attracted a great deal of attention. In fact, various radiolabeled lead compounds for imaging α-synucleinopathies in the brain have been developed, including the phenothiazine, chalcone, indolinone and indolinonediene analogues [9-11]. The results of the attendant studies have demonstrated that 18F-46a ((Z)-1-(4-(2-fluoroethoxy)benzyl)-3-((E)- 3-(4-nitrophenyl)allylidene)indolin-2-one) has the highest affinity (Ki=2 nM) for α-synuclein fibrils and a higher selectivity than Aβ and tau fibrils. However, the high lipophilicity (logP 4.18) of 18F-46a results in a high level of background binding [10], making it an unsuitable PET probe for imaging LBs and LNs in PD patients. The structures of candidate ligands based on indolinone series are constantly modified in silico via a Structure-Activity Relationship (SAR) and the computer modeling of molecular docking. However, no optimal radiotracer has emerged for application in clinical research on the diagnosis of α-synucleinopathies [8,12].
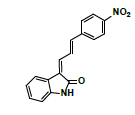
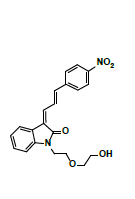
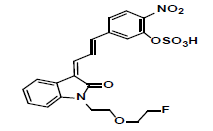
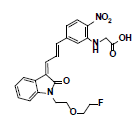
Owing to the high affinity and good selectivity of 18F-46a in term of α-synuclein fibrils, related series analogs have the potential to become optimal imaging agents for α-synucleinopathy diagnosis. To lower the structural lipophilicity of 18F-46a and increase the suitability for binding to α-synuclein fibrils, the ligand (Z)-1-(2-(2- fluoroethoxy)ethyl)-3-((E)-3-(4-nitrophenyl)allylidene)indolin-2-one, with ethyl replacing the benzyl group of 18F-46a, was designed and synthesized (Figure 1) following the procedures in [11] for the PD imaging of animal model studies by the Institute of Nuclear Energy Research (INER), Taiwan. The new ligand with a lower lipophilicity side chain and lower molecular weight than 18F-46a was called α-syn-18F currently. The performance of α-syn-18F was assayed in vitro in the INER and the primary results are optimistic, with binding affinity (Kd) to α-synuclein at nanomolar range and better specificity over Aβ and τ proteins. PET scintigraphy of α-syn- 18F on animal model demonstrated that the ligand distributes over the brain (data will be published later). The patent of α-syn-18F was filed for the Intellectual Property Office (No. 111116356) in Taiwan and also submitted to the Patent and Trademark Office, USA.

Figure 1: Structure and synthetic scheme of a-syn-F ligand.
Chemicals with indolinone core structure that originate from natural or synthetic products are among the major categories of bioactive compounds and are often employed as anticancer drugs, calcium channel blockers, N-methyl-D-Aspartate (NMDA) receptor antagonists, anti-Alzheimer’s, antibacterial, and antiangiogenic drugs [13]. For example, the kinase inhibitor sunitinib is used for tumor therapy, with its analogue GW5074 used as an inhibitor of a class of Histone Deacetylases (HDACs) [14]. Therefore, better understanding the trend of the biotransformation and metabolites of indolinone pharmacophore series is valuable to appropriately employ them, in addition to improving the synthesized product quality and imaging resolution for PET imaging agents; thus, helping in modifying the molecular structure to improve the physicochemical properties and to select more suitable molecules for subsequent development [15].
In the study, a Reversed Phase High Performance Liquid Chromatography (RP-HPLC) analytical method was applied to determine the purity of the α-syn-F standard (F-19 non-radioactive version), precursor α-syn-Ms (Ms: SO3CH3 group), levels of α-syn-F following incubation in Rat Liver Microsomes (RLM), the liver and brain tissues homogenates and plasma matrices of mice. The impurities in synthesized products and metabolites of α-syn-19F in various bio-matrices were determined based on fragmented mass spectra using electrospray ionization triple quadrupole linear ion trap tandem mass spectrometry (ESI-QqQ-LIT MS/MS). The results can be used in the quality control of the synthesis/purification processes and will be useful in image-based interpretations of α-syn- 18F.
Materials
The ligand α-syn-F was designed by INER in Taiwan, and contract synthesized products of α-syn-F and α-syn-Ms by Uni-Ward Corp, Taipei. The products passed a quality inspection carried out in terms of mass spectra Molecular Weight (MW) 382.3 amu and 1H, 13C-NMR. The liver microsomes of pooled male rats and solutions of NADPH cofactors A and B were purchased from Corning Life Sciences, USA. The organs and fluids of BALB/c nude mice (males, aged 12 weeks), which were purchased from Bio LASCO (Taipei, Taiwan), were taken for metabolism-related investigation of α-syn-F in the liver, brain tissue homogenized solutions, and plasma. The mice were housed in a controlled environment (22 ± 2°C and 50% ± 5% relative humidity) with a 12:12 h light-dark cycle and were provides with a rodent laboratory chow diet and drinking water ad libitum. All animal examinations were performed in accordance with the National Institute of Health Guidelines for the Care and Use of Laboratory Animals and were approved by INER’s Institute Animal Care and Use Committee (Approval No. 110001). After anesthetizing the BALB/c nude mouse, blood was collected using a vacutainer with heparin for plasma preparation. Following this, the liver and brain were removed immediately and stored at -70˚C for preparation of homogenized solutions and subsequent metabolism studies.
Instruments
The components of the synthesized α-syn-Ms precursor, α-syn-F standard and metabolites were separated and the levels were determined by HPLC (Agilent 1200 with a degasser, a thermostat (10°C) autosampler, binary pump, column oven, and diode array detector, Palo Alto, CA, USA) operated by ChemStation software (Rev. B 0304). The detection wavelength was set to 380 nm for highly conjugated nitrophenylindolinonediene absorbance. The mobile phase involved a programmed gradient mixing of ammonium formate (5 mM) and formic acid (1 mL) in 1 L aqueous solution (A pump) and formic acid 0.1%/acetonitrile (ACN, B pump), with the following program (time, min – B%): 0 – 10%, 0.1 – 10%, 1 – 20%, 5 – 60%, 8 – 80%, 10 – 80%, and 10.1 – 10%, with A pump and B pump percentages of 100%, a flow rate of 0.8 mL/min, and a turnaround time of 13 min per injection. The injection volume of the sample solution was 5 μL. The stationary phase was Chromolith RP18e (10 cm × 3 mm, Merck, Darmstadt, Germany) with a guard column. The components were identified based on the tandemmass spectra data acquired by AB Sciex (Concord, ON, Canada) 4000QTRAP® mass spectrometry instrument (equipped with ESI-QqQ-LIT) using Analyst software 1.6.2. Here N2 gas obtained from a nitrogen generator (PEAK Scientific, Scotland, UK) was the gas used for mass spectrometry analysis, including the nebulizer, curtain, and collision gases. The appropriate mass spectrometry parameters for α-syn-F and its derivatives were as follows: 20 psi of curtain gas (CUR), medium collision gas (CAD), ionspray voltage (IS) of 5500 V (+ion mode) and 4200 V (-ion mode), a temperature (TEM) of 400˚C, a psi of 20 for both ion source gases (GS1 and GS2), a Declustering potential (DP) of 70 V, an Entrance Potential (EP) of 10 V, a Collision Energy (CE) of 35 V, and a collision cell exit potential (CXP) of 10 V. Meanwhile, the interface heater was switched on.
Experimental
RLM metabolism was performed following the procedures “Mammalian liver microsomes” guidelines issued by BD Biosciences [16]. Here, deionized water (1100 μL), 300 μL of 0.5 M potassium phosphate pH 7.4 solution (PBS), 60 μL of NADPH A, 12 μL of NADPH B, and 3 μL of α-syn-F in acetonitrile (3000 μg mL-1) were mixed in a 2 mL Eppendorf tube before being preheated in a 37˚C water bath for 5 min. A 35 μL RLM (0.7 mg) was then added and the tube was vortexed. Following this, the α-syn-F/RLM solution was incubated in a 37°C thermostat bath with shaking (at 120 rpm) for 0, 5, 30, 60, 90 and 120 min before 250 μL of the mixed/incubated solution was dispensed into other tubes with the addition of 250 μL of ACN. The tubes were then vortexed and placed in an ice bath to stop the reaction. The six tubes were then centrifuged at 10,000 rpm for 10 min before the supernatant from the reacted solutions was dispensed into HPLC vials and stored at -70˚C prior to HPLC and MS/MS operations.
For the α-syn-F metabolism study in the liver and brain homogenized solutions, the organs (liver=4.3 g; brain=3.1 g) were placed in 15- mL tubes, and thawed in an ice bath with 8.5 and 6.2 mL (1:2 w/v) of mixture solution composed of sucrose (0.25 M) and EDTA. Na2 (1 mM) were added to the hepatic and brain tubes, respectively. The organs were homogenized into solutions with volume of 12 mL and 9 mL, using an IKA T25 Ultra-Turrax instrument in iced bath. The solutions were then aliquoted into six tubes respectively (2 mL and 1.5 mL of each) for the metabolism experiments [17]. Following this, PBS (0.5 M 200 μL), NADPH A (100 μL), NADPH B (20 μL), 5 mg of bovine serum albumin and 5 μL of α-syn-F (3000 μg mL-1) in ACN were added to one of the liver or brain tubes and mixed well before being incubated at 37˚C for up to 2.5 h. Then, 0.4 mL samples of the incubated solutions were dispensed into Eppendorf tubes with the addition of 0.4 mL ACN, with the solutions treated as an LM solution.
For the α-syn-F metabolism study of the plasma, 20 μL of 0.5 M PBS, 180 μL of deionized water, 5 μL of α-syn-F (3000 μg mL-1) were mixed with 0.8 mL of plasma for up to 2 h, with incubated solutions (100 μL) taken at specified periods and treated the solutions as an LM solution.
High-performance liquid chromatography analytical method of the synthetic products α-syn-Ms and α syn-F
The HPLC analytical method for determination of the purities/ levels of α-syn-F and its relatives was based on a reversed-phase C-18 modified monolithic porous silica gel column. The chromatograms (Figures 2a and 2b) for α-syn-Ms and α-syn-F (1 mg mL-1 in ACN) indicated that the HPLC method is suitable for studying the synthetic impurities and metabolites of α-syn-F. Table 1 summarizes the HPLC performance results for α-syn-Ms and α-syn-F, including the retention time, theoretical plate number (N), resolution, selectivity, dynamic range and linearity of the calibration curve, and limit of detection and limit of quantification (detected at UV 380 nm). The retention time difference between α-syn-Ms and α-syn-F was 0.39 min, which was sufficient for separating both in the prepared α-syn-F product.

Figure 2: HPLC chromatograms for synthesized products of (a) a-syn-Ms and (b) a-syn-F.
| a-syn-Ms | a-syn-F | |
|---|---|---|
| Retention time tR, min | 7.6-7.7 | 8.0-8.1 |
| *SD; RSD% | 0.016; 0.206% | 0.017; 0.203% |
| Symmetry | 0.74 | 0.75 |
| Theoretical Plate, N | 65650 | 69900 |
| Resolution | 3.23 | 3.32 |
| Selectivity | 1.06 | 1.05 |
| Dynamic range / Linearity / slope of calibration curve | 0.1-1000 mg mL-1 / 0.99999 / 27.0 | 0.1-1000 mg mL-1 / 0.99987 / 33.8 |
| LOQ | 30 ng mL-1 | 30 ng mL-1 |
| LOD | 10 ng mL-1 | 10 ng mL-1 |
| Note: *SD: standard deviation; RSD: relative standard deviation | ||
Table 1: Summary of HPLC performance for α-syn-Ms and α-syn-F.
Identification of synthetic products, α-syn-Ms and α-syn-F based on tandem mass spectra
To study the contaminated impurities in synthetic products and the unknown metabolites of α-syn-F by tandem mass spectrometry, the first step involves investigating the fragmentation pathways of the compounds. Here, sample solutions of α-syn-Ms and α-syn-F (100 μg mL-1 in 0.1% formic acid/ACN) were introduced into the mass spectrometer using a syringe pump at 10 μL min-1 respectively. The representative MWs are 382.1 and 458.1 amu for α-syn-F and α-syn-Ms, respectively. The first-order MS (MS1) values for α-syn-F were 383.2, 384.1 and 385.1 amu and those for α-syn-Ms were 459.2, 460.2, and 461.1 amu (positive ion enhances resolution mode, +ER). The enhance product ion (EPI mode) spectra and fragmented ion structures in terms of m/z values of 459 and 383 are shown in (Figures 3a and 3b), respectively. Here the most abundant and stable ion was m/z 319 for both α-syn-Ms and α-syn-F. Because the structures of α-syn-F and α-syn-Ms are composed of indolinone and nitrophenyl, and are conjugated via allylidene, the fragmented ions possess highly delocalizing rearranged metastable states. The precursor ion scan (Prec mode) of m/z 319 amu for the α-syn-Ms and α-syn-F solutions was 459 and 383 amu respectively. The neutral loss scan (NL mode) of m/z 140 for α-syn-Ms was 459.7, and of m/z 64 for α-syn-F, the value was 383.4. These results confirmed the parent-product ions relationship and the loss of Ms (CH2)2OH or F (CH2)2OH for α-syn-Ms and α-syn-F via fragmentation. Therefore, multiple reaction monitor (MRM mode) ion pairs of 459.2→319.1 and 383.2→319.1 were selected for the HPLC-tandem mass spectrometric quantitation of α-syn-Ms and α-syn-F, respectively.

Figure 3: Fragmented mass spectra and pathways of (a) a-syn-Ms and (b) a-syn-F.
High-performance liquid chromatography-tandem mass spectrometry analytical method for α-syn-Ms and α-syn-F
The eluate solution of α-syn-Ms and α-syn-F (400 ng mL-1 of each) mixture from the C18 column was split two ways in a ratio of 10:1 for ultraviolet (UV) and MS detection (MRM mode). Figure 4 shows the chromatograms in MRM mode with good resolution. Here, the dynamic range of the calibration curves was 20–2000 ng mL-1, with correlation coefficients of 0.9995 and 0.9997 for α-syn- Ms and α-syn-F, respectively. It is thus believed that the HPLC-UVMS/ MS analytical method is suitable for the determination of α-syn-F analogs.

Figure 4: LC-MS/MS chromatogram of a-syn-Ms/a-syn-F mixed solution: (a) MRM mode, (b) 383.2 -> 319.1, (c) 459.2 -> 319.1
Determination of the purity of synthesized products, α-syn- Ms and α-syn-F and therein contaminated impurities
The chromatographic purity analysis results for the synthesized α syn-Ms and α-syn-F (Figure 2) were 95.8% ± 0.1% and 94.8% ± 0.1%, respectively, with contamination from three and five significant impurities. The retention times, peak area percentages, MS1 and MS2 values, and assumed identities of the impurities are summarized in Table 2. These impurities were determined to be processes intermediate residuals in the products. Therefore, the product qualities of α-syn-Ms and α-syn-F were qualified, and the trace derivatives or related compounds of α-syn-F could be determined based on the LC-MS/MS method.
| α-syn-Ms Peak No. |
tR (min) | Area% | MS1 | MS2 | Compound |
|---|---|---|---|---|---|
| #1 | 6.951 | 0.4 | --- | --- | |
| #2 | 7.314 | 1.44 | 293 | 276 | Nitrophenylallylidiene indolinone |
| #3 | 7.697 | 95.8 | 459 | a-syn-Ms, target product | |
| #4 | 8.827 | 2.19 | 443/445 | 349, 319, 305, 291 | α-syn-79/81Br |
| α-syn-F Peak No. |
tR (min) | Area% | MS1 | MS2 | Compound |
| #1 | 7.228 | 0.157 | 293 | 276 | Nitrophenylallylidiene indolinone |
| #2 | 7.605 | 1.065 | 459 | 363, 319, 291 | α -syn-Ms |
| #3 | 8.091 | 94.8 | 383 | α-syn-F, target product | |
| #4 | 8.63 | 0.34 | --- | --- | |
| #5 | 8.827 | 3.05 | 443/445 | 349, 319, 305, 291 | α-syn-79/81Br |
| #6 | 9.865 | 0.53 | --- | --- |
Table 2: Summary of chromatography results of synthesized products of a -syn-Ms and a -syn-F.
Study of metabolism of α-syn-F
How imaging agents can be biotransformed in an organism corresponding to its distribution, elimination route/rate, and noise signal, resolution of photograph and usage guidelines was also investigated. In general, pharmaceuticals are converted to less active or inactive compounds primarily by the cytochrome P450 enzymes families of the liver [17,18] and partially in the kidney [19], the brain [20,21], plasma [22,23], and microbials in the intestines [24]. Meanwhile, PET imaging agents for CNS disorders are introduced into the body through intravenous (IV) injection before being transported by the blood in the circulatory system and bound to the target issue in the brain. Hence the metabolism studies of α-syn-F were concerned with the liver, the brain and plasma.
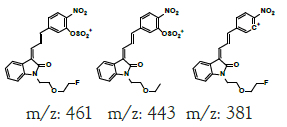
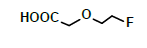
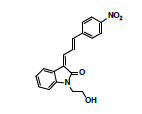
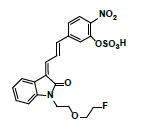
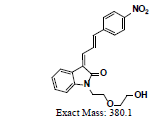
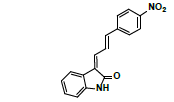
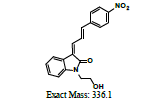
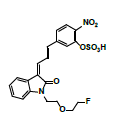
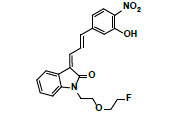
Hepatic metabolism studies were carried out using commercial rat liver microsomes and mice Liver Homogenate (LH) solutions. The overlapped chromatograms of α-syn-F bio-transformed in the RLM for various periods are shown in Figure 5a, and the peak area- reaction time plots are shown in Figure 5b. There were five metabolites peaks (MLM1 – MLM5, LM: Liver Microsomes) at tR (retention time) 5.6, 5.8, 6.05, 6.35 and 6.7 min sequentially (detected by UV 380 nm). The level of α-syn-F was reduced to 50% for a 2 h reaction, and the most abundant metabolite was MLM5. Following the observation of the MS1 of the LC-MS analysis and the Extraction Ion Count (XIC), the potential MS1 m/z values of the metabolites were found to be 479, 399, 381, 337, 293, 123 (positive ion scan), and 477 (negative ion scan). The tandem mass spectra (MS2, EPI mode) of individual potential metabolites were obtained in terms of ramping collision energies of 10–50 V, and the assumed identities of the metabolites were determined based on the relationships among the m/z values of the fragmented ions, corresponding structures, and original chemical, α-syn-F. Table 3 summarizes the MS/MS data and structures of the α-syn-F metabolites in the rat-liver microsomes. Biotransformation occurred at the alkyl side chain of α-syn-F and cleaved at C–F (oxidative defluorination), O–C (hydrolysis of ether), and N–C bonding (dealkylation). Meanwhile, the side chain moiety was degraded and oxidized to form a carboxylic group. A similar reaction was also observed in FEONM metabolism [25]. The metabolites of MLM1, MLM2 and MLM4 results to α-syn-F with no more traceability of α-synucleinopathy. The other metabolic type was hydroxylation at the aromatic structure of nitrophenyl (MLM5, the most abundant metabolite). Although it is impossible to exactly specify the site of hydroxyl in the highly conjugated structure of nitrophenylallylideneindolinone based on the tandem mass spectra, but the ortho site of nitrophenyl is the most possible because the inducing effect of withdrawing electronic nitro group. In terms of the MLM3, both positive and negative scan mode showed m/z at 479 and 477 respectively, which demonstrated that it has a strong acid group with molecular weight of 478 amu, and ΔMW of +96 (+SO4 group) over α-syn-F. Hence, MLM 3 was a sulfonation product of MLM5. Furthermore, the metabolite solutions were infused into the mass spectrometer, and the positive and negative ion scans found m/z at +463 and -461, respectively (MW 462 amu, +80 over α-syn-F, sulfonation product) or sulfitation of MLM 5. The four metabolites of MLM 1, MLM 2, MLM 4, and MLM 5 were phasing I oxidative products, but MLM 3 and MW 462 were phase II conjugated metabolites. Owing to the multiple and highly conjugated bonding structure of nitrophenylallylidieneindolinone, it is resistant to further biodegradation but can be transformed into more polar products and can be rapidly cleared from the body via urine.

Figure 5: (a) Chromatograms of a-syn-F bio-transformed in RLM for various periods and (b) peak area-reaction time plots. MLM 1-MLM 5 is the metabolites of a-syn-F incubated in RLM.
| Chroma- tographic peak# | Retention time, min | + or –ion, MS1 |
MS2 | Representative structures of fragmented ions | Metabolite | MW |
|---|---|---|---|---|---|---|
| 2.0* | +, 123 | 105, 80, 77.9 | 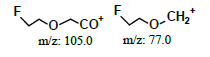 |
 |
122 | |
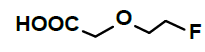
| MLM1 | 5.6 | +,293 | 275, 248.2, 216.9, 193.5, 175.0, 157 | 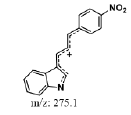 |
 |
292 |
| MLM2 | 5.8 | +,337 | 319.3, 218.8, 216.8, 201, 198.8 | 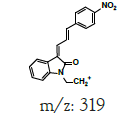 |
 |
336 |
| MLM3 | 6.1 | +,479 | 461, 443, 381 |
|
 |
478 |
| -,477 | 459, 441, 403, 341 | |||||
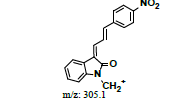
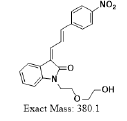
| MLM4 | 6.4 | +,381 | 363.3, 349.0, 335.0, 319 | 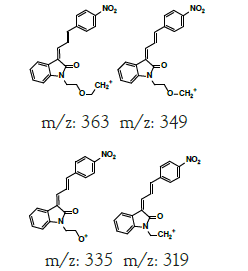 |
 |
380 |
| MLM5 | 6.7 | +,399 | 381.3, 363.3, 335.0, 307.0, 261, 244.1 | 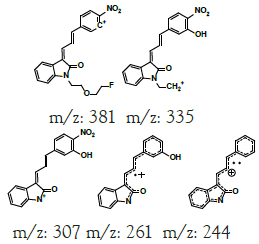 |
 |
398 |
| ND | Direct infused to MS | +,463 | 445.0, 427.1, 409.0, 371.0 | 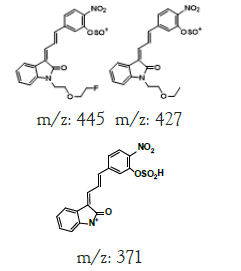 |
 |
462 |
| -,461 | 442.9, 424.9, 377.1, 341.1, 277.3 | |||||
| Note: *Detected by MS detector | ||||||
Table 3: Summary of tandem mass spectra data and structures of α-syn-F metabolites in RLM.
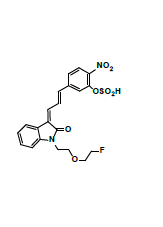
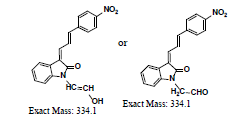
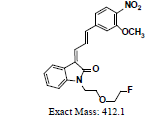
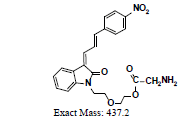
A further metabolism study was conducted in terms of the whole hepatic environment to ascertain the biodegradation scheme of α-syn-F. The chromatograms of α-syn-F in the mice liver homogenate solution indicated four metabolites (MLH 1 - MLH 4) at retention times of 6.15, 6.38, 6.52 and 6.73 min in sequentially (M1 and M4 were abundant) with 22% of α-syn-F remaining following incubation for 150 min (Figures 6a and 6b). The tandem mass spectra data for the metabolites, representative fragmented ions, and assumed identities of the metabolites are summarized in Table 4. Except for the metabolites (MLH 1 and MLH 2) were also determined in liver microsomes (MLM 3 and MLM 4), the metabolite MLH 3 with MS1 335 and MS2 317, 305 suggested that its MW is 334 amu with both –OH and –CHO groups. Therefore, MLH 3 is a tautomerism metabolite lying somewhere between enol and acetaldehyde forms. MLH 4 with MS1 413 (MW 412, ΔMW=+30 over α-syn-F → +OCH2) and MS2 381 amu, the identity of MLH 4 was determined as a methoxylation product of α-syn-F. Furthermore, the biotransformed solution was introduced into the mass spectrometer, and the MS1 and precursor ion scan of m/z 319 scanning modes showed that 123, 293, 337, 438, 456 (+ion mode) and 461 (-ion mode) related to α-syn-F and MS2 were scanned respectively to determine the identities. The metabolites of +MS1 123, 293, 337 and -MS1 461 were also determined in the liver microsomes. In terms of MS1 438, the fragmented ions MS2 421, 407 indicated that it possessed a methylamine group and an MW of 437 amu (ΔMW=+57 over MLH 2, conjugated product with glycine via carboxylic acid end) [26]. In terms of MS1 456, the fragmented ions MS2 438, 420 and 381 indicated that it possessed an -OH group and an MW of 455 amu (ΔMW = +57 over MLM 5, conjugated product with glycine via amino end).

Figure 6: (a) Chromatograms of a-syn-F biotransformed in mice liver homogenate solution for various periods and (b) peak area-reaction time plots. MLH1-MLH4 is the metabolites of a-syn-F incubated in mice liver homogenate.
| Chroma- tographic peak# | Retention time, min | + or –ion, MS1 |
MS2 | Representative structures of fragmented ions | Identity of metabolite | MW |
|---|---|---|---|---|---|---|
| 1.95* | +, 123 | 105.0, 80.0, 78.0 | 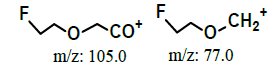 |
 |
122 | |
| ND | Direct infused to MS | +, 293 | 275.0, 249.0, 205.0, |  |
 |
292 |
| ND | Direct infused to MS | +, 337 | 319.0, 248.1 |  |
 |
336 |
| MLH1 | 6.15 | +, 479 | 461.0, 443.0, 381.1 | 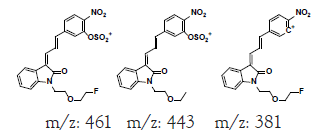 |
 |
478 |
| -, 477 | 459, 441, | |||||
| MLH2 | 6.38 | +, 381.0 | 363.1, 248.2 | 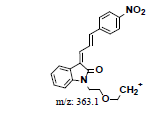 |
 |
380 |
| MLH3 | 6.52 | +, 335.0 | 317.1, 305.0, 289.2 | 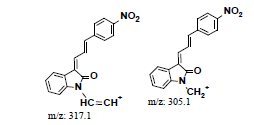 |
 |
334 |
| MLH4 | 6.73 | +, 413 | 381.2, 329.0, 315.1, 277.1 | 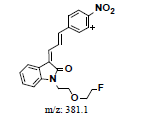 |
 |
412 |
| ND | Direct infused to MS | +, 438.2 | 421.0, 407.1, 248.1 | 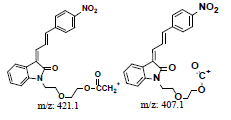 |
 |
437 |
| ND | Direct infused to MS | +, 456 | 438.3, 420.3, 381.0 | 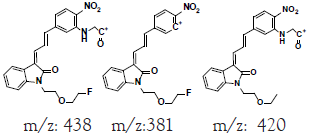 |
 |
455 |
| ND | Direct infused to MS | -, 461 | 443.0, 425.1, 377.0, 341.0 | 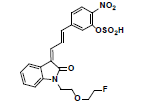 |
462 | |
| Note: *Detected by MS detector | ||||||
Table 4: Summary of tandem mass spectra data and structures of α-syn-F metabolites in the liver homogenate solution.
The metabolism studies of α-syn-F in the mice brain homogenized solution indicated that the level of α-syn-F remained more than 82% following incubation for 120 min. Two chromatographic peaks of metabolites were detected at tR = 6.15 and 6.65 min with MS1=479 and 399 amu (MB1 and MB2, Figure 7). The identified products were the same as those with MLM 3 and MLM 5. Other metabolites with MS1=123, 293, 337 and 381 amu were determined via direct infused to the tandem mass spectrometry and were found to be the same as those with the liver organ, as shown in Table 5 in minor levels.

Figure 7: The chromatograms of a-syn-F bio-transformed in mice brain homogenate solution for various periods. MB1, MB2 are the metabolites of a-syn-F incubated in mice brain homogenate.
| Chroma- tographic peak# | Retention time, min | + or –ion, MS1 |
MS2 | Representative structures of fragmented ions | Identity of metabolite | MW |
|---|---|---|---|---|---|---|
| ND | Direct infused to MS | +, 123 | 105.0, 96.0, 80.0 | 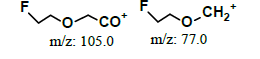 |
 |
122 |
| ND | Direct infused to MS | +, 293 | 275.0, 249.0, 217.1, | 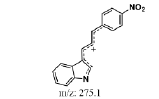 |
 |
292 |
| ND | Direct infused to MS | +, 337.0 | 319.0, 293.1, 281.0, 248.1 | 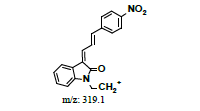 |
 |
336 |
| MB1 | 6.15 | +, 479 | 419.0, 381.1 | 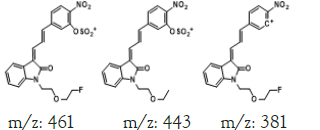 |
 |
478 |
| -, 477 | 459.0, 379.0, 341.1 |
|||||
| ND | Direct infused to MS | +, 381 | 363.1, 305.1, 248.2 |
 |
 |
380 |
| MB2 | 6.65 | +, 399 | 381.3, 335.1 | 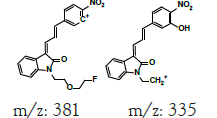 |
 |
398 |
Table 5: Summary of tandem mass spectra data and structures of α-syn-F metabolites in mice brain homogenate solution.
In terms of α-syn-F incubation in the plasma, a metabolite MP1 chromatographic peak at tR 6.6 min (with MS1=399 amu) (Figure 8) and three other minor metabolites were determined through direct infusion to the mass spectrometer (MS1=293, 337, and 381), which were the same as the metabolites in the liver and brain. Meanwhile, the metabolites formed in the plasma were primary hydrolysis or hydroxylation products.

Figure 8: Chromatograms of a-syn-F biotransformed in mice plasma solution for various periods. MP1 is the metabolites of a-syn-F incubated in mice plasma.
Although α-syn-F can be biotransformed into metabolites in plasma and the brain before diffusing their distribution and subsequently diminishing the resolution, PET imaging was performed within the first 30 min following IV injection, which means that the impact on the resolution was not serious. A rapid metabolism rate of α-syn-F with a short washing-out period will reduce the radio effect for the patient.
Comparing the metabolism study results of α-syn-F with the analog candidate ligand for detection of α-synuclein aggregation process, (Z)-1-(4-aminobenzyl)-3-(E)-(3-phenyl)-allylidene)indolin- 2-one (M0’) in human hepatocytes by UPLC/Q-TOF MS [27]. The structural differences between M0’ and α-syn-F include two parts: aminobenzyl versus fluoroethoxyethyl and phenyl versus nitrophenyl. The metabolites determined in [27] included hydroxylation (+OH), methoxylation (+OCH3), glucuronidation and sulfonation (+SO4) products at the phenylallylidene-indolinone moiety, which were related to the structure of α-syn-F and other metabolites reacted at the aminobenzyl moiety (irrelevant to α-syn-F). The products of hydroxylation, methoxylation and sulfonation on the phenylallylidene-indolinone of M0’ parallel supported the metabolism studies of α-syn-F in RLM and the liver and brain homogenate solutions of mice. Furthermore, we detected more metabolites and biodegraded products than in previous studies, in terms of phenylallylideneindolinone analogs, and ascertained the biochemical characteristics of α-syn-F ligand in a more comprehensive fashion (Figure 9).

Figure 9: Metabolism scheme of a-syn-F ligand in the liver, brain and plasma matrices.
The analytical method for α-syn-F, the ligand for PET imaging agent used to survey the aggregation process of α-synuclein in the pathogenesis of PD, that incorporated HPLC and tandem mass spectrometry was applied to determine the purities and impurity levels in the synthetic products of the precursor, α-syn-Ms, and the α-syn-F metabolites in various biomatrices. Purity was qualified and the residual process intermediates in α-syn-Ms informs quality and effects of the pharmaceutical. The studies of α-syn-F metabolism in various hepatic, brain and plasma matrices confirmed the stability and biotransformation mechanism. A few biodegraded products formed via reacting on the alkyl side chain, fluoroethoxyethyl group (dealkylation, oxidation, hydrolysis, and defluorination) but the nitrophenylallylidiene-indolinone moiety (multiple bonding and hydrophobic planar structure to be beneficial to cross through the blood-brain barrier) of α-syn-F was hardly biodegraded into smaller metabolites, conversely, more polar metabolites conjugated with sulfuric acid or glycine to facilitate its elimination.
Weihsi Chen composed the article and operated the HPLC, tandem mass spectrometry experiments. Kuanyin Chen coordinated the project and operated animal experiments. Tsungyu Shih managed the organic synthetic/purification works and the NMR analysis. Siaosyun Guan handled the animal organs and Shioushiow Farn took charge the program and the financial grant. This study was financially supported by the Atomic Energy Council, Taiwan. (Grant No. AEC-010302). The authors declare that they have no conflict of interest.
The authors declare that they have no conflict of interest.
[Crossref][Googlescholar][Pubmed]
[Crossref][Googlescholar][Pubmed]
Citation: Chen W, Chen K, Shih T, Guan S, Farn S (2022) Metabolism Study of Fluor-Nitrophenylallylideneindolinone Ligand: A Radioimaging Agent for False Folded Alpha-Synuclein in the Diagnosis of Parkinson’s Disease by High-Performance Liquid Chromatography and Tandem Mass Spectrometry. J Drug Metab Toxicol. 13: 270.
Received: 03-Oct-2022, Manuscript No. JDMT-22-19445; Editor assigned: 06-Oct-2022, Pre QC No. JDMT-22-19445 (PQ); Reviewed: 20-Oct-2022, QC No. JDMT-22-19445; Revised: 27-Oct-2022, Manuscript No. JDMT-22-19445 (R); Published: 03-Nov-2022 , DOI: 10.35248/2157-7609.22.13.270
Copyright: © 2022 Chen W, et al. This is an open-access article distributed under the terms of the Creative Commons Attribution License, which permits unrestricted use, distribution, and reproduction in any medium, provided the original author and source are credited.