Journal of Applied Pharmacy
Open Access
ISSN: 1920-4159
ISSN: 1920-4159
Research Article - (2019)Volume 11, Issue 1
We have demonstrated the use of untargeted metabolomics- a high-throughput analysis to probe the small molecule landscape of natural products based traditional medicine. The approach provides a global perspective on the quality of such natural medicine and the depth of secondary metabolites present in them. We utilized Eclipta prostrata L. as an example to demonstrate the utility of LC-MS and GC-MS based untargeted metabolomics. The mentioned research utilized three different preparations and successfully demonstrated the small molecule landscape differences in these samples. Preliminary statistical analysis using R-based web programs, indicated the samples grouped well indicating batch-to-batch consistency. Heatmaps generated from LC-MS and GC-MS data indicated the difference in abundance of various small molecules across the samples.
Natural product metabolomics; Untargeted metabolomics; LC-MS analysis; GC-MS analysis; Eclipta prostrata L.
Natural product-based medicine has been existed for ages. The documented history on the use of natural product-based medicine often refereed as Traditional Medicine (TM) dates back to 200 BC [1]. Whereas, the concept of Evidence Based Medicine (EBM) or western medicine is about 200 years old [2]. Traditional Medicine often uses diet and herbs to stimulate the human body’s innate defenses to fight disease [3]. Traditional Medicines are understood differently in each continent and gaining a new level of popularity worldwide with increased usage. Qualitative research across Europe and the US has revealed that people have very little understanding of the risks associated with such medicine. Misconceptions such as natural product-based medicines are always good or they have practically no side effects are commonly seen [4]. In reality, the performance of plant-based medicine varies greatly depending on source and location.
Regulation of natural product based traditional medicine has historically lead to a dead end as there has not been a single approach. In recent years, there has been a steady increase in rigorous research to address this issue. The lack of standardized testing procedures for TM translates into difficulty in implementing suitable policy and procedures in regulating these materials [5]. Unlike single molecule-based medicines, it is challenging to assay for specific compounds to evaluate the quality of the natural product. European Union, established Traditional Herbal Medicinal Products Directive (THMPD) in April 2011 to ensure plant based medicines are registered and the preparation has been in use for a minimum of fifteen years to be sold in EU. However there have not been any regulations on the quality. In the Continental United States, herbal products are considered as dietary supplements by US-FDA. Hence they are not required to undergo vigorous testing like most drugs and other treatments [6-10].
In the past decade there have been some reports on the use of metabolomics to study the qualitative and quantitative aspects of natural product-based medicine [11-13]. Although there are few literature reports that indicate the use of untargeted metabolomics data for natural product quality assessment, the analysis has not been exhaustive. Chemical fingerprinting of natural products has been performed from the perspective of chromatographic separation and quantification based. The main drawback of such methods is, it is nearly impossible to get chromatographic separation if the extract of the natural product contains thousands of compounds. One way to address this is by performing an untargeted approach. With the advent of current technologies such as Ultra High Definition Quadrupole-Time of Flight (UHD-QTOF) instruments, ion-mobility additions, the electronics of mass spectrometer is capable of detecting multiple ion eluting from hyphenation LC and GC. In this report, we explored the possibility of utilizing untargeted metabolomics as an approach to understand the heterogeneity as well as small molecule landscape in these natural products. To demonstrate the utility of untargeted metabolomics, we chose Eclipta prostrata L. a commonly occurring plant all around the globe often referred to as False Daisy. It grows in various tropical areas and subtropical areas around the planet [14-17].
Eclipta prostrata L. has been recognized for centuries for its derived products are used as therapeutics in many countries. For example, in Ayurveda it is referred to as Bhringaraj and south Indian Siddha medicine system, it is referred to as Karisalai. The Ayurvedic system of medicine uses different parts of the plant for various ailments, from antibacterial action, acidity, hairfall, skin diseases, asthma to various gastrointestinal disorders [7]. In Chinese medicine it is known as Mohanlian, and the tonic of Eclipta prostrata L. has been used for ‘enriching the blood’ [18-20].
In this study we present a mass spectrometry-based approach to perform an untargeted global profiling of natural product medicines as a way to understand its quality. Currently targeted and untargeted metabolomics are evolving as suitable method for evaluating the bioactivity of natural product-based medicines as well as their composition [21]. The major objective of the holistic medicine approach is the no single molecule-based therapy instead a combination of the molecules presents in the natural product. Hence performing untargeted metabolomics using various approaches provides an overall understanding as well as depth of coverage of bioactive compounds present in the natural product.
Sample collection
We obtained three different pharmaceutical preparation of Eclipta prostrata L. The samples (tablets) were obtained in four batches were crushed and homogenized. For each pharmaceutical preparation, four samples are used for further extraction and analysis.
Sample preparation
To 0.5 grams of pulverized preparations of Eclipta prostrata L, 10 mL of 5:1 mixture of acetonitrile and water containing 0.1% formic acid was added and sonicated at room temperature for 60 minutes. Followed by sonication, the samples were vortexed for 60 minutes and centrifuged at 14,000 rpm for 15 minutes. The supernatant solutions (extracts) were used as such for LC-MS analysis. For GCMS analysis, 500 μL of the extract was evaporated to dryness and dissolved in 100 μL of dry acetonitrile. To this solution, 100 μL of MTBSTFA (N-tert-Butyldimethylsilyl-N-methyltrifluoroacetamide) (Cat.no: M-108 from Sigma Aldrich) was added and incubated at 70°C for 1 hour. The solution was injected into GC-MS.
GC-MS method
Gas Chromatography- Mass Spectrometry analysis was performed on an Agilent 7890A GC coupled with Agilent 5975C inert XL EI MSD with triple axis detector. Sample organization and injection was performed by Agilent 7693 auto sampler. The separation was performed using Phenomenex Zebron ZB-5MS non-polar column (30 m X 0.25 mm ID) 0.25 μm. The GC conditions are as follows, oven temperature starts at 60°C and held for 2 minutes, at 20°C/ min the temperature was ramped to 120°C, from 120°C to 155°C at the rate of 6°C/min. In the final step the temperature was ramped to 300°C at 14.5°C per minute and held at that temperature for 10 minutes. Helium was used as carrier gas at a flow rate of 1.5 mL/min. Samples were injected at 1 μL at 325°C with a split ratio of 10:1. Samples separated out of GC were interfaced to MS at 230°C. The MS source was set at 230°C and quad temperature at 150°C. Acquisiton range was set between 30 to 550 amu at a scan rate of 5.2 scans/sec.
LC-MS method
Liquid Chromatography- Mass Spectrometry method was performed on an Agilent 1290 infinity coupled to Agilent 6538 Ultra High Definition Quadrupole Time of Flight (UHD-QToF) instrument. A separation was achieved by using reverse phase Waters Acquity UPLC HSS T3 1.8 μm (2.1 X 100 mm) column from Waters (Milford, USA). All solvents were purchased from Fischer Scientific LCMS Optima grade solvents. Water containing 0.1% formic acid was used as mobile phase A and acetonitrile containing 0.1% formic acid was used as mobile phase B. The injection volume was set at 10 μL. Samples were injected in a gradient of 97% mobile phase A and 3% mobile phase B in the initial condition to 3% mobile phase A and 97% mobile phase B in 50 minutes. With a re-equilibration time of 10 minutes.
MS conditions are as follows: The MS data acquisition was performed from 50-1000m/z at 1.0 spectra/sec scan rate. The source gas temperature was set at 350°C with flow of 8 l/min. The nebulizer gas was set at 55 psig. The capillary voltage was set at 3500 volts with fragmentor at 100, skimmer at 45 and octopole RF 500 volts. Prior to sample runs, the instrument was calibrated using Agilent low mass calibrant solution.
Data analysis
The data collected in Agilent LC-MS and GC-MS was converted from .d format to .mzml format using online software tool MSConvert available from Proteowizard. The .d files were converted using standard parameters for peak picking at MS level 1 (vendor specific) with write index and TPP compatibility enabled. Data converted using the MSConvert were uploaded onto online metabolomics data analysis program XCMS online from Scripps, La Jolla (https://xcmsonline.scripps.edu). The data was uploaded as three groups representing each preparation [22].
Untargeted metabolomics of three different pharmaceutical preparation of Eclipta prostrata L. was performed. Figure 1 shows representative chromatograms of all three samples through standard reverse phase column and gradient. Preliminary visualization of the Base Peak Chromatogram (BPC) demonstrates there are clear differences between the three preparations. The GC-MS chromatograms in Figure 2 indicate the same. Although there are few peaks that are shown to be present in all three samples, it is clear that the groups of molecules present in the three preparation are different in their occurrence and abundance.
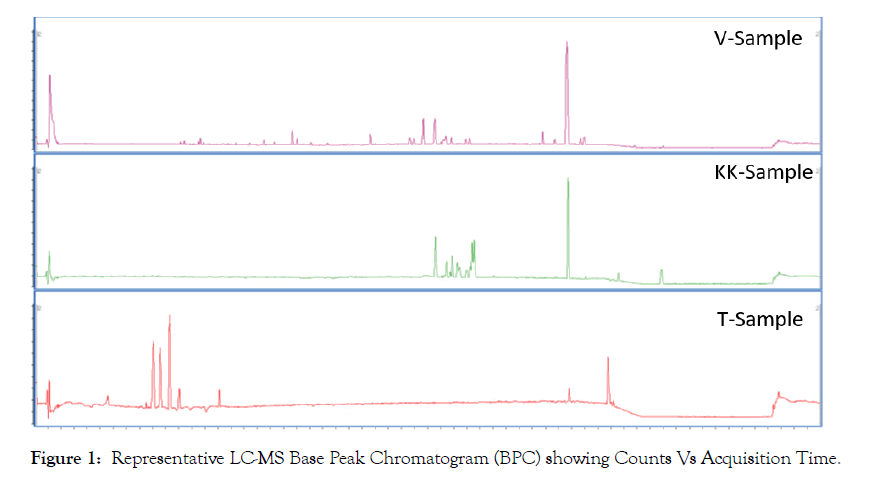
Figure 1: Representative LC-MS Base Peak Chromatogram (BPC) showing Counts Vs Acquisition Time.
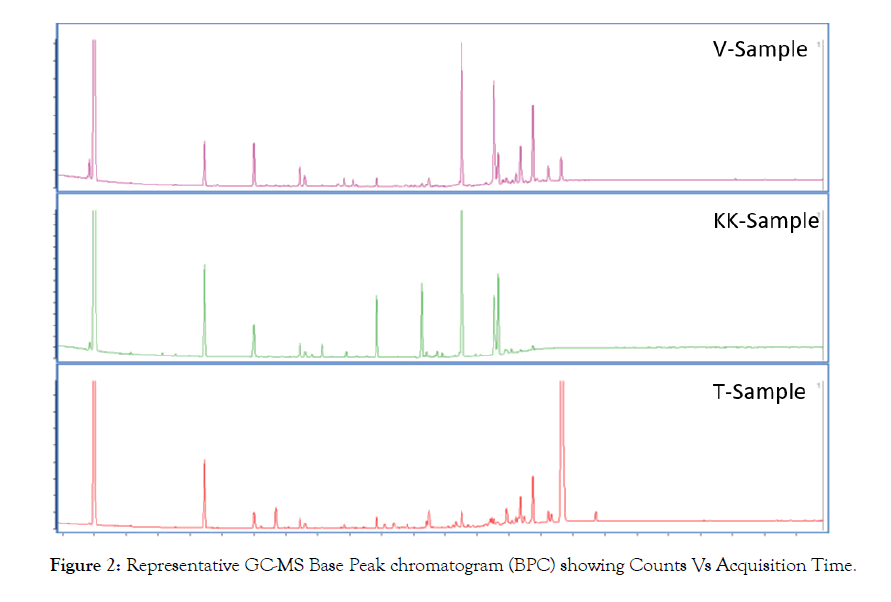
Figure 2: Representative GC-MS Base Peak chromatogram (BPC) showing Counts Vs Acquisition Time.
To explore the data further, results obtained from XCMS analysis as tabulated format of m/z vs intensity of the samples was uploaded to www.metaboanalyst.ca and statistical analysis was performed. The data uploaded to metaboanalyst platform was preprocessed using the pipeline provided. M/z values that were missing in more than 50% of samples were replaced using standard KNN algorithm Samples with RSDs greater than 25% were removed using Interquantile filteration (IQR). Principal Component Analysis (PCA) plots, Partial least Squares-Discriminate Analysis (PLS-DA) plots and heat maps were generated [23-25]. Figure 3 shows PCA plot-3A and PLSDA plot-3B of LC-MS data of three groups of samples KK, TC and V. Both principal component as well as partial least squares can clearly show the grouping of the samples. Figure 4 shows the heat map generated of all the features as well as the top 25 features from LC-MS analysis ranked by t-test showing the contrasting pattern among the samples. There are a total of 10400 features obtained through LC-MS analysis. To the data obtained using GC-MS analysis, similar workflow was adapted. Figure 5 shows PCA and PLSDA plots obtained for GC-MS data.
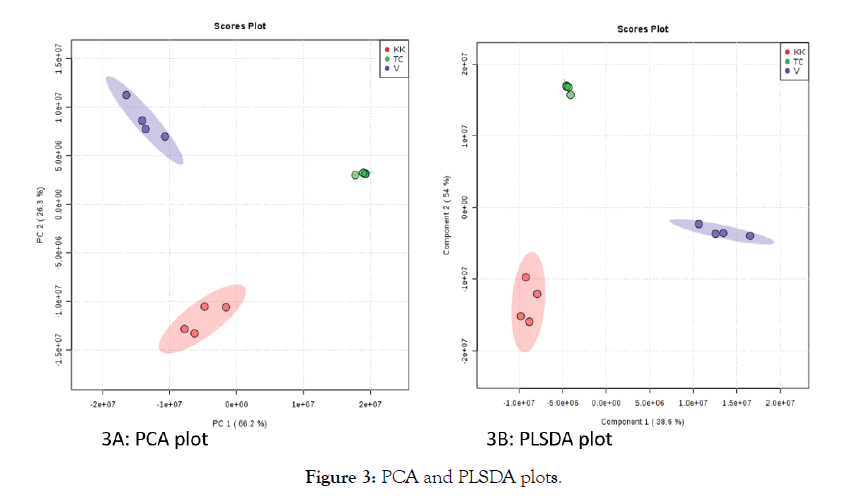
Figure 3: PCA and PLSDA plots.
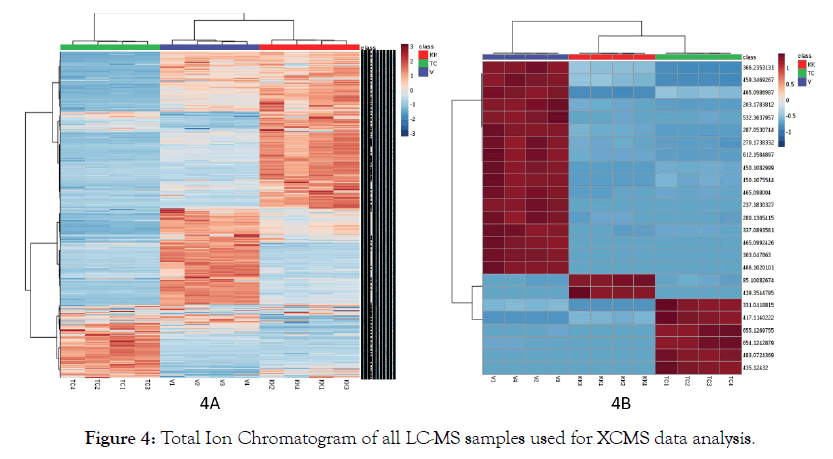
Figure 4: Total Ion Chromatogram of all LC-MS samples used for XCMS data analysis.
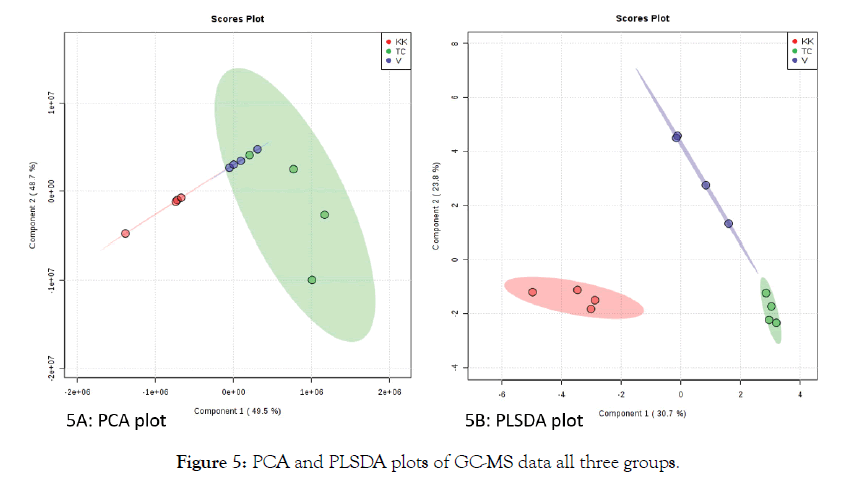
Figure 5: PCA and PLSDA plots of GC-MS data all three groups.
Principal Component Analysis has been successfully applied to LC-MS and GC MS data sets. From the preliminary look at the principal component analysis, unlike the LC-MS dataset, the GC-MS data did not show a clear separation of the three groups. The partial least squares analysis showed an appreciable separation between the groups. Comparing the heat maps of LC-MS data, (Figure 4) and GC-MS data, (Figure 6), it is also clear that the heat map of all the features shows a good contrast in LC-MS compared to GC-MS dataset. This could be due to the inherent nature of the techniques and the size of the datasets. We conducted the LC-MS analysis only in the positive mode to demonstrate the potential of untargeted analysis combined with principal component analysis.
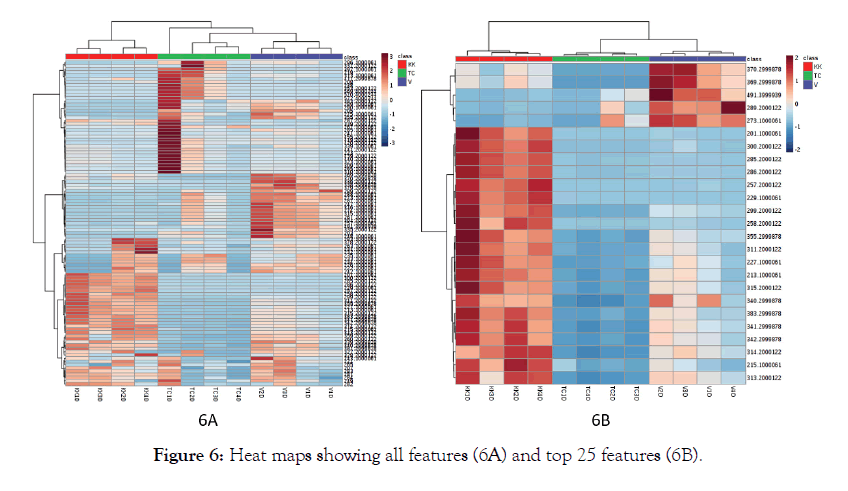
Figure 6: Heat maps showing all features (6A) and top 25 features (6B).
Incorporating negative mode enables other classes of compounds such as some simple phenols, and non-aromatic organic acids providing additional information. In positive mode, there is still a wide range of compounds such as alkaloids, terpenoids, stilbenes, flavonoids, amino acids, vitamin derivatives can be detected. As most of the reported active compounds in natural product based medicine falls under theses category, for initial analysis positive mode was sufficient. PCA is an unsupervised technique, in the PCA plots of GC-MS data, the separation between the groups is more clear whereas the LC-MS data set did not show a clear separation of the groups. It could also be due to the fact that the number of features in GC-MS data sets are far less than LC-MS data sets. In any data sets such as metabolomics or proteomics, there is always hidden information that helps to understand the subtle differences between them. To understand those differences, one needs to perform supervised analysis such as Partial Least Squares- Discriminate Analysis (PLS-DA). Figures 3B and 5B shows the PLS-DA plots of GC-MS and LC-MS datasets respectively. While in the PCA plot of LC-MS data of the three groups, the separation of the groups is not clear, in other words there is a partial overlap between the groups, the PLS-DA plot shows a clear separation between the groups. The ellipsoids are generated in the software with 95% confidence interval [12]. The above results clearly indicate that the combination of untargeted metabolomics data with suitable data analysis pipeline enables quick visualization of the quality of the natural product and global small molecule profile.
By using three different preparations of Eclipta prostrata L. we have demonstrated that a LC-MS and GC-MS based untargeted metabolomics approach can distinguish the three preparations and the small molecule landscape in those preparations. Metabolomics is a growing field and there is an increasing number of small molecule libraries are becoming available. As more and more plant-based molecules are secondary metabolites are being characterized using LC-MS and GC-MS approach, suitable methods need to be developed for testing and ensuring the quality of these alternative medicines.
Funding for Proteomics, Metabolomics and Mass Spectrometry Facility used in this publication was made possible in part by the MJ Murdock Charitable Trust and the National Institute of General Medical Sciences of the National Institutes of Health under Award Number P20GM103474. The content is solely the responsibility of the authors and does not necessarily represent the official views of the National Institutes of Health.
The authors declare that they have no conflicts of interest related to the contents of this article.
Citation: Thomas JM, Balasubramanian N (2019) Metabolic Profiling of Eclipta prostrata L.: Potentials of Untargeted Metabolomics in Traditional Medicine. J Appl Pharm 11: 269; doi: 10.35248/1920-4159.19.11.269
Received: 02-May-2019 Accepted: 16-May-2019 Published: 28-May-2019
Copyright: © 2019 Thomas JM, et al. This is an open-access article distributed under the terms of the Creative Commons Attribution License, which permits unrestricted use, distribution, and reproduction in any medium, provided the original author and source are credited.