Journal of Geography & Natural Disasters
Open Access
ISSN: 2167-0587
ISSN: 2167-0587
Research Article - (2017) Volume 7, Issue 1
The purpose of this paper is to propose a mathematical index to measure the resilient capability of drought-prone desert communities in Tharparkar, Pakistan. The paper analyses the constructs and definitions of the term resilience, describes the concept and practical applications of the integrated programming approach, present key findings of the integrated vulnerability and capacity assessment at the community level and provides a unique method for measuring disaster resilient communities following the process and output indicators. Ten process and eight outcome standards with 50 and 94 resilience indicators respectively were applied to measure the resilience capability of the community. The overall resilience index of the community was 51%. The overall process value of the community was 56% whereas the outcome value was 45%. This method of resilience measurement can be used for comparing the resilience status of the communities, progress monitoring and impact evaluation of any disaster risk reduction and resilience building interventions. The research findings provide a unique method for measuring community resilience capability in any hazard prone areas. The overall resilience index is site and context specific and should not be loosely used. However, the overall method and the mathematical index can be widely applicable. The tool can be used for baseline survey, progress monitoring and final evaluation of a disaster risk reduction interventions at the community level and final evaluation. The tool is simple, participatory, less time and cost consuming and requires less sophisticated data for the calculation. A wide application of the tool in various hazards and different social-economic and cultural contexts is recommended
Keywords: Community resilience index, Process and outcome indicators, Drought-prone desert, Ecosystem, Pakistan
Commonly associated with the fields of physics, child psychology, ecology and engineering, the term ‘resilience’ has now been widely used in many disciplines in a variety of analytical levels ranging from resilience of individuals, households, communities, affected populations, to institutional, urban and systems resilience [1-3]. “In ecology, resilience has been used in two ways, one focusing on recovery and return time following a disturbance, the other focusing on how much a system can be disturbed and still persist without changing function” [4]. Folke [5] describes three concepts of resilience, ranging from a narrow interpretation (engineering resilience) to a broader social-ecological interpretation of resilience. In the field of disaster management, socialecological resilience seems the most widely supported interpretation of the term [6]. Tuerney [7] describes two fundamental properties of communities: “inherent capacity which is present during non-crisis periods and related inherent vulnerability; and adaptive capacity which is the flexible and coping capacity demonstrated in the aftermath of disasters.” This concept is fundamental while measuring the disaster resilient capacity of communities as the resilient measurement should reflect the overall status of the community at the time of measurement irrespective of the inherent or coping capacities. Furthermore, the resilient is considered as a static concept at the time of measurement.
The understanding of resilience as ‘bounce back capacity’ of a community or system has limited applications in many contexts such as disaster management, complex emergencies and many development and humanitarian actions. Communities do not recover fully from a shock until all of its elements or sub-systems have recovered, which is almost impossible from the socio-ecological or human community perspectives. On the other hand, “how a system behaves is not a function of the sum of its parts so it follows that measuring component parts cannot capture what is meaningful about resilience” [8]. Moreover, Manyena [9] have put forward the concept of “bounce forward” as ‘bounce back’ concept does not take into account the notion of “change” after a disaster event and offers an alternative definition: “the ability to bounce forward following a disaster,” which could also be described as “positive transformation” of a community, or system [10].
The meaning of resilience is centred on the crisis- type of disruption (disaster due to natural hazards, pandemic, major economic contraction) and magnitude of the disruption. In that sense, resilience is a set of short-term actions, and focuses on short-term recovery issues rather than on root causes of risk and vulnerability [11-14]. Jutersonke and Kaartas argue that “it is realistic to measure resilience from the new perspective: the resilience thinking shifts the focus from deficits to strengths: from what is wrong or amiss, to what is strong and robust about a body or system”. Resilience is therefore best measured in terms of processes the community follows and outcomes it achieves [15].
The term community is considered as a unit that consists of people, property, services, livelihoods and environment; a legally constituted administrative local government unit of a country, e.g. villages or municipality. Kwasinski [16] defines community as a place designated by geographical boundaries that functions under the jurisdiction of a governance structure, such as a town, city, or country. IFRC defines community as “a group of people who may or may not live within the same area, village or neighborhood, share a similar culture, habits and resources. Communities are groups of people also exposed to the same threats and risks such as disease, political and economic issues and natural disasters.” This paper adopts a simple definition of community as a group of people who live in a certain geographic area and share similar culture, values, resources, and risks.
A number of researchers have proposed resilience measurement frameworks and metrics and indices across disciplines [17-30]. The Resilience team [31], in disaster and natural resources management, a few assessment tools and metrics have been developed with a focus on assessing overall resilience status of the communities. The most commonly used method for the community resilience measurement is the sustainable livelihoods framework. However, the biggest challenge of this method is the lack of availability of data at the local level, the expert-led analysis and interpretation in the local context and its practical usage. The process and outcome based approach developed by Kafle distinguishes explicitly between outcome and process indicators and is simple to collect and analyse data, participatory in nature, and can be used for various purposes including progress monitoring, baseline survey, final evaluation of community based disaster risk reduction interventions, and comparing communities in the resilience status.
Within this conceptual framework, this paper tests the following hypotheses:
1. The process and outcome indicators can be applied in measuring resilience capability of drought-prone desert communities.
2. The outcome of the resilience measurement will demonstrate the bounce back or bounce forward ability of a community or system after a disaster event.
The following sections describe the concept of integrated programming, which introduced a number of interventions to the study area in order to build the resilient capacity of communities. The sections also describe the study area, methodology and the findings of the integrated vulnerability and capacity assessments
The Pakistan context
Pakistan ranks 3rd highest in the multiple mortality risk index (MMRI) after Bangladesh and India in the South Asia region [32]. A range of hydro-meteorological and geo-physical hazards including avalanches, cyclones and storms, droughts, floods, glacial lake outburst floods (GLOF), earthquakes, landslides, tsunamis and disease epidemic pose risks to Pakistani society. Climate Change threatens to alter monsoon and rainfall patterns further and is predicted to lead to more severe and less predictable flooding and drought episodes. Both the 2005 earthquake and the 2010 and 2011 floods have revealed the vulnerability of Pakistani society and economy to disasters. Damages and losses have been massive but could have been largely reduced if disaster risk reduction measures had been incorporated into physical, social and economic development.
Drought is one of the major natural hazards in Pakistan. Almost all part of the country suffers from drought every two to three years. However, the frequency of occurrence and severity of its impacts are exacerbated by anthropogenic activities such as deforestation, urbanization, faulty land use planning. With continuing climatic changes, El Nino and urbanization and depletion of natural resources, the occurrence and impact of drought events are in the rise. This phenomenon will certainly lead to further desertification, displacement of communities and widening gaps between the poor and the rich.
Droughts are a normal part of the climate and can occur in desert or any other ecosystems [33]. However, they are considered serious killer hazards as they destroy agriculture, livelihoods and ecosystem in a slow race. Droughts originates form a deficiency of precipitation over an extended period of time, usually a season or more, and are characterised by severity, location, duration and timing of occurrence. The Thar Desert of Eastern Pakistan and Western India is of relatively recent formation [34]. Annual precipitation in this desert is less than 400 mm. But the extreme seasonality of rainfall (most of the annual rainfall occurring within couple of rainy season months) and livestock density far greater than the land can support, have made the desert condition very harsh. The forests in this area comprise bushy thorny plants such as Acacia nilotica, Prosopis cineraria, Salvadora oleoides and Tecomella spp. Almost all part of the country suffers from drought every two to three years. However, the frequency of occurrence and severity of its impacts are exacerbated by anthropogenic activities such as deforestation, urbanization, faulty land use planning. Pakistan Red Crescent as an auxiliary to the Government of Pakistan has initiated an integrated program to tackle the drought in the desert areas of the country.
Study area description
The study was carried out in two desert communities of Tharparkar district, namely Karihar and Lunihar. Both communities were considered as one unit for the purpose of data analysis as the socio-ecological contexts were similar. The total population of the communities was 5,200 (826 HH), of which around 25% households were involved in the risk assessment and implementation of the project activities. In order to implement ICBRR program, a community-based risk reduction committee was formed, trained, and was mobilised for conducting the integrated vulnerability and capacity assessment and implementing risk reduction activities such as community trainings, awareness raising campaigns, small-scale mitigation and school safety plans.
With little over 250 mm of annual rainfall, limited irrigation and no civic infrastructure, the communities are restricted to groundwater to meet basic water consumption needs. Village households must collect water from wells situated at a distance of at least 3 km. to meet their daily needs during dry season. Not only is the water source inaccessible, the painstaking daily exercise of pulling out water manually from depth of 250-300 meters takes a toll on the physical and mental wellbeing of those affected, resulting in high levels of hardship, diversion from normal routine activities and risk to life for the local community.
An integrated vulnerability and capacity assessment (IVCA) was carried out following the standard vulnerability and capacity assessment (VCA) toolkit [35,36] and community based first aid and health (CBHFA) approaches [37]. The IVCA findings suggest that severe recurrent droughts, scarcity of water for human and livestock, desert ecosystem, spread of diseases due to lack of potable water and hygiene are among the key hazards in the locality. Both the people and livestock were prone to water shortages and health hazards. The following were the key vulnerabilities and their underlying causes in the communities:
• No drinking water for both people and livestock,
• Increase of health diseases, children under malnutrition,
• No health and hygiene education,
• High drop-out rate in schools,
• Low production of livestock due to lack of drinking water and diseases.
• Limited livelihood options, and psychosocial issues.
These all have led to extreme poverty and vulnerability of the populace in the communities.
Reduction of disaster risks has been complicated in Tharparkar communities due to tragic cycle of poverty and vulnerabilities. The communities are mostly consisted of sand ridges and arid zone, where only 5% of people reside in urban areas and the rest live in rural setups. The main sources of income in the study area are arid agriculture, livestock rearing and daily wage labour. Dragging out underground water is one of the main issues that the community is facing. On an average, 3 members from a house hold spend three to five hours to fetch water for human consumption and watering animals.
The vulnerability progression model (Figure 1) shows that the following are the key impacts of drought in the community:

Figure 1: Vulnerability progression of drought hazard in the study area (Concept adapted from Blaike et al.)
• Food shortage
• Forest fire
• Low rain, delayed rain
• Deforestation
• Low water in reservoirs
• Shrinking grazing lands
• River ecosystems
• Terrestrial ecosystems
The integrated approach to community resilience
Pakistan Red Crescent (PRC) with support from International Federation of Red Cross and Red Crescent Societies (IFRC) has adopted the comprehensive and holistic approach called Integrated Community Based Risk Reduction (ICBRR) involving organisational development, health and disaster risk reduction in order to reduce risks and strengthen capacities of the targeted communities to make them resilient to future disasters. ICBRR can play a major role in building safer and more resilient communities. The model of ICBRR programme is more appropriate in promoting community ownership and sustainability. The approach aims at building community resilience through strengthening community based organisations and mobilising them to address underlying causes of vulnerabilities thereby reducing disaster losses. Studies have shown that at the community level the ICBRR approach [38]:
• Addresses all hazards, vulnerabilities and risks.
• Considers all the phases of the disaster management cycle (prevention/mitigation, response and recovery).
• Includes all stakeholders of many sectors and levels in the process.
• Takes into account the principles of sustainability (environmentally sound, considers societal preferences and costeffective; sustainable use of natural resources and sustainable development and therefore a cross-cutting issue).
• Builds the organizational capacity of the vulnerable social groups through the formation of community organizations for disaster risk reduction.
• Follows a participatory process for risk identification, risk analysis planning, implementation and monitoring and evaluation of activities.
Integration is a holistic approach to all phases of a project i.e. project design, implementation and monitoring and evaluation. Integration is not a merging of two or more sectors or disciplines, it is an approach working together using common tools, joint planning, implementing, monitoring and evaluation and sharing of resources. Many individuals in organizations regard integration as closeness to the merging and foresee their roles and responsibilities decreasing (DRC), and ultimately their identity might be lost. This might be related to exercises of power within the organization. This is partly true that the fully integrated approach might exercise the democratic processes and the decision-making in this approach largely requires a shared approach rather than a traditional one-man/single-handedly decision making practices. The integrated model of risk reduction is multi-sectoral, cost effective, impact-oriented, owned by local partners and therefore sustainable, and avoids duplication of efforts.
The section 3 describes the the process cum outcome based model adopted in the study area in more details.
A number of community resilience tools and indices have been developed over the past decade [39,40]. This study is based on the premise that both the process and outcome indicators are essential in determining community capabilities towards resilience. The resilience determinants identified in this study is built upon the resilience index of the ICBRR model. The index gives the community level resilience capabilities. The approach followed in this study is similar; however, the indicators for the processes and outcomes were based on the ICBRR program model adopted by PRC/IFRC in Pakistan with modifications in this study. The process cum outcome based model was preferred over other approaches for this study due to the following reasons;
- Other indices require a set of comprehensive data which is commonly not available in many of the developing countries.
- The index measures the overall resilience status irrespective of underlying factors of community resilience.
- Considers both the process and outcome indicators as equally important where process indicators reflect the ownership and sustainability aspects and outcome indicators provides the real achievement in terms of resilience capability. The combination of both the indicators are important for the quality measurement of the overall index,
- The measure can be used before, during and after a disaster risk reduction and resilience building intervention,
- It is a low cost, less time-consuming, and requires less technical expertise in gathering the information,
- Both the process and outcome indicators may vary by type of intervention or location. This can be easily adopted in the index. However, the different weights should be assigned based on the local context.
Process indicators
A five-step model of ICBRR program was the basis for identifying the process indicators (Figure 2). The input-output model shows the 5 phases of the program, key interventions and the outcomes which the interventions contribute to achieve it. The assumption in this model is that the degree of the achievement of the outcomes reflects the resilience capability of the community. The interventions were divided into 10 key phases of ICBRR program, which were considered as process indicators (Table 1).

Figure 2: A conceptual input-output model of ICBRR program.
| Characteristics | Indicators |
|---|---|
| Communities have capacity to identify their key hazards, vulnerabilities and risks and coping mechanism and their own capacities to take appropriate measures in order to reduce them is organized |
|
| Communities are healthy |
|
| Communities are organised and there is cohesiveness among comment members. Community members should feel physically and psychologically safe and secure. |
|
| Communities have a robust infrastructure and access to the services they need |
|
| Communities have socio-economic opportunities and stability through a secure income basis. |
|
| Communities are able to protect their natural assets to multiply them and to manage them in a sustainable way. |
|
| Communities are connected |
|
| Communities and their needs are recognised by the political establishment and administration and are involved in local planning. |
|
Source: IFRC, 2014; revised in this study.
Table 1: Characteristics of a disaster resilient community and their indicators used in the measuring resilience capability in the study.
Outcome indicators
This study has adopted a set of outcome indicators of the ICBRR program as recommended by an IFRC study (2014). The following 8 characteristics of a resilient community have been elaborated with indicators in this study:Communities have capacity to identify their key hazards, vulnerabilities and risks and coping mechanism and their own capacities to take appropriate measures in order to reduce them is organized:
• Communities are healthy.
• Communities are organised and there is cohesiveness among comment members. Community members should feel physically and psychologically safe and secure.
• Communities have a robust infrastructure and access to the services they need.
• Communities are able to protect their natural assets to multiply them and to manage them in a sustainable way.
• Communities have socio-economic opportunities and stability through a secure income basis.
• Communities are connected.
• Communities and their needs are recognised by the political establishment and administration and are involved in local planning.
The conceptual framework developed by Kafle to measure disaster resilient communities using process and outcome indicators was used in this study. However, the indicators for this study were derived from the ICBRR program proposal and the key characteristics of a resilient community as proposed by IFRC (2014). For the assessment of process indicators, the 10 steps (5 phases) of the ICBRR were weighted ‘W’ (i=1 to 5) based on their importance in the overall risk reduction. For the value of each step a rank ‘R’ (j=0 to 5) was assigned to each based on its status of achievement. The values and weights were given by the author based on their relative importance and his experience while designing and implementing the programme. The weight and scores for the values were verified and adjusted in consultation with the community members and was pre-tested. The five-point scores given for value are expected to minimise the personal error of the evaluator. Weight (rank) was given to the process indicators as per their importance in the overall disaster risk reduction; whereas their corresponding values were given based on the completion of the task, quality in terms of participation of stakeholders, clarity of the process to the stakeholders and the level of outputs.
The outcome indicators were taken from IFRC and were revised in this study to accommodate the drought-prone desert ecosystem contexts. Key resilience elements of the desert ecosystem were identified as follows:
1. Water scarcity
2. Human health
3. Livestock health
4. Health awareness
5. Disaster awareness
6. Leadership/unity in the community
7. Connectedness/linkage development
8. Soil fertility/productivity
9. Improved agriculture practices
10. Adaptation to climate change
11. Livelihoods diversity
12. Early warning systems
13. Preparedness and response capacities
For the value of each step (standard) a rank “R” (j=0 to 5) was assigned to each based on its status of achievement.
 (1)
(1)
Similarly, outcome indicators were identified based on the programme proposal, UNISDR [41], Kafle, ADPC and Twigg [42].
For the calculation of the outcome index, ranking and values were given in a similar way to that of process standards.
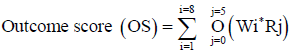 (2)
(2)
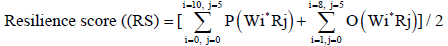
Hence, overall resilience score can be calculated by summing up both the process and outcome scores:
Resilience score (RS)=(PS+OS)/2 (3)
The average of two scores was taken as the index is based on the premise that both the process and outcome indicators are equally important for resilience capacity building. “The combination of both sets of indicators is an impetus to the quality change in the community. Process indicators are important for community understanding, ownership and the sustainability of program; whereas outcome indicators are important the real achievements in terms of community empowerment and capacity building. As many of the community based interventions are process-oriented, it is assumed here that the outputs are inevitable if the proper processes are followed. However, process indicators and outcome indicators may vary by location; organisation and their corresponding weights should be changed accordingly. In a different case where researchers and practitioners believe that the ratio between process and outcome indicators is not equal, the index can be changed accordingly [43-45].
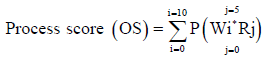
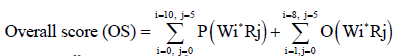
The measurement of community resiliency was done using the following index:
Where, OS=Overall score expressed in percentage
P=process indicators ranging from 1 to 10
O=Outcome indicators ranging from 1 to 8
Wi=Weight of process and outcome indicators i
Rj=Rank or value of process and outcome indicators j
Altogether 10 process and 8 outcome standards were identified in order to measure the level of community resilience.
The measurement of community resiliency was done using the following index:
OS=Overall score expressed in percentage
P=Process indicators ranging from 1 to 10
O=Outcome indicators ranging from 1 to 8
Wi=Weight of process and outcome indicators i
Rj=Rank or value of process and outcome indicators j
Fifty process and 94 outcome indicators were identified for 10 process and 8 outcome standards respectively. The overall index value of both the process and outcome standards was measured as 51%, whereas the process and outcome indicator values were 56% and 45% respectively [46]. The results show that the overall value of process standards was higher than the outcome standards (Tables 2 and 3). In order to minimize the personal bias, the weights were divided into 5 levels, 1 being the lowest and 5 being the highest scores of achievement.
| Process standards (steps) | Weight (Rank) of standards | Value (1-5; 1 being the least preferred and 5 ideal condition) | Total score |
|---|---|---|---|
| (Wi) | (Rj) | (Wi*Rj) | |
| 1. Area selection, Pre-IVCA, comprehensive assessment, formation of working group | 2 | 3 | 6 (10) |
| 2. Baseline survey/KAP | 1 | 3 | 3 (5) |
| 3. Rapport building, social capital building, Form village committees and CBOs | 7 | 3 | 21 (35) |
| 4. Community mobilization CBOs, community members | 5 | 3 | 15 (25) |
| 5. Risk assessment (IVCA) | 10 | 4 | 40 (50) |
| 6. Risk reduction planning | 9 | 3 | 27 (45) |
| 7. Advocacy/Socialisation | 4 | 2 | 8 (20) |
| 8. Awareness raising/training | 8 | 2 | 16 (40) |
| 9. Mitigation activities | 6 | 2 | 12 (30) |
| 10.Participatory monitoring and evaluation | 3 | 2 | 6 (15) |
| 154 (275) (56% of the maximum attainable score) |
Table 2: Process indicators.
| Key characteristics | Priority/Rank (2) Weight (Wi) |
Value (Ri) (1-5; 1 being the least preferred and 5 ideal condition) |
Total score (Wi*Ri) |
% |
|---|---|---|---|---|
| 1. Communities have capacity to identify their key hazards, vulnerabilities and risks and coping mechanism and their own capacities to take appropriate measures in order to reduce them | 8 | 8*2=16 | 16 (40) | 40 |
| 2. Communities are healthy | 7 | 7*1.5=10.5 | 10.5 (35) | 30 |
| 3. Communities are organised and there is cohesiveness among comment members. Community members should feel physically and psychologically safe and secure. | 6 | 6*2=12 | 12 (30) | 40 |
| 4. Communities have a robust infrastructure and access to the services they need. | 5 | 5*2=10 | 10 (25) | 40 |
| 5. Communities have socio-economic opportunities and stability through a secure income basis. | 4 | 4*1.5=6 | 6 (20) | 30 |
| 6. Communities are able to protect their natural assets to multiply them and to manage them in a sustainable way. | 1 | 1*2=2 | 2 (5) | 40 |
| 7. Community is connected | 2 | 2*2=4 | 4 (10) | 40 |
| 8. Communities and their needs are recognised by the political establishment and administration and are involved in local planning. | 3 | 3*2.5=9 | 7.5 (15) | 50 |
| 68 | 67.5 (151) | 45 |
Table 3: Outcome indicators.
The values provide an overall reflection of the resilience of the communities at the time of assessment and potential ‘bounce back’ ability of the communities in time of disasters. The resilience scores are valid for multi-hazards including droughts, however, the application of the resilient scores are more precise if it is hazard and location specific [47,48].
The overall score 51% should not be loosely used and generalised. The score is contextual, and values mentioned in Tables 2 and 3 are program and location-specific. However, this can be used for comparing the status of any programs and measuring the outcomes in line with building disaster resilient communities. Both the process and outcome indicators are equally important for the contribution to building disaster resilient communities. Process indicators are important for the community understanding, ownership and sustainability of the Program; whereas outcome indicators are important for the real achievements in terms of community empowerment and capacity building.
Ranking of the steps was done on a consensus basis in a group discussion of Program staff from both IFRC and PRC. The figures in parentheses indicate the maximum attainable score. Weight (rank) was given to the process standard as per their importance in the overall disaster risk reduction; whereas their corresponding values were given based on the completion of the task, quality in terms of participation of stakeholders, clarity of the process to the stakeholders and the level of outputs. Some indicators were added in this study in order to incorporate the resilient elements of the desert ecosystem.
By following the ten processes, the community members were able to participate in the community level disaster risk reduction activities such as group formation and strengthening, vulnerability and capacity assessment, community mitigation planning, implementation of the plans and monitoring and evaluation. It helped them understand the disaster risks in their communities, adopt the method to mitigate risks, own the interventions and sustain them. It also helped build their capacities in identification, treatment, analysis and mitigating risk of impending disasters.
The outcome of the resilience measurement reflects the real achievements in terms of community empowerment and capacity building. The resilience measure is the combination of both the community understanding of the entire processes and the outcomes in terms of the overall achievement of the community in terms of the risk knowledge, their health, connectedness, resource management capacity, local infrastructure and secures economy and economic opportunities in the community.
The combination of both the process and outcome measures helps capture the underlying causes of vulnerabilities, sub-systems of the community and enhance community capabilities towards bounce forward as the process and outcome indicators consist of elements of positive transformation.
In order to monitor local hazards, identify risks and mitigate them a link between community members and subject matter experts from relevant scientific institutions should be in place. A good combination of the scientific knowledge and the indigenous knowledge is required for the drought risk mitigation and building community resilience capabilities.
The Tharparkar communities are not resilient enough to mitigate future disaster impacts and bounce back rapidly from drought hazards. The key vulnerabilities of the communities include lack of institutional capacity for hazard monitoring and prediction, weak linkages to scientific institutions for hydro-meteorological data, inadequate resource mobilization and action planning for drought risk mitigation. Formulation of drought risk reduction polices and hazard and vulnerability assessment and mitigation plans with the provisions of drought risk awareness, early warning system and effective action planning and community managed implementation are suggested in order to reduce the future drought impact in the drought-prone areas.
The concept of a disaster-resilient community can best be described by the processes the community follows, and the outcomes it achieves. The process of the ICBRR approach varies by country and location as per the level of community awareness and organisational strategy, and can therefore be modified accordingly. However, core elements such as the formation of community groups, mobilising those groups in risk assessment and community risk reduction planning should be present in all the countries or locations. The ICBRR program was aimed at increasing community resilience through enhancing disaster preparedness and response capacities of PRC. A close link between CBOs, local government and PRC Branch with the support from provincial branch is necessary for sustaining the outcomes of the program. A three year time frame is not enough for the establishment and strengthening of CBOs following all the steps of ICBRR. An ICBRR approach has huge potential in empowering communities to understand their location specific hazards, vulnerability and future disaster risk. CBOs are increasingly becoming the backbone of the PRC system at the community level. Institutionalising CBOs could be the next step in making communities more resilient to future disaster risk.
Based on the study the following hypotheses can be accepted:
1. The process and outcome indicators can be applied in measuring resilience capability of drought-prone desert communities.
2. The outcome of the resilience measurement will demonstrate the bounce back or bounce forward ability of a community or system after a disaster event.
This tool can be used to measure community resilience as an outcome of a community-based DRR intervention. This can be used for baseline survey, progress monitoring of the Community Based Disaster Risk Reduction (CBDRR) programme, and benchmarking for programme evaluation. The core components of this tool are process and outcome indicators. The tool has been developed with an assumption that both the process and outcome indicators are equally important in building disaster-resilient communities. The combination of both standards is an impetus to the quality change in the community resilience. In order to increase the resilience level, focus should be given to both the process and outcome indicators and disaster risk reduction intervention should aim to increase the performance from the beginning of any intervention.
Although the resilience index was applied in a drought prone desert communities, it can be applied in any social-economic, cultural and geographical settings. However, the process and outcome indicators can be slightly changed based on the local situation and program interventions. The tool can be used in a participatory way together with the community members, program staff or subject matter specialists. It will also save a huge amount of time and monetary resources for baseline survey and application of other monitoring and reporting systems. This also avoids the error incurred due to inadequate data required assessing and measuring community resilience.
Further researches on the timing of bounce back capacity, relation between DRR interventions towards addressing underlying causes of vulnerability and increase in the resilience scores and interactions among resilience elements are suggested in order to prioritize the elements and their impacts on overall resilience level of the communities. A wide application of the tool in various hazards and different social-economic and cultural contexts is recommended.