Journal of Physical Chemistry & Biophysics
Open Access
ISSN: 2161-0398
ISSN: 2161-0398
Research - (2024)Volume 14, Issue 1
This paper described a crystallization procedure of the “1-Octadecanol/n-Nonadecane” binary system, an accurate description of the phase change process and the associated analysis of the cooling and melting of this binary system between 20°C and 70°C. The introduction section mainly describes the scientific background and principle of plant cuticle wax layer and the former studies on the crystallization of n-Alkanes and n-Alkanols. The experiment part introduces the experimental chemicals, instruments and specific experimental operating procedures required for the preparation of the “1-Octadecanol/n-Nonadecane” binary system. In the following sections, the thermal properties of this binary system are studied. According to the DSC diagram, phase diagrams and absorption spectrum, the specific phase transition and enthalpy of each phase transition were studied. The cooling and heating phase diagrams were plotted. The influence of the different compositions of these two chemicals was analyzed and discussed. The last part is the conclusion of this thesis, which summarizes the experimental research results of the complete text and points out the needed further research.
Alkane; Alkanol; Crystallization; Binary system; Phase transition; Plant; Hydrocarbons
Research backgrounds
Agriculture is one of the most important primary industries in the world today and a vital prerequisite for supporting the most basic livelihoods in all countries and regions. In almost all plants with large leaves (non-coniferous species), the leaves are one of most indispensable parts of the plants [1]. We know that leaves contain chloroplasts, which absorb sunlight for photosynthesis and provide energy for the plant, and cuticles, which regulate the internal and external osmotic pressure and keep the water in the leaves at a healthy level.
According to current research, there is no direct link between plant cuticle wax and osmosis, and this paper is an attempt to establish the relationship between the two; abiotic stresses are also one of the critical issues for plants to survive long terms, such as heat, drought, metals, cold, salt and flooding [2]. How plants survive such abiotic stresses is not yet clear [3]. At the same time, improving crop yields is a global problem, and many scholars have conducted in-depth research on crop yield improvement through physical, chemical, biological, and geographical aspects. This project’s results will significantly help improve crop performance, for example, this project’s results will greatly help improve crop performance, for example, by optimizing plant cuticle waxes through genetic engineering or other means. In addition, the cuticle wax will act as a protective measure for the plant epidermis, blocking growthaiding agrochemicals from being sprayed [4]. The agrochemicals can be designed to work around this protective layer by studying this project. In addition, this is a process of chemically creating a distinct biomimetic plant surface that can be applied to, for example, biology or other disciplines.
Plant cuticle waxes
The transition of land plants from an aquatic to a terrestrial lifestyle was accompanied by the development of a novel structure known as the cuticle [4,5]. This lipophilic layer, composed of cutin and cuticular waxes, had the primary purpose of limiting water loss that was not caused by stomata by acting as a physical barrier between the surface of the plant and the environment outside of the plant [6-8]. Forming a cuticular wall is one of the primary adaptation strategies that allow plants to survive and thrive in water-restricted terrestrial environments [9-11]. The cuticle protects the plant from mechanical rupture or injury, poisonous chemicals, and ultraviolet radiation [8,12,13]. It serves as the primary barrier between the aerial surface of plants and the external environment. The cuticle also plays essential roles in the processes of growth and development, such as avoiding epidermal fusion by establishing appropriate organ borders [5,14], and maintaining phytohormone homeostasis [2,15]. These are only two examples of these roles. It is well known that the cuticle and the components that make up the cuticle perform essential roles as signalling molecules for pathogens that attack plants and the plants themselves [16]. It also plays a significant function in fruits, affecting quality, defense, and shelf life after harvest [5]. In fruits, the cuticle can affect water retention, hardness [8,17], and reactions to both biotic and abiotic stressors.
A covalently connected scaffold of cutin and a variety of wax-like Soluble Cuticular Lipids (SCL) make up the cuticle [5]. In terms of its structure, cutin is composed of covalently cross-linked C16 or C18 oxygenated fatty acids and glycerol [5,8]. Cutin is the structural component of the cuticle that is present in the most incredible abundance. The cuticle waxes operate as a physical barrier to the movement of water or solutes. Intra-cuticular and epi-cuticular waxes are the two unique physical layers formed by the waxes [16]. The waxes are found in two layers. In contrast to epi-cuticular wax, which is included as crystals or films on the surface, the cutin polymer contains lipid droplets. Using an aqueous adhesive, it is possible to physically remove this topmost layer from the surfaces [11]. Many different lipids, including Very Long-Chain Fatty Acids (also known as VLCFA) and their derivatives, come together to form these waxes. Alkanes, wax esters, branched alkanes, primary alcohols, alkenes, secondary alcohols, aldehydes ketones, and unsaturated fatty alcohols make up the majority of VLFCAs’ chemical make-up [2]. Terpenoids and metabolites like sterols and flavonoids are also included in this group of cyclic compounds. With regard to functions and reactions to biotic and abiotic environments, the wax composition varies with crop species [11].
There is much research on plant wax globally, and the understanding of its composition is also more profound. Plant epidermal wax is a mixture of hydrophobic organic substances that appear as a whitish-grey or greenish-grey frost covering the outer layers of epidermal plant cells. Waxes are not unique to plant leaves, but studies on waxes have been mainly focused on plant leaves. The chemical composition of waxes is mixed, and the chemical substances in waxes can be extracted effectively with organic solvents such as trichloromethane (CHCl3). Modern studies primarily rely on Gas Chromatography-Mass Spectrometry (GC-MS) and Nuclear Magnetic Resonance (NMR) techniques to identify wax components, and more than 100 compounds have been identified. The chemical features of waxes mainly include aliphatic compounds and cyclic compounds. Aliphatic compounds include long-chain (larger than C18) and ultra-long-chain (C24-C36) fatty acids, alkanes, alcohols, aldehydes, ketones and esters, with different odd-even state advantages. Ring compounds contain phenols, terpenoids and flavonoids, and some of them are small molecular secondary metabolites of plants.
According to recent research, the major transpiration barrier is formed by intra-cuticular waxes, and the contribution of the epicuticular waxes as a transpiration barrier varies on the makeup of the cuticle of each species. And also, intra-cuticular wax acts as a transportational barrier [17].
Approaching
The form and content of plant cuticle varies greatly across and within species and includes plate-, needle-, and pillar-shaped wax crystals. This variation is to be anticipated given the diversity of plants, the ecosystems they occupy, and the unique life histories of individual plants [11]. In certain species, the composition of the cuticular wax is known to change with increasing depth, resulting in the formation of layers that may be chemically differentiated [18]. In addition, the cuticle has been demonstrated to have a crucial role in both the development and the pathophysiology of diseases [18-24]. It should not come as a surprise, therefore, that interest in the content, structure, and physiology of cuticles is growing [8,24-26]. A better understanding of the relationship between the structure and the chemical composition of cuticle waxes (and its relation to inter- and intra-chain interactions in mixtures of longchain hydrocarbons) is essential for increasing agricultural yields. This is because it will further our knowledge of how plants regulate water balance and inform the application of nutrition (foliar feeds) and pesticides, which will lead to improved formulation strategies for agrochemicals. Moreover, agriculture yields can be increased by therefore, a knowledge of the inter- and intra-chain interactions in mixtures of long-chain hydrocarbons, in connection to plant cuticular waxes, can give a leading niche to the fulfilment of the protection and future investigations into a more effective cuticular protection component.
This study’s primary goal was to create a model of plant leaf intra-cuticular wax that could be used to calculate the effects of formulations on cuticle stresses. The model should be as straightforward and uncomplicated as is practicable, but it should also retain some essential characteristics of the cuticular membrane that has been removed (such as response to changes in ambient conditions and susceptibility to the use of surfactants and solvents as adjuvants).
Mass calculation
Twenty-one samples were made at the beginning of the experiment. The samples were differenced by 5% each. All the samples were thoroughly mixed to confirm they were in equilibrium. Then crush the sample into powder since all the analysis methods are using fine powder for the analysis.
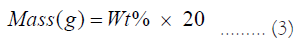
The desired weight size of each sample was around 30-40 milligrams.
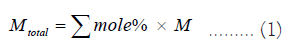
The total molar weight is:
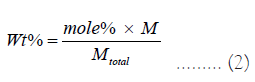
The weight percentage of each chemical is:
The mass of each chemical for making the samples is:
The compositions of samples (mol%) we prepared are listed in Table 1 and Table 2:
| Sample No. | Molar fraction (C18OH/C19) |
n-Nonadecane mass (g) | 1-Octadecanol mass (g) | Total mass (g) |
|---|---|---|---|---|
| 1 | 0 | 0 | 0.03 | 0.03 |
| 2 | 5 | 0.001923 | 0.037107 | 0.03903 |
| 3 | 10 | 0.003846 | 0.035154 | 0.039 |
| 4 | 15 | 0.005769 | 0.033201 | 0.03897 |
| 5 | 20 | 0.007692 | 0.031248 | 0.03894 |
| 6 | 25 | 0.009615 | 0.029295 | 0.03891 |
| 7 | 30 | 0.011538 | 0.027342 | 0.03888 |
| 8 | 35 | 0.013461 | 0.025389 | 0.03885 |
| 9 | 40 | 0.015384 | 0.023436 | 0.03882 |
| 10 | 45 | 0.017307 | 0.021483 | 0.03879 |
| 11 | 50 | 0.01923 | 0.01953 | 0.03876 |
| 12 | 55 | 0.021153 | 0.017577 | 0.03873 |
| 13 | 60 | 0.023076 | 0.015624 | 0.0387 |
| 14 | 65 | 0.024999 | 0.013571 | 0.03857 |
| 15 | 70 | 0.026922 | 0.011718 | 0.03864 |
| 16 | 75 | 0.028845 | 0.009765 | 0.03861 |
| 17 | 80 | 0.030768 | 0.007812 | 0.03858 |
| 18 | 85 | 0.032691 | 0.005859 | 0.03855 |
| 19 | 90 | 0.034614 | 0.003906 | 0.03852 |
| 20 | 95 | 0.036537 | 0.001953 | 0.03849 |
| 21 | 100 | 0.03 | 0 | 0.03 |
Table 1: The Chemicals information of each sample.
| Sample No. | Molar fraction (C18OH/C19) |
Crucible weight (empty)/mg | Crucible weight (full)/mg | Sample weight (mg) |
|---|---|---|---|---|
| Re-1 (1) | 0 | 48.38 | 58.07 | 9.69 |
| Re-1 (11) | 50 | 48.63 | 58.54 | 9.91 |
| Re-1 (21) | 100 | 48.43 | 56.57 | 8.14 |
| Re-2 (1) | 0 | 48.26 | 56.19 | 7.93 |
| Re-2 (11) | 50 | 48.59 | 55.06 | 6.47 |
| Re-2 (21) | 100 | 49.19 | 59.61 | 7.93 |
Table 2: The crucible weight and sample weight for Reproducibility (in crucible).
Data collection and analysis
Differential Scanning Calorimetry (DSC): The Differential Scanning Calorimetry (DSC) instrument was used to investigate the long chain diesters’ thermal properties. These properties included the phase change enthalpy, melting and solidification temperature and total enthalpy. For the purposes of the measurements, the instrument was calibrated using internal standards crucible made of aluminium. The DSC measurements were carried out in an inert N2 environment with a heating-cooling rate of 1°C min-1 throughout a temperature range of 20°C to 70°C. Putting each crucible in the specific place on the pan holder, record the name of each sample, position on the holder, then set the method of this analysis (cooling and heating rate), input the empty weight of crucible which sample in and the weight of reference crucible, in this case, the weight of reference crucible was 49.000 mg. Finally, sent the experiment to the instrument and run it for analysis.
The method of DSC used during this project was a heatwave-type, and the heating and cooling rate for major experiments was 1°C per minute and a 3-time repeat. This step was designed to analyze the fusion and crystallization process of the samples. And using different rate which was 0.75°C and 0.5°C per minute for further analysis.
Using STARe software to analyze the collected DSC diagrams, displaying the onset temperature, end set temperature, and peak temperature, then integrating the peaks, getting the area of each peak, and shading the peak area.
Utilizing Fourier Transform Infrared (FTIR): Utilizing Fourier Transform Infrared (FT-IR) spectroscopy, long-chain diesters were chemically characterized. Between 4000 and 400 cm-1, a NICOLET iS10 produced by thermo-scientific was utilized for the FT-IR analyses. There was a crystal on the surface of the FTIR instrument. An environment diagram was analyzed before the experiment. Then the sample powder covered the crystal completely during the experiment. Then the samples were analyzed by operating the computer, and the diagram of the sample was shown on the screen of the PC.
Using OriginLab® for plotting the Infrared spectra after getting the raw data from the FTIR instrument. Then Analysis the wavenumber of the peaks and get different vibration types of each sample.
RESULTS
This section may be divided by subheadings. It should provide a concise and precise description of the experimental results, their interpretation, as well as the experimental conclusions that can be drawn.
DSC diagrams
Cooling rate at 1°C/min: The cooling Differential Scanning Calorimetry (DSC) diagram for heating and cooling cycle 1, conducted at a rate of 1°C/min, reveals a nuanced profile with a maximum of four peaks and a minimum of two peaks. The dynamic nature of the peaks is closely tied to the evolving composition during the process. Notably, the rightmost peak signifies the crystallization of 1-Octadecanol from the liquid phase into a rotator phase. Following this, the subsequent peak denotes the transition of 1-Octadecanol from the rotator phase to an ordered phase. On the left side of the spectrum, attention is drawn to the two peaks related to n-Nonadecane. The rightward of these depicts the crystallization of n-Nonadecane from the liquid phase into a rotator phase, while the leftward peak marks the transition of the rotator-phase-n-Nonadecane into an ordered phase. The shifting positions of these peaks as the composition undergoes alterations provide valuable insights into the intricate thermodynamic transformations occurring within the substance, offering a comprehensive understanding of its phase transitions and crystallization behaviour during the specified heating and cooling cycle [27] (Figure 1).

Figure 1: Cooling phase diagram at 1°C/min (Cycle 1).
Presented below are comprehensive Differential Scanning Calorimetry (DSC) diagrams recorded at a scan rate of 1 degree Celsius per minute (1°C/min). The upper trio of diagrams illustrates the cooling phase, providing a detailed exploration of the thermal transitions occurring in the material under decreasing temperatures. Conversely, the subsequent set of diagrams captures the heating phase, make clear on the reverse process as the material warms up. This collection of DSC diagrams serves as a meticulous representation of the thermal behaviour, elucidating key transformations and transitions that unfold within the substance across varying temperature ranges. The cooling diagrams offer insights into the solidification and crystallization processes, while the heating diagrams unveil the corresponding melting events and other thermal phenomena, collectively contributing to a comprehensive understanding of the material’s thermal characteristics (Figures 2-4).

Figure 2: (a) Cooling, and (b) Heating phase diagram at 1°C/min (Cycle 1).

Figure 3: (a) Cooling, and (b) Heating phase diagram at 1°C/min (Cycle 2).

Figure 4: (a) Cooling, and (b) Heating phase diagram at 1°C/min (Cycle 3).
The analysis of the thermal behaviour presented in the comparison of the three cycles, each conducted at a constant cooling and heating rate of 1°C per minute, reveals a remarkable consistency. In observing the Specific DSC diagram provided below, the cooling and heating segments are visually distinguishable. The blue portion signifies the cooling procedure of the sample, while the red part corresponds to the heating phase. Notably, despite the dynamic transitions in temperature, the absence of discernible differences in the cooling and heating rates across the three cycles indicates an exceptional level of stability exhibited by the samples.
Delving deeper into the intricacies of the analysis, attention is drawn to the significance of the peaks within the DSC diagram. These peaks encapsulate critical information about the sample’s behaviour during phase transitions. By integrating the area under each peak, we gain valuable insights into the enthalpy associated with each specific phase transition. This approach allows for a nuanced understanding of the energy changes occurring within the sample, providing a comprehensive perspective on its thermal properties. In essence, the specific DSC diagram serves as a visual representation of the stability and thermodynamic characteristics of the material under investigation, elucidating the subtleties of its responses to varying temperature conditions. For instance, the Differential Scanning Calorimetry (DSC) profile of pure 1-Octadecanol, as depicted in Figure 5 using STARe software, was obtained under specific experimental conditions. These conditions included a heating rate of 1°C per minute and a corresponding cooling rate. Within this diagram, the blue segment illustrates the exothermic reaction phase of 1-Octadecanol, whereas the red segment delineates its endothermic reaction phase.

Figure 5: An example of DSC diagram in STARe software. Note: 
Two Tables 3 and 4 of phase transition temperature and enthalpy value of each peak was obtained by concluding all DSC diagram [28,29].
| Cn | Molar mass Mw (g/mol) | Melting point Tm (K) | Enthalpy change per mole ΔHm (kJ/mol) |
Refractive index TR-C (K) |
Enthalpy ΔHR-C (kJ/mol) | Total enthalpy ΔHtotal (kJ/mol) | Reference |
|---|---|---|---|---|---|---|---|
| 18 | 270.49 | 330.3 | - | 328.00 | - | - | Cuevas-Diarte MA, et al. [28] |
| 328.2 | 44.742 | 321.78 | 15.756 | 60.498 | This study | ||
| 19 | 268.52 | 304.9 | 45.580 | 295.5 | 13.750 | 59.330 | Dirand M, et al. [27] |
| 305.1 | 46.047 | 294.5 | 13.801 | 59.848 | Cholakova D, et al. [29] | ||
| 303.6 | 31.417 | 294.2 | 9.134 | 40.551 | This study |
Table 3: Comparison of transition enthalpy between the experimental results and the mean values of the literature.
| Composition (C18OH %) |
Molar mass Mw (g/mol) | Melting point Tm (K) |
Enthalpy change per mole ΔHm (kJ/mol) |
Refractive index TR-γ (K) |
Enthalpy ΔHR-γ (kJ/mol) |
Liquidus temperature TL-RI (K) |
Enthalpy ΔHL-RI (kJ/mol) |
Refractive index TR-Oi (K) |
Enthalpy ΔHR-Oi (kJ/mol) |
Total enthalpy ΔHtotal (kJ/mol) |
|---|---|---|---|---|---|---|---|---|---|---|
| 0 | 268.5200 | 303.60 | 9.134 | - | - | 301.79 | 31.417 | - | - | 40.551 |
| 5 | 268.6185 | 305.02 | 7.211 | - | - | 301.89 | 31.093 | - | - | 38.304 |
| 10 | 268.7170 | 308.33 | 3.727 | - | - | 302.03 | 28.532 | 290.27 | 6.909 | 39.168 |
| 15 | 268.8155 | 316.75 | 4.449 | - | - | 301.71 | 27.107 | 290.18 | 6.804 | 38.36 |
| 20 | 268.9140 | 318.38 | 6.868 | - | - | 301.81 | 26.061 | 290.30 | 6.4619 | 39.391 |
| 25 | 269.0125 | 319.15 | 8.248 | - | - | 301.97 | 24.074 | 290.21 | 5.617 | 37.939 |
| 30 | 269.1110 | 319.62 | 9.368 | - | - | 301.86 | 22.662 | 290.11 | 5.253 | 37.283 |
| 35 | 269.2095 | 321.05 | 11.853 | - | - | 301.91 | 21.542 | 289.87 | 4.937 | 38.332 |
| 40 | 269.3080 | 321.55 | 13.024 | - | - | 301.84 | 21.203 | 289.69 | 4.551 | 38.778 |
| 45 | 269.4065 | 322.61 | 13.899 | - | - | 301.80 | 18.306 | 1289.83 | 3.483 | 35.688 |
| 50 | 269.5050 | 323.3 | 15.669 | 305.48 | 2.647 | 301.87 | 15.402 | 289.98 | 3.339 | 37.057 |
| 55 | 269.6035 | 324.42 | 17.565 | 307.68 | 4.341 | 302.02 | 13.270 | 290.07 | 2.879 | 38.055 |
| 60 | 269.7020 | 325.25 | 18.127 | 309.11 | 5.453 | 302.09 | 11.373 | 289.97 | 2.368 | 37.321 |
| 65 | 269.8005 | 325.62 | 19.431 | 310.47 | 6.904 | 302.07 | 10.279 | 289.78 | 1.983 | 38.597 |
| 70 | 269.8990 | 326.41 | 20.569 | 312.95 | 9.471 | 302.15 | 8.461 | 289.16 | 1.636 | 40.137 |
| 75 | 269.9975 | 326.55 | 19.872 | 313.68 | 9.080 | 302.14 | 5.989 | 289.91 | 1.237 | 36.178 |
| 80 | 270.0960 | 327.27 | 21.454 | 315.56 | 11.590 | 302.11 | 4.303 | - | - | 37.347 |
| 85 | 270.1945 | 328.26 | 21.983 | 317.07 | 13.839 | 302.04 | 3.132 | - | - | 38.954 |
| 90 | 270.2930 | 328.42 | 22.891 | 318.07 | 13.836 | - | - | - | - | 36.727 |
| 95 | 270.3915 | 329.6 | 26.114 | 320.77 | 15.407 | - | - | - | - | 41.521 |
| 100 | 270.4900 | 329.86 | 44.742 | 321.85 | 15.756 | - | - | - | - | 60.498 |
Table 4: Comparison of different compositions between 1-Octadecanol and n-Nonadecane.
Cooling rate at 0.75°C/min and 0.5°C/min: The DSC (Differential Scanning Calorimetry) diagrams depicting various cooling or heating rates for sample No.11 with a composition of 50% n-Nonadecane and 50% 1-Octadecanol are illustrated through Figures 6-8. Notably, the altitude of the peaks exhibited a decreasing trend as the rate of cooling or heating diminished. This phenomenon is attributed to the profound influence of the temperature ramp rate on resolution and sensitivity during sample analysis.

Figure 6: Differential Scanning Calorimetry (DSC) diagram at (a) Cooling, and (b) Heating at different rates (1, 0.75, 0.5°C/min, Cycle 1). Note: Cooling/heating rate (°C/min ), 

Figure 7: Differential Scanning Calorimetry (DSC) diagram at (a) Cooling, and (b) Heating at different rates (1, 0.75, 0.5°C/min, Cycle 2). Note: Cooling/heating rate (°C/min ),

Figure 8: Differential Scanning Calorimetry (DSC) diagram at (a) Cooling, and (b) Heating at different rates (1, 0.75, 0.5°C/min, Cycle 3). Note: Cooling/heating rate (°C/min ),
In general, a faster rate of temperature increases results in lower resolution and higher sensitivity, while a slower rate contributes to higher resolution and lower sensitivity. As the ramp rate escalates, the onset temperature of the melt peak remains relatively stable, but the peak top and end temperatures rise, leading to a broader peak shape. Rapid ramp-up processes tend to induce superimposed thermal effects, causing inadequate separation of individual peaks or melts associated with different phases.
Conversely, during the cooling phase, the rate influences the crystallization behaviour. A swift cooling rate tends to delay crystallization, yet this method proves advantageous in optimizing product processing. Notably, the overall peak shape at varying rates closely resembled the diagram obtained at a consistent rate of 1°C/min. This consistency implies that the sample utilized for diverse rate scanning exhibited stability. Consequently, it can be inferred that all samples share a common stability, contributing to a comprehensive understanding of the thermodynamic behaviour and phase transitions in the tested mixtures.
Reproducibility: The reproducibility of the experiment was an important aspect of our investigation, and rigorous measures were taken to ensure the reliability of the results. To assess this, three separate samples were independently run at 1dCpm, each undergoing two additional repetitions. The obtained data was meticulously analyzed, and the corresponding chromatograms were compared. The resulting chromatograms, as depicted in Figure 9, revealed a striking similarity in both the shape and height of the peaks across all replicates. In fact, the resemblance was so pronounced that the chromatograms appeared almost identical. This remarkable consistency in the patterns observed strongly indicates that the experiment was highly reproducible. The reliable replication of results not only attests to the robustness of our methodology but also instils confidence in the credibility and accuracy of the findings derived from this experimental setup.

Figure 9: Reproducibility Differential Scanning Calorimetry (DSC) diagram (1°C/min) with different compositions; (a) 1-Octadecanol
0%/n-Nonadecane 100%; (b)1-Octadecanol 50%/n-Nonadecane 50%; (c)1-Octadecanol 100%/n-Nonadecane 0%. Note: Cooling/heating rate
(°C/min ),
Phase diagram
Cooling phase diagram: The construction of a binary system phase diagram involved a meticulous analysis of the DSC (Differential Scanning Calorimetry) diagram, where the peak temperatures were systematically summarized. This comprehensive diagram serves as a visual representation of the intricate phase transitions occurring within the constituent materials. Each segment of the binary system is distinctly depicted, allowing for a nuanced understanding of the thermodynamic behaviour.
Upon careful examination of the phase diagram, a significant observation emerges: The absence of any discernible evidence pointing towards eutectic or peritectic reactions. Eutectic reactions typically involve the simultaneous solidification of two or more phases from a liquid, while peritectic reactions entail the transformation of one solid phase into another. The lack of indicators for these reactions in the diagram underscores the stability and unique characteristics of the binary system under consideration.
In essence, the plotted phase diagram not only elucidates the temperature-dependent transitions within the binary system but also provides crucial insights into the absence of specific reactions that might alter its composition or structure. This analytical approach not only enhances our understanding of the thermodynamic behaviour of the materials involved but also contributes to the broader field of materials science by unravelling the intricate interplay of phases within binary systems.
In the thermal journey from elevated temperatures to lower ones, the dynamic transformations of 1-Octadecanol exhibit a sequence of phases. Initially existing in a liquid state, it undergoes a transition to the R’IV phase, characterized by specific structural arrangements. As the temperature further decreases, the 1-Octadecanol experiences another shift in its molecular organization, entering the Monoclinic (γ) phase. This progression signifies the intricate interplay of molecular forces and interactions within the substance as it responds to variations in thermal energy.
Conversely, the phase transitions of n-Nonadecane follow a distinct pathway. Originating as a liquid at higher temperatures, it undergoes a transformative shift to the R’I phase, marked by a distinct structural configuration. Subsequently, as the temperature continues to decrease, n-Nonadecane transitions into the Orthorhombic (β) phase, denoting a specific crystalline arrangement of its molecular constituents. This intricate transitions between liquid and crystalline phases underscores the nuanced behaviour of n-Nonadecane under varying thermal conditions. In essence, these observations emphasize the sensitivity of these substances to temperature variations, unveiling a rich tapestry of phase transitions governed by molecular intricacies.
The blue line in the graph represents the temperature profile of 1-Octadecanol as it transitions from the liquid phase to the R’IV phase under varying ratios of 1-Octadecanol to n-Nonadecane. Concurrently, the green line delineates the temperature trajectory of 1-Octadecanol during its phase transition from R’IV to the Monoclinic (γ) phase. Meanwhile, the red line corresponds to the temperature curve of n-Nonadecane as it shifts from the liquid phase to the R’I phase. Lastly, the orange line illustrates the temperature progression of n-Nonadecane as it undergoes a phase transition from the R’I phase to the Orthorhombic (β) phase.
Overall, due to the phase diagram, from high temperature to low temperature, the phase transitions of 1-Octadecanol are Liquid → R’IV → Monoclinic (γ); [28], on the other hand, the phase transitions of n-Nonadecane are Liquid → R’I → Orthorhombic (β) [27] (Figure 10).

Figure 10: A binary system Phase Diagram of n-Nonadecane and 1-Octadecanol (Cooling) and Phases. Note:  Thermal profile of 1-Octadecanol
from the liquid state to the R’IV phase, observed across varied proportions of 1-Octadecanol to n-Nonadecane,
Thermal profile of 1-Octadecanol
from the liquid state to the R’IV phase, observed across varied proportions of 1-Octadecanol to n-Nonadecane,  Temperature trajectory of
1-Octadecanol during its phase transition from R’IV to the Monoclinic (γ) phase,
Temperature trajectory of
1-Octadecanol during its phase transition from R’IV to the Monoclinic (γ) phase,  Temperature evolution of n-Nonadecane as it undergoes
a phase shift from the liquid state to the R’I phase,
Temperature evolution of n-Nonadecane as it undergoes
a phase shift from the liquid state to the R’I phase,  Thermal progression of n-Nonadecane during its transition from the R’I phase to the
Orthorhombic (β) phase.
Thermal progression of n-Nonadecane during its transition from the R’I phase to the
Orthorhombic (β) phase.
Heating phase diagram: In Figure 11, the blue trajectory delineates the thermal profile of 1-Octadecanol during its phase transition from the liquid state to the R’IV phase, observed across varied proportions of 1-Octadecanol to n-Nonadecane. Simultaneously, the red trajectory signifies the temperature evolution of n-Nonadecane as it undergoes a phase shift from the liquid state to the R’I phase. Furthermore, the orange trajectory graphically represents the thermal progression of n-Nonadecane during its transition from the R’I phase to the Orthorhombic (β) phase.

Figure 11: A binary system Phase Diagram of n-Nonadecane and 1-Octadecanol (Heating). Note:  Thermal profile of 1-Octadecanol from the
liquid state to the R’IV phase, observed across varied proportions of 1-Octadecanol to n-Nonadecane,
Thermal profile of 1-Octadecanol from the
liquid state to the R’IV phase, observed across varied proportions of 1-Octadecanol to n-Nonadecane,  Temperature evolution of n-Nonadecane as
it undergoes a phase shift from the liquid state to the R’I phase,
Temperature evolution of n-Nonadecane as
it undergoes a phase shift from the liquid state to the R’I phase,  Thermal progression of n-Nonadecane during its transition from the R’I phase
to the Orthorhombic (β) phase,
Thermal progression of n-Nonadecane during its transition from the R’I phase
to the Orthorhombic (β) phase,  Phase transitions undergone by 1-Octadecanol.
Examining the cooling and heating phase diagram allows for a discerning analysis of the phase transitions undergone by 1-Octadecanol. Notably, the transition from a stable phase to a rotator phase is evident. Intriguingly, during the heating process, this transition seems to dissipate (The region delineated by the green ellipse, comparing with Figure 10), suggesting that the disordered phase is not thermodynamically stable under elevated temperatures.
Although a subtle phase transition is observable during heating, its intensity appears insufficient for accurate recognition by Differential Scanning Calorimetry (DSC). This implies that certain alterations in the molecular arrangement or energy state occur, but they might be subtle or transient, eluding detection by the precision of the DSC technique. This nuanced understanding of the phase behaviour of 1-Octadecanol sheds light on the intricacies of its thermodynamic stability and the sensitivity required in experimental methodologies to capture subtle transformations.
FTIR spectra
The analysis of seven samples, as outlined in Table 1, involved the utilization of Fourier Transform Infrared (FTIR) spectroscopy. These samples, with varying compositions of 1-Octadecanol at 100%, 80%, 60%, 50%, 40%, 20%, and 0%, were selected for a comprehensive investigation.
The FTIR spectra obtained from these samples are visually represented below, offering valuable insights into the molecular composition. Figure 12 illustrates a spectrum comparing transmittance and wavenumber, while Figure 13, derived transformation from Figure 12 through OMNIC, depicts additional spectra comparing absorbance and wavenumber.

Figure 12: FTIR spectra (Transmittance).

Figure 13: FTIR spectra (Absorbance).
In the spectral analysis, distinctive peaks were identified, each corresponding to specific molecular vibrations. Notably, the peak observed around wavenumber 750 cm-1 was attributed to the out-ofplane bending of the O-H bond. The peak at approximately 1000 cm-1 indicated the stretching vibration of the C-O bond, while the peak around 1500 cm-1 was associated with the bending vibration of the C-H bond. The double-peak evident around 3000 cm-1 was identified as the saturated C-H stretching vibration absorption peak.
Of particular interest was the inconspicuous yet significant wide peak at around 3300 cm-1. This peak was attributed to the O-H stretching vibration associated with intermolecular hydrogen bonds. The presence and characteristics of these peaks provide valuable information about the molecular structure and interactions within the samples, contributing to a comprehensive understanding of the composition and behaviour of 1-Octadecanol in different proportions. This FTIR analysis serves as a crucial tool in unravelling the intricate details of the molecular dynamics of these samples and contributes to the broader understanding of their chemical properties [10].
To delve deeper into the complexities of the 1-Octadecanol and n-Nonadecane binary system, we observe a fascinating sequence of phase transitions that reveal the intricate nature of these compounds. For 1-Octadecanol, the transition begins in a liquid state, before transitioning to a R’IV phase, and finally stabilizing in a monoclinic structure. This progression demonstrates the compound’s dynamic structural changes under varying conditions.
Similarly, n-Nonadecane exhibits its own unique transformation path. It starts from a liquid state and then moves into the R’I phase. Following this, it settles into an orthorhombic structure. This pathway underscores the distinct molecular behaviors of n-Nonadecane compared to 1-Octadecanol, even though they are part of the same binary system.
A particularly intriguing aspect of this study is the transition of 1-Octadecanol from the γ-phase to the rotator phase. This specific transition phase, which is of significant scientific interest, proves elusive when attempting to detect it using Differential Scanning Calorimetry (DSC). The challenge in detecting this transition lies in the extremely subtle nature of the signal that this phase change generates. It’s a testament to the sensitivity required in measuring techniques and the need for precise instrumentation in the study of molecular phase transitions.
The elusive nature of this signal in DSC analysis suggests that there might be minimal enthalpy change during this transition, making it difficult to capture using conventional calorimetric methods. This subtle transition is a critical area of study, as understanding the γ to rotator phase transition in 1-Octadecanol could provide deeper insights into the molecular dynamics and phase behaviour of long-chain alcohols.
Moreover, the differences in the transition pathways of 1-Octadecanol and n-Nonadecane, despite being components of the same binary system, highlight the complexity and individuality of molecular structures and behaviours. These findings have broader implications for the study of phase transitions in binary systems, suggesting that even closely related compounds can exhibit markedly different behaviours under similar conditions. This complexity necessitates a more nuanced approach to the study of phase transitions in such systems, with a focus on the individual characteristics of each component as well as their interactions.
Drawing upon preceding research [30,31], the Fourier-Transform Infrared (FTIR) analysis yielded valuable insights. Manifesting as a peak around the wavenumber 750 cm-1, the out-of-plane bending of the O-H bond was discerned. The peak encompassing 1000 cm-1 signified the stretching vibration of the C-O bond, while the peak at 1500 cm-1 denoted the bending vibration of the C-H bond. The distinctive double-peak discerned around 3000 cm-1 was attributed to the saturated C-H stretching vibration absorption. Notably, an inconspicuous yet broad peak around 3300 cm-1 was identified as the O-H stretching vibration indicative of intermolecular hydrogen bonds. These nuanced analytical findings contribute significantly to our understanding of the molecular dynamics and structural intricacies within this binary system, mirroring the complex nature of plant cuticle waxes.
This research meticulously constructed a binary system of n-Nonadecane and 1-Octadecanol to emulate the composition of the plant cuticle waxy layer. Employing numerical analysis, it investigated the system’s phase transitions and crystal structures, revealing that 1-Octadecanol transitions from Liquid to R’IV to Monoclinic, and n-Nonadecane from Liquid to R’I to Orthorhombic. A notable challenge was detecting the γ to rotator phase transition in 1-Octadecanol using Differential Scanning Calorimetry (DSC), due to the subtleness of the signal. This culminates in the derivation of the following conclusions:
• The system effectively simulates the one of the complex structures of the plant cuticle waxy layer.
• The binary system displays distinct phase transition pathways for each component.
• Detection of certain phase transitions, like the γ to rotator in 1-Octadecanol, is challenging with conventional methods like DSC.
The FTIR analysis provided significant insights into the molecular dynamics of a binary system, particularly in the context of plant cuticle waxes. Key findings from the analysis include:
• A peak around 750 cm-1, indicating the out-of-plane bending of the O-H bond.
• The presence of a peak at 1000 cm-1, representing the stretching vibration of the C-O bond.
• A peak at 1500 cm-1, corresponding to the bending vibration of the C-H bond.
• A distinctive double-peak around 3000 cm-1, attributed to the saturated C-H stretching vibration absorption.
• An inconspicuous but broad peak around 3300 cm-1, identified as the O-H stretching vibration, suggesting the presence of intermolecular hydrogen bonds.
These findings are crucial for understanding the structural intricacies and molecular interactions within the binary system, reflecting the complex nature of plant cuticle waxes.
Author contributions
Conceptualization: Wentao Guo; Yi Xing and Wei Su; Methodology: Wentao Guo; Software: Guotao Li; Validation: Changjiang Hou, Yi Xing and Wei Su; Formal analysis: Wentao Guo; Investigation: Changjiang Hou; Resources: Yi Xing; Data curation: Wentao Guo; Writing-original draft preparation: Wentao Guo, Guotao Li; Writing-review and editing: Wei Su; Visualization: Guotao Li; Supervision: Yi. Xing; Project administration: Wentao Guo; Funding acquisition: Changjiang Hou. All authors have read and agreed to the published version of the manuscript. Please turn to the CRediT taxonomy for the term explanation.
Funding
This work was supported by the National Key R&D Program of China (No. 2022YFE0208100), Key Research and Development Program of Hebei Province (No. 22373706D), Key Science and Technology Planning Project of HBIS Group Co., Ltd. (No. HG2020204–2), and Guangdong Province Engineering Laboratory for Air Pollution Control (20193236-09-06).
Data availability statement
All the data can be collected by contacting wentao_guo@ustb.edu. cn.
Acknowledgments
The authors would like to express sincere gratitude to Prof. Kevin J. Roberts, Laksha Parameswaran, Alexander Jackson, and Yu Liu from University of Leeds for their continued assistance throughout the project, providing advice and guidance that was essential for completing this project.
Conflicts of interest
The funders had no role in the design of the study; in the collection, analyses, or interpretation of data; in the writing of the manuscript; or in the decision to publish the results.
[Crossref] [Google Scholar] [PubMed]
[Crossref] [Google Scholar] [PubMed]
[Crossref] [Google Scholar] [PubMed]
[Crossref] [Google Scholar] [PubMed]
[Crossref] [Google Scholar] [PubMed]
[Crossref] [Google Scholar] [PubMed]
[Crossref] [Google Scholar] [PubMed]
[Crossref] [Google Scholar] [PubMed]
[Crossref] [Google Scholar] [PubMed]
[Crossref] [Google Scholar] [PubMed]
[Crossref] [Google Scholar] [PubMed]
[Crossref] [Google Scholar] [PubMed]
[Crossref] [Google Scholar] [PubMed]
[Crossref] [Google Scholar] [PubMed]
[Crossref] [Google Scholar] [PubMed]
[Crossref] [Google Scholar] [PubMed]
Citation: Guo W (2024) Investigation of Inter- and Intra-Chain Interactions in Mixtures of Long-Chain Hydrocarbons with Relations to Plant Cuticular Waxes: Using n-Nonadecane and 1-Octadecanol Mixture as Examples. J Phys Chem Biophys. 14:370.
Received: 13-Dec-2023, Manuscript No. JPCB-23-28496; Editor assigned: 15-Dec-2023, Pre QC No. JPCB-23-28496 (PQ); Reviewed: 29-Dec-2023, QC No. JPCB-23-28496; Revised: 05-Jan-2024, Manuscript No. JPCB-23-28496 (R); Published: 12-Jan-2024 , DOI: 10.35248/2161-0398.23.14.370
Copyright: © 2024 Guo W. This is an open-access article distributed under the terms of the Creative Commons Attribution License, which permits unrestricted use, distribution, and reproduction in any medium, provided the original author and source are credited.