Journal of Glycobiology
Open Access
ISSN: 2168-958X
ISSN: 2168-958X
Research Article - (2018) Volume 7, Issue 1
In this work, we attempt to analyze the hydrogen bond network of cellulose by comparing the 2nd derivative infrared spectra of alfa fiber treated with different concentrations of thymol. It was proved, from this study, that the 2nd derivative infrared spectrum is a useful method for identifying the least changes incurred in the cellulosic supramolecular structure. It can be considered as an effective method to gain further insight on OH bond system of cellulosic materials and to clarify some grey areas in terms of infrared band assignment. The careful analysis of 2nd derivative infrared spectra of untreated and thymol treated alfa fibers revealed an increase in band intensity related to both intermolecular and intramolecular hydrogen bonds and a decrease in bands related to free hydroxyl groups.
Keywords: FTIR spectrum; Cellulose; Alfa fiber; Thymol; Hydrogen bonds
Nowadays, development of eco-friendly materials gives rise to a new generation of packaging made with cellulosic fibers. To enhance some antimicrobial properties of these packaging, fibers were treated with essential oils such as lemongrass (Cybopogon citratus), rosemary pepper (Lippia sidoides), basil (Ocimum gratissimum ) oregano, Zataria multiflora [1-5].
Among these great variety of essential oils, thymol (also known as 2- isopropyl-5-methylphenol, IPMP) is widely used in food packaging as a nature substance with strong bactericidal and anti-fungal properties [6-9].
Extracted from Thymus vulgaris (thyme) and some other varieties of plants, thymol is a “phenolic” compound with the chemical composition of C10H14O. Thymol molecule has a hydroxyl group attached to a benzene-type ring. Thanks to this aromatic ring, thymol is very polar and reacts irreversibly with many materials such as cellulosic fibers. Indeed, as cellulose is composed of hydroxyl groups, thymol may irreversibly form stable ethers with these -OH groups.
In this work, FTIR spectroscopy was used to fully analyze the way of incorporation of thymol molecules into cellulosic structures.
Through a careful study of infrared spectra for untreated and thymol treated cellulosic fibers, we have tried to analyze and properly understand the way of incorporation of thymol into cellulosic structure. Besides, this work is an attempt to clarify some uncertainties regarding infrared assignments of hydrogen bonds.
Scientific and historical background
Attempts to study plant cell wall substance (named cellulose in the studies of Payen [10]) date back to the 19th century. Payen [10] and Braconnot [11], are the first to study chemical structure of fibrous component, they noted that all plant cells are composed of a unique structure.
50 years later, Willstatter and Zechmeister [12] established the basic cellulose formula and its unit cell volume. However, a long discussion was raised to identify the cellulose macromolecule which was finally recognized and accepted following the studies of Staudinger [13].
Simultaneously, early studies on glucose and polysaccharides showed that cellulose is a polysaccharide comprising β (1→4) linked Dglucopyranose units. Cellulose formula is (C6H10O5)n and it is a homopolymer with a several hundred to many thousands of units. Crystallographic study of D-glucose and cellobiose demonstrated that the D-glucose residues have the 4C1 chair conformation [14-18]. This specific conformation and glycosidic linkages of cellulose units result in two chemically different chain ends: the first end comprises an anomeric carbon atom involved in a glycosidic linkage, whereas in the second chain end, the anomeric carbon atom is free (Figure 1).

Figure 1:Representation of cellulose chain.
Once cellulose formula has been well defined, it has been demonstrated by Irvine and Hirst [17] and then by Freudenberg and Braun [16] that in cellulose, carbons C2, C3 and C6 are linked to free hydroxyl groups OH which can react with other molecules and form either interchain or intrachain hydrogen bonding. But, some important points are still confused and must be resolved concerning the hydrogen bonding network connecting cellulose chains.
In fact, the understanding of OH bonds network of the supramolecular structure is of great importance since it dictates the way in which cellulose chains are packed, and consequently, one can interpret in larger scale structure the mechanical, physical and chemical behavior of cellulosic materials.
However, it is not possible to study hydrogen bonding network without the deep and perfect knowledge of cellulose unit cells and crystalline phases.
Originally, as proposed by Meyer and Mish [18], researchers believed that cellulose unit cell was unique despite the great discrepancy of results and the inconsistent of experimental data that vary with cellulosic sample origin.
A few years later, the unit cell question was reopened with studies on highly crystalline cellulose found in algae which allows proving that native cellulose may crystallize in different forms. Indeed, algae cellulose contains exclusively cellulose Iα with unit cell dimensions different from that proposed by Meyer and Mish [18]. This discovery was supported by Atalla and VanderHart [14] who established that native cellulose is composed of two different crystalline phases (Iα and Iβ). Cellulose Iβ (generally found in cell walls of land plants) has monoclinic unit cell with two parallel chains, whereas cellulose Iα (which is produced in algal and bacterial biofilms) has a triclinic unit cell containing one unique chain [19,20].
In this work, an exhaustive bibliographic study was carried out in the aim of determining infrared bands assignment relating to intermolecular, intramolecular and free OH bonds. Recent works were based on new technologies and improvements in both spectrophotometric techniques and computational chemistry methods.
Lee et al. [21] used computational modeling (density functional theory with dispersion corrections DFT-D2) for the cellulose Iβ crystal lattices to compare simulation results with experimental data obtained from polarized IR and Sum Frequency Generation (SFG) Vibrational Spectroscopy. It was concluded that the 3270 cm-1 peak of cellulose Iβ and the 3240 cm-1 peak of cellulose Iα could be assigned to the OH vibrations with a large contribution from intrachain hydrogen bonded 2OH groups. The peak at around 3410 cm-1 is attributed to the mode with a significant contribution from interchain hydrogen-bonded 6OH groups. The peak at around 3370 cm-1 has a significant contribution from intrachain hydrogen-bonded 3OH groups. The 3300-3350 region is mostly due to high-coupled OH vibrations with considerable contributions from both inter and intrachain hydrogen-bonded groups. The broad component near 3450 cm-1 appears to be due to contributions from OH groups at the crystal surface.
Kondo [22] studied the relationship between intramolecular hydrogen bonds and certain physical properties of regioselectively substituted cellulose derivatives. Since 6-O-methyl cellulose had been shown to have only intramolecular hydrogen bonds, The author used solubility, relative reactivity for the remaining OH groups at the C2 and C3 positions. He concluded that the excellent solubility of 6MC in different solvents was attributed to the absence of interchain hydrogen bonds in 6MC, but the intramolecular hydrogen bonds may be maintained due to the reactivities at both OH-2 and OH-3 in 6MC.
Hori and Sugiyama [23] proposed a new analytical method combining FT-IR microscopy and a statistical analysis approach (principle component analysis) to investigate chemical variations between softwood species and some types of wood cell walls. The method allowed to detect small spectral differences between cell types rather than species and to predict characteristic chemical components of each cell type.
Popescu et al. [24] carried out the deconvolution of IR spectra with Gaussian contours to better understand the structure of lignocellulosic samples. The number and the maximum of the deconvoluted peaks were taken from second derivative spectra. They concluded that in the unbleached and chlorite-bleached brown stock pulp spectra, the bands assigned to lignin are very low. Besides, the integral absorption and the height of the lignin-assigned bands in FT-IR spectra of the pulp samples decreases or are even missing, while the bands assigned to cellulose are higher than those presented in the eucalyptus chip sample.
Guo and Wu [25] used the correlation spectroscopy and movingwindow techniques to investigate the hydrogen bond structure of cellulose diacetate induced by heating. Four kinds of interchain hydrogen bonds and intrachain hydrogen bonds were identified, which are 3461 cm-1 (intrachain), 3478 cm-1 (intrachain), 3369 cm-1 (intrachain) and 3409 cm-1 (interchain). The authors concluded that band at 3478, 3461 cm-1 may come from the same hydroxyl groups and 3461cm-1 may assigned to the intrachain hydrogen bonded hydroxyl groups with the participating of the water molecules. The interchain hydrogen bonds are comparatively strong but unstable, while the intrachain hydrogen bonds are comparatively weak but stable. In the lower temperature range, the water molecules captured in the hydrogen bond matrix broken away and the structure of hydrogen bonds changed slightly. When temperature continues to increase, both the interchain and intrachain hydrogen bonds are began to be weakened, and the hydrogen bond matrix changes significantly.
Extraction of ultimate alfa fibers
Stippa tenacissima or esparto grass plant (usually named alfa), a cylindrical plant of approximately 1 m length, is abundantly found in the dry regions of North Africa. It belongs to the Graminacie family. Fibers extracted from this plant are generally used for the production of paper and, recently, as reinforcement of biodegradable composites [26-29].
The alfa plant is formed by several circular bundles of filaments. To extract individual fibers from these filaments, we have used mixed treatment involving NaOH (sodium hydroxide) and H2O2 (hydrogen peroxide) since it gives the best separation results as demonstrated by Ben Marzoug et al. [30].
In this method, alfa filaments were placed in a bath solution containing 25 g/L of stabilizing agent, 3 g/L of wetting agent, 30 g/L NaOH (sodium hydroxide, 98%) and 35 mL/L H2O2 (hydrogen peroxide, 35%) at a temperature of 120°C during 90 min. All chemical products were purchased from Cimitex, Tunisia. The treatments were made with a dyeing machine (Mathis) under pressure and during continuous mixing. After each treatment, individual fibers were rinsed with tap water and dried at room temperature. The obtained individual alfa fibers are characterized by a length between 0.2 and 3 mm, a diameter of 8 μm, a density of 1.2 and a crystallinity of 80%. Furthermore, it has been proved that this fiber is rich in cellulose and contains a very low lignin content (<1%) [30,31].
Thymol treatment of alfa fibers
Thymol (2-Isopropyl-5-methylphenol, IPMP), a white crystalline substance, was purchased from Sigma-Aldrich and meets analytical specification of Ph. Eur., BP, NF. It has the following characteristics: CAS number: 89-83-8; chemical formula: C10H14O; molecular weight MW: 150.22; density: 0.965 g/mL at 25°C (M); purity: 99-101%.
Ultimate alfa fibers were treated by impregnation in thymol solutions with different concentrations (2, 4, 6, 8 and 10% w/w). The temperature of all treatments was set at 50°C and their duration was varied (2 min and 30 min). Fibers’ drying was achieved in an oven at a temperature of 40°C during 60 min.
Infrared analyses
Attenuated total reflection (ATR) is a technique used in conjunction with infrared spectroscopy that enables samples to be passively examined in the solid or liquid state without any preparation. ATRFTIR is used in many fields since it is a non-destructive, direct and rapid method.
A spectrophotometer of type PerkinElmer UATR (Single Reflection Diamond) with an attenuated total reflectance (ATR) attachment was used to undertake infrared spectra analysis. 100 scans were taken per sample with a resolution is 2 cm-1. The infrared spectra were recorded in the range of 4000-500 cm-1.
Preprocessing of IR spectra
In spectroscopic applications, scaling differences arise from path length effects, scattering effects, source or detector variations or other general instrumental sensitivity effects. In these cases, it is often the relative value of variables which should be used when doing multivariate modeling rather than the absolute measured value.
Spectra normalization
The sample normalization preprocessing methods attempt to correct for these kinds of effects by identifying some aspect of each sample which should be essentially constant from one sample to the next, and correcting the scaling of all variables based on this characteristic. The ability of a normalization method to correct for multiplicative effects depends on how well one can separate the scaling effects which are due to properties of interest (e.g. concentration) from the interfering systematic effects.
Normalization also helps give all samples an equal impact on the model. Without normalization, some samples may have such severe multiplicative scaling effects that they will not be significant contributors to the variance and as a result, will not be considered important by many multivariate techniques.
There are several well-known preprocessing technique to normalize infrared spectra like standard normal variate transformation (SNV), detrending, multiplicative scattering correction (MSC), combined preprocessing methods.
In this work, we have used the multiplicative signal correction (MSC) method of which the basic concept is to remove non-linearities in the data caused by scatter from particulates in the sample. The MSC operation is divided into two steps: estimation of the correction coefficients:
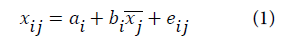
and correction of the spectra:
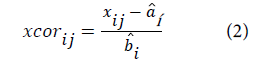
Where,
a and b are the correction coefficients estimated, for each sample, by ordinary least-squares regression of spectrum x versus ͞x over the available wavelengths.
e is the unmodeled part,
x, ͞x and xcor are the original, reference (average spectrum) and corrected spectra, respectively.
Noise removal and baseline correction
Noise represents random fluctuations around the signal that may originate from the instruments or environmental laboratory conditions. The residual noise present in the data can be removed mathematically. In this work, we have used the Fast Fourier Transform (FFT) algorithm available in Origin 6.0. Besides, spectra were baseline corrected with a segmented linear baseline linking the following frequencies: 380, 1185, 1515, 2790, 3660 cm-1. Processing of spectra, baseline corrections and derivative spectra were generated using software resolution program (Origin 6.0).
Figure 2 represents the original and normalized FTIR spectra recorded for the different samples of treated alfa fibers.

Figure 2:(a) Original FTIR spectra of alfa fibers treated with different concentrations of thymol (b) MSC normalized FTIR spectra.
The aromatic character of phenolic compounds like thymol is often defined by the carbon double bond C=C stretching of benzene ring that gives rise to a moderate IR band in the region of 1620-1680 cm-1. In Figure 2b, the absorption peak at 1638 cm-1 arising from the aromatic skeletal vibration C=C of the benzene ring is not characteristic of cellulose. The presence of this peak for the raw fiber is due to the lignin content. But when the fiber is subjected to thymol treatment, the intensity increase of this band indicates the presence of thymol molecules.
The C-O bands vibrations which are mainly due to C-OH stretching modes in alcoholic COH moieties are located around 900-1200 cm-1. The region between 2800 cm-1 and 3800 cm-1 corresponds to OH bond vibrations. It is clear from Figure 2b that the C-OH and OH bands area and intensity increased with the treatment of alfa fibers indicating the disruption of hydrogen bonds network. This explains the compatibility and interaction between cellulose and thymol molecules which leads to enhancement of intramolecular and intermolecular hydrogen bonding.

Figure 3:(a) 2nd derivative spectra for 900-1200 cm-1 C-OH vibration. (b) Assignment of IR bands of Iß cellulose with stretching bands of alcoholic groups drawn as two headed arrows and bending bands of alcoholic groups as single headed arrows. Three conformations depending on the rotation of the C6H2-O6-H group around the C5-C6 bond are displayed and labeled I, II, III [32].
The 1D Infrared spectrum in Figure 2b shows one unique clump in the regions of 900-1200 cm-1 and 2800-3800 cm-1 which corresponds to C-OH and OH bond vibrations respectively. When the spectrum is differentiated, these two groups of mountains are divided into distinct and discernable peaks (Figures 3a and 4a).

Figure 4:(a) 2nd derivative spectra for 2800-3800 cm-1 OH band region. (b) Representation of inter and intra chains hydrogen bonds in cellulose.
Figure 3a represents the 2nd derivative infrared spectrum for the region of 900-1200 cm-1 that is due to C-OH stretching modes in alcoholic COH moieties (Figure 3b). Among these bands, we may identify at a wavenumber around 1032 cm-1, the C-O bands mainly due to primary alcohols, i.e., bands corresponding to C6 position for the conformation I (Figure 3b). Whereas, the two peaks at 998 and 1019 cm-1 are assigned to this same primary alcohols (C6) for conformations II and III respectively. These two peaks are less intense than the one at 1032 cm-1 indicating that conformations II and mainly III are less likely to be established. Indeed, the C6H2-O6-H group of cellulose may rotate around the C5-C6 bond to give three possible conformations (labeled I, II and III in Figure 3b). It was proved in previous research works that conformation I is the dominant one and represents at least 2/3 of the total conformations since it is energetically favorable as compared to conformations II and III [32]. This conformation corresponds to the absence of hydrogen bond of a significant strength established by a neighbor C2O2H alcohol on the considered C6H2-O6H primary alcohol since C2O2H alcohols predominantly (roughly for 2/3 of them) establish weak hydrogen bonds, or perhaps no hydrogen bonds.
The peak at 1059 cm-1 is indicative of C3-O3H vibrations with intramolecular hydrogen bonds O3H…O5. The intensity of this peak reveals the stability and independence of this kind of hydrogen bond. The peak at 1112 cm-1 is assigned to C2-O2H vibrations with free hydrogen group O2H. On the other hand, the less intense peak at 1124 cm-1 corresponds to C2-O2H… with linked hydrogen group (O2H…O6 intramolecular hydrogen bond).
It is clear from Figure 3a that the increase in the band intensity of secondary and primary alcohols (C-OH) with thymol treatment indicates that OH groups may interact with thymol molecules and establish either intermolecular or intramolecular hydrogen bonds when the fiber is subjected to the treatment. Figure 4a represents the 2nd derivative infrared spectrum for the region of 2800-3800 cm-1. This figure shows many peaks that correspond to different mode of OH bending namely those related to interchain, intrachain and free OH bonds (Figure 4b). In this paper, a great deal of work will be focused on the second derivative spectrum for which each zone will be analyzed and dissected separately. Thus, it will be possible to gain further insight on OH bond system of cellulosic materials and to clarify some grey areas in terms of IR band assignment.
Bands at 2850 cm-1 and 2917 cm-1 are assigned to symmetric and asymmetric CH stretching in aromatic methoxyl groups and in methyl and methylene groups of side chains [33-35]. Since cellulose molecules are free of these types of groups, the presence of these bands in untreated alfa fiber is related to non-cellulosic materials (lignin and pectin). As shown in Figure 5, the intensity of the bands at 2850 cm-1 and 2917 cm-1 firstly decreases for low thymol concentrations (2%) and then increases gradually for higher concentrations. The intensity decrease may be attributed to the removal of lignin and non-cellulosic materials, while the increase in intensity may be explained by the incorporation of thymol molecules containing methyl groups into cellulosic chains. This is to ensure the compatibility between thymol and cellulose molecules.

Figure 5:Variation of 2850 cm-1 and 2916 cm-1 FTIR bands in the 2nd derivative spectra with thymol concentration.
Figure 6 presents the 3200-3400 cm-1 region of hydrogen bond stretching. The bands at 3273 cm-1 and 3337 cm-1 show a notable increase in intensity when the fiber is subjected to thymol treatment.
It was approved unanimously that the peak at 3273 cm-1 can be assigned to the stretch vibration mode containing the intramolecular hydrogen bonds with a major contribution of O6H…O2. As shown in figure 4b, this hydrogen bond occurs between O2 and O6 of successive glucosidic units in the same chain [36-38]. Band at 3273 cm-1 is specific to large cellulose Iβ crystallites, and it appears only if hydroxymethyl groups adopt the conformation III of the Figure 3b.

Figure 6:Variation of 3272 cm-1 and 3338 cm-1 FTIR bands in the 2nd derivative spectra with thymol concentration.
For untreated fibers, the band at 3273 cm-1 is dispersed in a broad peak not well pronounced, which supposes that the conformation III is unlikely to happen especially in amorphous region where the position of hydroxymethyl moieties may be considered as indeterminate or totally non-oriented. But when thymol molecules are incorporated in the fiber, non-crystalline zones are first affected and the effect of packing disrupts the overall structure of cellulose. As a consequence, the primary hydroxyl groups may adopt the conformation III to bring more stabilization to cellulosic chains. Thus, in the presence of thymol molecules, O6H…O2 intramolecular hydrogen bonds may be formed as a consequence of the conformation III. This leads to sharper and more intense peak at 3273 cm-1.
With regard to the band positioned at 3337 cm-1, which behaves in the similar way as the band at 3270 cm-1, there is some conflict in its assignment. The majority of authors consider that this band is attributed to O3H…O5 intramolecular hydrogen bonding, but some other researchers assign this band to the contribution from both intra and intermolecular hydrogen bonds O3H…O5 and O2H…O6 [39-45].
The intrachain bond O3H…O5 corresponds to the hydrogen linkage between O3 and the ring ether O5 of another residue (Figure 4b). This bond is well defined and standard in cellulose I and it is the most independent given that it does not participate in interaction with any other H bonds. The stability of this specific H bond was noted in many research works [45-48] and it was proven that this intramolecular hydrogen bond is quickly developed to provide more stabilization when the structure is subjected to a certain change. In this way, we can give a rational explanation to the increase of the band at 3337 cm-1 for thymol treated fibers.
The peak at 3375 cm-1, although not very intense, deserves to be investigated. This band is observed with much higher amplitude in Halocynthia mantle, Glaucocystis, algal and bacterial cell walls [21,49]. Thus, it was suggested that the 3370 cm-1 band is typical to samples rich in cellulose Iα and ascribed to intramolecular hydrogen bonds O3H…O5.
O3H…O5. Consequently, it can be noted that for untreated alfa fiber, the intramolecular hydrogen bonds O3H…O5 may appear in two different bands (3338 cm-1 and 3375 cm-1) with a larger population for the first one. This means that O3H…O5 hydrogen bonds in cellulose Iβ are strong and preferably vibrate at lower wavenumber. As a consequence, when the fiber is treated with thymol, the rise in the population of the band at 3338 cm-1 eliminates the band at 3375 cm-1 which totally disappears (Figure 7).

Figure 7:Variation of 3375 cm-1 FTIR bands in the 2nd derivative spectra with thymol concentration.
While the group of mountains at 3200-3300 cm-1 involves intramolecular hydrogen bonds, that between 3400-3500 cm-1 is rather attributed to intermolecular hydrogen bonds [21,44,50-53]. This assumption is grounded by evidence that intermolecular H bonds are generally weaker than intramolecular ones. However, this band assignment is not definitive since, in some works, bands around 3400 cm-1 were also assigned to intramolecular H bonds [22,54].
In this work, we can argue that the bands between 3400 and 3500 cm-1 are due to the intermolecular hydrogen bonds formed between cellulose chains and thymol molecules.
As shown in Figure 8, bands at 3466 cm-1 and 3430 cm-1 do not exist for untreated fiber, they only appear with a relatively high intensity once the fiber is subjected to thymol treatment.

Figure 8:Variation of 3405 cm-1, 3430 cm-1 and 3466 cm-1 FTIR bands in the 2nd derivative spectra with thymol concentration.
It must be pointed out that red and green peaks that correspond to low thymol concentrations (2%, 4%) are the most intense ones at 3466 cm-1 and there is no significant effect of high concentrations for this particular wavenumber. However, opposite effect is observed for lower wavenumbers: for the band at 3405 cm-1, pink and blue peaks (corresponding to high thymol concentrations of 10% and 6%) are the strongest ones and there is no effect of low concentrations. On the basis of these observations, one can evidently conclude that the band at 3466 cm-1 may be attributed to weak intermolecular hydrogen bonds that are firstly formed in the most accessible regions, namely at the fiber surface and in the less crystalline zones. Indeed, O-H groups form covalent bonds but they also have ionic character. When OH group is free, OH covalent bond absorbs at high frequencies (3600 cm-1). But when this same OH group participates in a hydrogen bond, the covalent bond is weakened and absorbs at lower frequencies. The stronger the hydrogen bond is, the weaker the covalent bond becomes. Thus, bands at 3466 cm-1 corresponding to weak intermolecular hydrogen bonds are formed for low thymol concentrations, whereas bands at 3405 cm-1 may be assigned to strong intermolecular H bonds formed for high thymol concentrations. That is in accordance with other research works. Indeed, according to the literature, the band at 3405 cm-1 is due to vibration of hydroxymethyl C(6)H2O(6)H primary alcohols that form interchain hydrogen bonds, and that at 3450 cm-1 is related to vibration of alcohols O(2,3,6)H showing weak hydrogen bonds at the surface and in amorphous regions [21,46,55].
Peaks in the range of 3500-3600 cm-1 are generally attributed to stretching vibration of the free OH groups [22,35-38,56,57]. These bands appear at higher wavenumbers compared to those for interchains and intrachains hydrogen bonds.
In the “Handbook of infrared and Raman characteristic frequencies of organic molecules”, Lin-Vien et al. [58] presented an extensive and updated study on group frequencies in infrared spectra [58]. It is reported in this reference that free hydroxyl groups in primary alcohols appear at around 3636-3643 cm-1, whereas in secondary alcohols, they show bands in the range of 3626-3632 cm-1. Besides, it is noted that alcohols linked to cyclic compounds are rather characterized by lower frequencies, and this red shift is more pronounced for large ring size (more than 6-membered rings). This lowering of frequency is due to the steric repulsion effect. Indeed, the bulky cyclic group does not interfere sterically with the hydroxyl groups and allow them to form hydrogen bonds with other molecules. Then, in cellulosic compounds which represent a polysaccharide of pyranose units, the bands relative to free hydroxyl groups will appear at lower frequencies compared to alcohols.

Figure 9:Variation of 3569 cm-1 and 3599 cm-1 FTIR bands in the 2nd derivative spectra with thymol concentration.
As shown in Figure 9, primary alcohols appear at around 3590 cm-1 (OH(2) and OH(3)) and secondary ones at 3560 cm-1 (OH(6)). Reducing of these bands by fiber treatment may be explained by the decrease in the number of free OH groups that interfere with thymol molecules to form intermolecular hydrogen bonds. Thus, we can conclude that the OH stretching bands in the range of 3500-3600 cm-1 (free OH groups) are replaced by bands around 3400-3500 cm-1 (intermolecular OH bonds).
FTIR spectroscopy is a widely used technique to analyze fiber structure. But the 1D infrared spectrum on its own gives poor information on the structural changes occurring in the fiber components after a certain treatment. From this study, it was proved that the 2nd derivative Infrared spectrum is a useful method for identifying the least changes taking place in the cellulosic supramolecular structure.
In the present work, we focus on the region of 2800 cm-1-3800 cm-1 which corresponds to OH group vibration. While the 1-D Infrared spectrum shows one unique clump in this region, the 2nd derivative infrared spectrum comprises many different peaks corresponding to intermolecular, intramolecular and free OH bonding. By examining the 2nd derivative infrared spectra of untreated and thymol treated alfa fibers, we noticed an increase in the intensity of the bands at 2850 cm-1 and 2917 cm-1 which may be explained by the incorporation of thymol molecules containing methyl groups into cellulosic chains. The same increase in intensity was observed for bands related to intramolecular (3272 cm-1, 3338 cm-1) and intermolecular (3405, 3430 and 3466 cm-1) hydrogen bonds.
However, the intensity of the bands in the range of 3500-3600 cm-1 corresponding to free hydroxyl groups is reduced with fiber treatment. This may be explained by the decrease in the number of free OH groups that interfere with thymol molecules to form intermolecular hydrogen bonds.