Journal of Glycobiology
Open Access
ISSN: 2168-958X
ISSN: 2168-958X
Research Article - (2019)Volume 8, Issue 1
Background: The pathophysiology of Autistic Spectrum Disorder (ASD) is not fully understood and there are no diagnostic or predictive biomarkers. In our previous study we found that expression of serum Siaα2-3 Gal/ GalNAc recognized by Maackia amurensis Lectin II (MAL-II) as well as MAL-II Binding Glycoproteins (MBGs) were significantly increased in ASD compared to Typically Developing (TD) children; however the specific glycoforms of MBGs remain unclear.
Method: In this study, N- and O-glycans on sera MAL-II binding glycoproteins (MBGs) from 60 children with ASD and 60 age-matched TD children were profiled by using lectin-magnetic particle conjugate assisted MALDI-TOF/ TOF-MS analysis.
Results: A total of 16 representative N-glycans including high-mannose, complex and hybrid, bi-/tri-antennary structures and bisecting GlcNAc glycoforms and 20 representative O-glycans derived from core structures 1, 2, 3, and 4 were annotated in TD and ASD sera. Among these, 6 sialylated or disialylated N-glycans were specifically observed in ASD sera, such as disialylated bi-antennary complex N-glycan (m/z 2061.356). The proportion of total sialylated and disialylated O-glycans were also apparently increased in ASD (63.2% and 15.8%) vs. TD (50.5% and 10.0%) sera respectively, which was most obvious in core 3 and 4 (e.g., sialylated monofucosylated core 4 [m/z 1470.358]).
Conclusion: This study can facilitate the discovery of specific sialylated glycans of MBGs that might have much higher sensitivity and specificity as serum biomarkers for ASD diagnosis of children at the earliest age, which might also provide pivotal information for understanding the pathogenesis of ASD.
Autistic spectrum disorder; Maackia amurensis lectin Ii; N-glycans; O-glycans; Sialylation
ASD: Autistic Spectrum Disorder; MAL-II: Maackia amurensis Lectin II; MBGs: MAL-II Binding Glycoproteins
Alpha 2-3 sialylation on Maackia amurensis lectin II binding glycoproteins (MBGs) were increased in ASD sera.
Intact N-glycans and O-glycans were released successively from MBGs peptides and were further characterized by MALDI-TOFMS respectively.
Six sialylated or disialylated N-glycans were specifically observed in ASD sera.
The proportion of total sialylated and disialylated O-glycans were also apparently increased in ASD.
Autism Spectrum Disorder (ASD) is a lifelong neurodevelopmental disorder characterized by social deficits, impaired verbal and nonverbal communication and repetitive movements or circumscribed interests [1]. Epidemiologic studies indicate that ASD is dramatically increasing each year all over the world with social, behavioural and economical burdens [2,3].
In China, the prevalence of all forms of autism has reached one in 100 children younger than 18 years of age recently [3]. The current clinical diagnosis methods mainly depend on assessments of speech, language, intellectual abilities, and educational or vocational attainment. In practice, these methods lead to a diagnosis at an average age of 4 years, which makes behavioral intervention less effective and can generate false positive identification [4].
It has become more urgent to develop measurable serum-based biomarkers and understand the underlying pathophysiology of ASD. In the past few years, scientific interest in screening biomarkers of ASD has increased for the well-documented genetic architecture including chromosomal alterations (e.g., 15q11-q13 duplications) [5], mutations of single genes (e.g., FMR1 and MECP2) [6], rare gene mutations (e.g., NLGN3 and SHANK3) [7], and copy number variation [8]. Besides, the significant differences in trace elements (e.g., copper and zinc levels) [9], microRNA profiles [10], metabolomics [11], and proteomic (e.g., Apolipoprotein B-100 and complement factor H related protein) [12] expression in serum from ASD patients have been also well studied.
Protein glycosylation are directly involved in almost every biological process, which are potential biomarkers in many human diseases, e.g., Inflammation, Diabetes, Rheumatism, Cancer, and Neurological disorders [13]. Current serum biomarkers in clinic are almost glycoproteins; many studies found that glycoprotein specific glycans displayed higher sensitivity and specificity than protein itself for early detection of certain disease [14,15]. For example, serum prostate-specific antigen (PSA) test is the current gold standard for screening and diagnosis of prostate cancer (PCa), however detection of PSA with LacdiNAc (GalNAcβ1-4GlcNAc) structures (PSA G-index) could serve as not only an effective secondary screening method to exclude false positive diagnosis in PSA screening, but also a potential grading biomarker for PCa [16].
Thus, the convergence of glycomics and glycoproteomics is promising methods to discover potential biomarkers for the early detection of ASD. In our previous study, serum glycopattern in 65 children with ASD and 65 age-matched typically developing (TD) children were compared by using lectin microarrays, as a result, expression of Siaα2-3 Gal/GalNAc (recognized by MALII) was significantly increased in serum samples from ASD versus TD children [17]. Then the Maackia amurensis lectin-II (MAL-II) binding glycoproteins (MBGs) were collected and detected by using lectin-magnetic particle conjugate assisted LC-MS/MS analyses.
A total of 194 and 217 MGBs were identified from TD and ASD sera respectively, of which 74 proteins were specially identified or up-regulated in ASD [17]. Though the differential expression of glycopattern and MBGs are clear, little is known about the precise N- and O-glycans on sera MBGs and their potential differential expression in ASD
Along with the rapid improvement of cutting-edge separation technologies coupled with mass spectrometry in the fields of glycoproteomics and glycomics, glycoproteins and glycans can be enriched for analysis by lectin affinity [18,19], hydrazide chemistry [20,21], hydrophilic interaction [22,23], and other methods. Lectin affinity is a unique method that can isolate and identify glycoproteins/glycopeptides or glycans containing similar terminal glycan structures from complex samples. MAL II is a leguminous lectin which recognizes carbohydrate chains containing sialic acid residues linked alpha 2,3 to penultimate galactose residues (terminal Siaα2-3 Gal/Lac).
The matrix assisted laser desorption/ionization time of flight mass spectrometry (MALDI-TOF/TOF-MS) technique can provide glycan sequence, branching, and linkage (from cross-ring fragments) information. In this study, N- and O-glycans on sera MBGs from 60 children with ASD and 60 age-matched TD children were profiled using lectin-magnetic particle conjugate assisted MALDI-TOF/ TOF-MS analysis.
The similar and different expressions of N-/O- glycans are compared systematically between TD and ASD. As a result, a total of 16 representative N-glycans and 20 representative O-glycans were annotated in TD and ASD sera. Both N-glycans and O-glycans on MBGs were inclined to being more sialylated or disialylated in terminal in ASD sera than that in TD sera. The workflow is summarized in Figure 1.

Figure 1: Schematic flow diagram of the integrated strategy used Herein.
Study approval
The collection and use of human serum samples for research presented here were approved by the Ethical Committee of Xi’an Jiaotong University Health Science Center, Xi’an Children’s Hospital, the First Affiliated Hospital, and the Second Affiliated Hospital of Xi’an Jiaotong University (Xi’an, China). Written informed consent was received from parents of participants for the collection of serum. This study was conducted in accordance with the ethical guidelines of the Declaration of Helsinki.
Subjects
Sixty children with ASD and 60 age-matched TD children between 2.5 and 6 years of age were enrolled. Children in ASD group were recruited from Xi’an Children’s Hospital, the First Affiliated Hospital, and the Second Affiliated Hospital of Xi’an Jiaotong University, Xi’an, China. All children with ASD were examined by clinical experts on autism [17]. All consultants agreed on the diagnosis of ASD according to DSM-V criteria [24].The control group consisted of healthy TD children recruited from the same area to minimize the influence of different environments. ASD was evaluated with the autism diagnostic observation schedule (Table 1).
| ASD | TD | p-Value | |
| N | 60 | 60 | - |
| Males, (n) % | 36 (60.0) | 31 (51.7) | - |
| Age, yearsa | 4.0 (2.5-5.5) | 4.5 (2.5-6.0) | 0.980 |
| Gesell Development Schedule | |||
| Motor area | 89.03 ± 0.70 | 94.8 ± 15.8 | 0.254 |
| Adaptive area | 65.11 ± 15.01 | 98.10 ± 9.90 | <0.001 |
| Language area | 54.00 ± 10.05 | 98.90 ± 11.02 | <0.001 |
| Social area | 41.00 ± 8.50 | 97.40 ± 8.10 | <0.001 |
| Autism diagnostic observation schedule | |||
| A: language and communication | 10.10 ± 4.22 | ||
| B: reciprocal social interaction | 26.01 ± 5.57 | ||
| C: play | 4.9 ± 1.31 | ||
| D: stereotyped behaviors and restricted interests | 7.22 ± 1.55 | ||
| E: other abnormal behaviors | 3.48 ± 1.02 | ||
| aMedian (range) | |||
Table 1: Basic characteristics of the participants.
Sample collection and preparation
All blood samples were collected and the supernatant was prepared according to our previous protocol [17]. To normalize the differences between subjects and to tolerate individual variation, 10 μL from each sample and 15 samples in a pool were prepared to form TD-1~4 (n=60) and ASD-1~4 (n=60) subgroups to be examined by using lectin blotting. Ten microliter (10 μL) of 60 serum samples from TD and ASD groups were pooled respectively for lectin capturing and MALDI-TOF/TOF-MS detection.
SDS-PAGE and lectin blotting
For SDS-PAGE, protein samples were mixed with 5× loading buffer and boiled for 4 min at 100°C, and then separated on a 10% polyacrylamide resolving gel and a 3% stacking gel. Molecular mass standards (Thermo Scientific) were run for each gel. Gels were then stained directly with Coomassie. For lectin blotting, the proteins in gels were then transferred to a PVDF membrane (Immobilon-P; Millipore Corp., Bedford, MA) with a wet transfer unit (Hoefer Scientific) for 1.5 h at 32 mA. After transfer, the membranes were washed twice with TTBS (150 mM NaCl, 10 mM Tris-HCl, 0.05% v/v Tween 20, pH 7.5) and then blocked for 1 h with Carbo-Free Blocking Solution (Vector, Burlingame, CA) at room temperature. The membranes were then washed again and incubated with Cy5 (GE Healthcare, Buckinghamshire, UK) labeled lectins (2 μg/mL in Carbo-Free Blocking Solution) with gentle shaking overnight at 4°C in the dark. The membranes were then washed twice each for 10 min with TTBS and scanned by red fluorescence channel (635 nm excitation/650 LP emission) with the voltage of 800 PMT using a phosphorimager (Storm 840, Molecular Dynamics). The gray value was derived from Image pro-Plus 6.0.
Isolation of MBGs
Two milligrams (~30 μL, measured with Bradford reagent) of protein from TD and ASD sera were diluted in 600 μL binding buffer (0.1 M Tris-HCl, 150 mM NaCl, 1 mM CaCl2, 1 mM MgCl2, and 1 mM MnCl2, pH 7.4) supplemented with 6 μL proteinase inhibitor cocktail. MAL-II-magnetic particle conjugates (MMPCs) were prepared as described previously [25,26]. The MMPCs were rinsed three times with binding buffer, followed by incubation with diluted sera at room temperature for 1 h under gentle shaking as described. After incubation, the unbound proteins were removed by thoroughly washing three times with a washing buffer (binding buffer supplemented with 0.1% Tween 20). MMPC-bound glycoproteins were eluted with 300 μL elution buffer (0.1% SDS) at room temperature for 30 min under gentle shaking.
Reduction, alkylation, and trypsin digestion
The equal amounts of the obtained glycoproteins (about 150 μg) were denatured in 8 M urea for 30 min at room temperature. After reduction with 10 mM dithiothreitol and carboxyamidomethylation with 20 mM iodoacetamide, 150 μL proteomics grade trypsin (1:100 w/w of enzyme to protein) in 25 mM NH4HCO3 was added and incubated overnight at 37°C. The reaction was stopped with 5% glacial acetic acid (5 μL, pH <2.0). Finally, acid-treated samples were centrifuged at 13 000 × g for 10 min and the supernatants were collected and lyophilized.
Release of N-glycan by PNGase F digestion
The tryptic peptides were suspended in 100 μL NH4HCO3 solution (50 mM, pH 8.0) and incubated with PNGase F overnight at 37°C. The reaction was stopped by incubating the solution at 80°C for 5 min. Solutions containing peptides and glycans were lyophilized and resuspended in 100 μL of ultra-pure water. C18 SepPak columns were conditioned by twice washing with acetonitrile (ACN), 0.1% trifluoroacetic acid (TFA) in 50% ACN, and 0.1% TFA, sequentially. The solutions were loaded and pipetted into the column bed. The columns were eluted three times with 0.5 mL of 0.1% TFA to obtain the N-glycans. The peptides were desalted using C18 SepPak columns and lyophilized [17].
Release of O-glycans by reductive elimination
O-glycans were released from N-deglycopeptides by alkaline β-elimination in the presence of high concentrations of sodium borohydride (NaBH4) according to a previous described protocol [27]. Briefly, the resulting peptides were dissolved in 200 mL of reductive elimination solution (50 mM NaOH, 1 M NaBH4) for incubation at 45°C overnight. The reaction was stopped by dropwise addition of acetic acid until no fizzing was observed (approximately three drops).
Purification of glycans
Glycans were purified and desalted on Sepharose 4B microtubes (Sigma) [28]. The hydrophilic resin (100 μL) in the microtube was washed by centrifugation with an eluting solution (ethanol/H2O (1:1, v/v)) and a washing solution (1-butanol/ethanol/H2O (5:1:1, v/v)). The glycans were dissolved in 500 μL of the washing solution containing 1 mM MnCl2 and mixed with the sepharose resins. After gently shaking for 45 min, the resins were washed three times with washing solution. Glycans bound to the resins were eluted with 1 mL of eluting solution and lyophilized.
Characterization of glycans by MALDI-TOF/TOF-MS
The glycan mixture was dissolved in 10 μL of 50% v/v methanol, and 1 μL was spotted directly on an MTP AnchorChip var/384 (Bruker, Bremen, Germany) sample target and dried. Then an equal volume of 20 mg/mL dihydroxy-benzoicacidin in 50% v/v methanol solution was spotted to recrystallize the glycans. The target was introduced into a MALDI-TOF/TOF mass spectrometer (UltrafleXtreme, Bruker Daltonics, Germany). Ionization was performed in MS and MS/MS by irradiation of a nitrogen laser (337 nm) operating at 1 kHz.
Data were acquired at a maximum accelerating potential of 25 kV in the positive and reflectron modes. Mass calibration was performed using a peptide calibration standard (Bruker Daltonics) with 250 calibration points. A total of 1500 laser shots per pixel (200 laser shots per position of a random walk within each pixel) were collected and data were acquired using the Flex software suite (FlexControl 3.3, FlexAnalysis 3.3). The m/z data were analyzed and annotated with GlycoWork bench software [29].
By combining the information received from the fragmentation of glycan [M+H]+ and [M+Na]+ ions from the isolated glycoprotein, a complete structural characterization in terms of linkage and branching of the glycosidic bonds of oligosaccharides was achieved. Relative intensity (RI) was analyzed and generated using Flex Analysis software (Bruker Daltonics) based on MALDI-TOF-MS intensity. RI was calculated by dividing the intensity of a given type of N- or O-glycan by the total N- or O-glycan intensity, as previously described [25].
Increased expression of Siaα2-3 Gal/Lac in pooled sera from ASD compared to TD subgroups
To confirm the different abundance of terminal Siaα2-3 Gal/ Lac glycans in sera from TD and ASD, the lectin blotting was performed with MAL-II in the pooled sera from TD and ASD subgroups. The result of SDS-PAGE showed that serum samples from TD and ASD children were similar in their molecular weight and band distribution between 15 and 180 kDa (Figure 2A). The lectin blotting analysis showed a total of six apparent bands and several minor bands belonging to different molecular weight ranging from 15 to 170 kDa (Figure 2). MAL-II showed stronger binding to mainly five glycoprotein bands (red frames) between 25 and 170 kDa for ASD than TD. The gray value was calculated based on these five glycoproteins bands, which showed the significant higher expression of Siaα2-3 Gal/Lac glycans in ASD than TD sera (p<0.01) (Figure 2).

Figure 2: Binding pattern of glycoproteins from TD1-4 and ASD1-4 sera samples using MAL-II. MAL-II showed stronger binding to mainly five glycoprotein bands (red frames) between 25 and 170 kDa for ASD than TD. The gray value was calculated based on these five glycoproteins bands, which showed the significant higher expression of Siaa2-3 Gal/Lac glycans in ASD than TD sera (p<0.01).
Isolation of MBGs
Based upon the most significant increase of Siaα2-3 Gal/Lac glycans expression recognized by MAL-II in ASD sera compared to that of TD sera by lectin microarrays [17] and lectin blotting, MALII was utilized to prepare MMPCs that was optimized and applied to isolate MBGs (i.e., glycoproteins containing Siaα2-3Gal/Lac) from the pooled sera of 60 ASD children and 60 TD children respectively. In our previous paper, the isolated protein fractions were analyzed by SDS-PAGE, and sera samples from TD and ASD were similar in their molecular weight and protein bands [17]. The unbound proteins from ASD were less than that from TD, and inversely, the eluted proteins from ASD were more than that from TD [17].
Characterization of N-glycans on MBGs
The N-glycans and O-glycans released successively from MBGs peptides were characterized by MALDI-TOF-MS respectively. MALDI-TOF/TOF-MS/MS was performed to obtain detailed information regarding the substitutions and branching patterns of the monosaccharide constituents.
To ensure the reliability of the data, glycan mixtures were identified three times. A total of 7 and 11 representative N-glycan MS spectra with signal-to-noise ratios >3 were annotated using GlycoWorkbench software in TD and ASD sera respectively, which included high-mannose, complex and hybrid, di-/triantennary structures and bisecting GlcNAc glycoforms (Figure 3A and Table 2). Of these, 2 glycans (m/z 1663.581 [Hex5HexNAc4] and 1743.538 [Hex8HexNAc2]) were present in both sera, 5 glycans (e.g., m/z 1809.980 [Hex5HexNAc4dHex1] and 1905.918 [Hex9HexNAc2]) were specifically observed in TD sera and 9 glycans (e.g., m/z 1938.624 [Hex4HexNAc4NeuAc1dHex1] and 2059.396 [Hex6HexNAc3NeuAc1dHex1]) were specifically observed in ASD sera.

Figure 3: MALDI-TOF/TOF-MS spectra of N-glycans on MBGs in TD and ASD sera. A. Detailed glycan structures were analyzed using the GlycoWorkbench software. Proposed structures and their m/z values were shown for each peak.  = GlcNAc
  Man
Man  =Gal
=Gal  GalNAc
  Fuc
Fuc  =NeuAc = NeuGc. B. MALDI-TOF/TOF-MS/MS analysis of N-glycan precursor ions in MS spectra f rom TD o r ASD sera. Precursor ions w ere subjected to MS/MS a nalysis to o btain cleavages, i ncluding B , Y, C , and Z glycosidic cleavages and A and X cross-ring cleavages. Structures of cleavage ions and m/z values are shown in tandem mass spectra. Three major N-glycan peaks are indicated: m/z 1905.918, m/z 1938.624, and m/z 2061.356.
| No. | Calculated m/z | Experimental m/z | Glycan structure | Relative intensity | ||||
|---|---|---|---|---|---|---|---|---|
| TD | ASD | |||||||
| TD | ASD | Average | CV% | Average | CV% | |||
| 1 | 1663.581 | 1663.921 | 1663.679 | 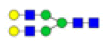 |
1.000 | 9% | ND | ND |
| 2 | 1743.538 | 1743.882 | 1744.032 | 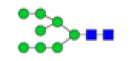 |
0.724 | 13% | ND | ND |
| 3 | 1779.629 | 1780.338 | ND | 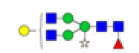 |
0.103 | 34% | ND | ND |
| 4 | 1809.639 | 1809.980 | ND | 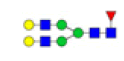 |
0.263 | 41% | ND | ND |
| 5 | 1905.634 | 1905.918 | ND | 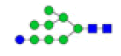 |
0.462 | 6% | ND | ND |
| 6 | 1938.682 | ND | 1938.624 | 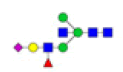 |
ND | ND | 0.632 | 8% |
| 7 | 2028.714 | 2028.925 | ND | 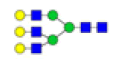 |
0.078 | 60% | ND | ND |
| 8 | 2037.683 | ND | 2037.639 | 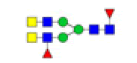 |
ND | ND | 1.000 | 11% |
| 9 | 2059.708 | ND | 2059.396 | 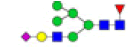 |
ND | ND | 0.550 | 12% |
| 10 | 2061.738 | ND | 2061.356 |  |
ND | ND | 0.266 | 6% |
| 11 | 2069.740 | ND | 2069.556 | 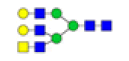 |
ND | ND | 0.825 | 39% |
| 12 | 2190.766 | ND | 2190.212 | 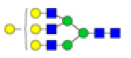 |
ND | ND | 0.665 | 17% |
| 13 | 2207.758 | ND | 2207.375 | |
ND | ND | 0.756 | 34% |
| 14 | 2288.840 | 2289.594 | ND | 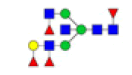 |
0.243 | 31% | ND | ND |
| 15 | 2532.921 | ND | 2532.783 | 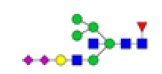 |
ND | ND | 0.128 | 9% |
| 16 | 2631.990 | ND | 2631.522 | 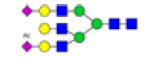 |
ND | ND | 0.498 | 22% |
| CV: Coefficient of Variation; ND: Not Detected in the samples. | ||||||||
Table 2: Proposed structures and their molecular ions in MALDI spectra of N-glycans from TD and ASD sera
Importantly, there was hardly any sialylated glycans detected in TD, but 6 glycans (55%) were annotated as sialylated or disialylated glycans referring to Siaα2-6Gal/Lac structure in ASD. Besides, 5 of 7 N-glycan peaks (71%) were present less than m/z 2000 in TD, while 8 of 11 N-glycan peaks (73%) were present more than m/z 2000 in ASD. The MS/MS spectra of the precursor ions m/z 1905.918, 1938.624, and 2061.356 were illustrated in Fig. 3B. Overall, N-glycans on MBGs from ASD sera were inclined to containing more carbohydrate residues and being sialylated in terminal.
Characterization of O-glycans on MBGs
Twenty O-glycans derived from core structures 1, 2, 3, and 4, containing Siaα2-3GalNAc, Siaα2-3Gal/Lac, and Siaα2-3Galβ1-3GalNAcα, were identified in the sera, of which 9 were present in both sera (eg., m/z 933.317 [Hex3HexNAc2], m/z 1199.921 [Hex2HexNAc2NeuAc1S2], and m/z 1331.473 [Hex2HexNAc2NeuAc2]), glycan m/z 1485.363 [Hex3HexNAc3NeuAc1S1] was specifically observed in TD sera, and 10 (e.g., m/z 1152.142 [Hex2HexNAc1NeuAc1dHex2], m/z 1396.189 [Hex1HexNAc3NeuAc1dHex2], and m/z 1527.422 [Hex3HexNAc3NeuAc1dHex1]) were specifically observed in ASD sera (Figure 4A and Table 3). To reveal the alteration of sera O-glycan profiles of MBGs in ASD versus TD, the relative intensities (RIs) of O-glycans in ASD were compared based upon fold changes (foldchange >2.0, or <0.5) with that in TD group, respectively.
| No. | Calculated m/z | Experimental m/z |
Glycan structure | Relative intensity | Expression change | ||||
|---|---|---|---|---|---|---|---|---|---|
| TD | ASD | ||||||||
| TD | ASD | Average | CV% | Average | CV% | ||||
| 1 | 843.285 | ND | 843.821 |  |
ND | ND | 0.600 | 13% | Up |
| 2 | 933.317 | 933.865 | 934.014 |  |
1 | 8% | 0.592 | 18% | NC |
| 3 | 1136.396 | ND | 1137.140 |  |
ND | ND | 0.403 | 10% | Up |
| 4 | 1151.396 | ND | 1152.142 |  |
ND | ND | 0.531 | 16% | Up |
| 5 | 1155.441 | 1155.906 | 1156.098 |  |
0.578 | 11% | 0.378 | 32% | NC |
| 6 | 1199.921 | 1199.921 | 1200.123 |  |
0.631 | 27% | 0.506 | 23% | NC |
| 7 | 1243.457 | 1243.986 | 1244.172 |  |
0.781 | 15% | 0.496 | 19% | NC |
| 8 | 1282.454 | ND | 1283.179 |  |
ND | ND | 1 | 22% | Up |
| 9 | 1288.374 | 1287.999 | 1288.219 |  |
0.710 | 11% | 0.844 | 0% | NC |
| 10 | 1331.473 | 1332.063 | 1332.219 |  |
0.721 | 6% | 0.645 | 11% | NC |
| 11 | 1337.422 | ND | 1338.258 |  |
ND | ND | 0.581 | 19% | Up |
| 12 | 1376.267 | 1376.092 | 1375.738 |  |
0.753 | 21% | 0.370 | 1% | Down |
| 13 | 1395.502 | ND | 1396.189 | 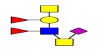 |
ND | ND | 0.794 | 5% | Up |
| 14 | 1419.433 | 1419.962 | 1419.909 | 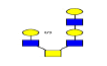 |
0.811 | 15% | 0.252 | 31% | Down |
| 15 | 1463.552 | 1464.155 | 1464.115 |  |
0.522 | 37% | 0.308 | 11% | NC |
| 16 | 1469.472 | ND | 1470.358 |  |
ND | ND | 0.586 | 12% | Up |
| 17 | 1485.467 | 1485.363 | ND |  |
0.512 | 27% | ND | ND | Down |
| 18 | 1526.493 | ND | 1527.422 |  |
ND | ND | 0.419 | 19% | Up |
| 19 | 1551.568 | ND | 1552.081 |  |
ND | ND | 0.210 | 47% | Up |
| 20 | 1557.488 | ND | 1558.455 |  |
ND | ND | 0.401 | 31% | Up |
| CV: Coefficient of Variation; ND: Not Detected in the samples; NC: No Change between TD and ASD. | |||||||||
Table 3: Proposed structures and their molecular ions in MALDI spectra of O-glycans from TD and ASD sera.
As a result, 10 O-glycans were higher expressed (e.g., m/z 1152.142 [Hex2HexNAc1NeuAc1dHex2]) and 4 O-glycans were lower expressed (e.g., m/z 1419.433 [Hex3HexNAc4S1]) in ASD than that in TD (Table 3 Proposed structures and their molecular ions in MALDI spectra of O-glycans from TD). Relative variation of the major types of O-glycans on MBGs is summarized in Table 4. The proportion of core 2 structures was the highest in both TD (60.0%) and ASD (47.4%) group, respectively. Core 1 and its sialylated structures were almost similar between TD and ASD groups. Proportions of core 2 and 4 glycans were decreased but their sialylated structures were increased in ASD sera. All core 3 glycans were sialylated that were specially expressed in ASD. Overall, the proportion of total sialylated and disialylated O-glycans were apparently increased in ASD (63.2% and 15.8%) compared to that in TD respectively. The MS/MS spectra of the precursor ions m/z 1332.219 and 1470.358 were illustrated in Figure 4B.

Figure 4: MALDI-TOF/TOF-MS spectra of O-glycans on MBGs in TD and ASD sera. A. Detailed glycan structures were analyzed
using the GlycoWorkbench software. Proposed structures and their m/z values were shown for each peak. = GlcNAc =Gal
=GalNAc =Fuc =NeuAc = NeuGc. B. MALDI-TOF/TOF-MS/MS analysis of O-glycan precursor ions in MS spectra from TD or ASD sera. Precursor ions were subjected to MS/MS analysis to obtain cleavages, including B, Y, C, and Z glycosidic cleavages
and A and X cross-ring cleavages. Structures of cleavage ions and m/z values are shown in tandem mass spectra. Three major Oglycan
peaks are indicated: m/z 1332.219 and m/z 1470.358.
| Structure | TD | ASD | ||
|---|---|---|---|---|
| Total | Sialylateda | Total | Sialylateda | |
| Core 1 | 1 (10.0%) | 1 (100%) | 2 (10.5%) | 2 (100%) |
| Core 2 | 6 (60.0%) | 3 (50%) | 9 (47.4%) | 5 (55.6%) |
| Core 3 | 0 (0) | 0 | 3 (15.8%) | 3 (100%) |
| Core 4 | 3 (30.0%) | 1 (33.3%) | 5 (26.3%) | 2 (40%) |
| Sialylated | 5 (50.5%) | - | 12 (63.2%) | - |
| Disialylated | 1 (10.0%) | - | 3 (15.8%) | - |
| aThe proportion of sialylated O-glycans was calculated based on the number of glycans derived from Core 1-4, respectively. | ||||
Table 4: Relative variation of the major types of O- glycans in TD and ASD sera.
Sialic acids are nine-carbon monosaccharides at the terminal position of oligosaccharides on the cell surface that are involved in cell metabolism [30], signal transduction [31,32], and tumor proliferation, invasion, and angiogenesis [33,34]. In humans, sialylation, the transfer of sialic acids (SAs) from GMP-SA to an acceptor carbohydrate, is a process catalyzed by different STs based on their linkage and acceptor molecule, which includes an α2-3- or an α2-6-bond to galactose (Gal), an α2-6-bond to N-acetylgalactosamine (GalNAc) or N-acetylglucosamine (GlcNAc), and an α2-8-bond to another SA, to control the synthesis of specific sialylated structures with unique biological roles. MALII is a teramer that is composed of a 33-kDa subunit, and binds preferentially to α2-3-linked sialylated O-glycans [35].
In the present study, MAL-II-magnetic particle conjugates (MMPCs) were prepared and utilized to enrich MBGs which were confirmed to be differently expressed in ASD sera according to our previous study [17]. A total of 16 N-glycans and 21 O-glycans were annotated in this study. Among these, α2-3 sialylated O-glycans were targets that MAL-II recognized on MBGs. N-glycans and other O-glycans were released and identified incidentally in this study. Even so, both the absolute glycan numbers and the proportions of different glycan types revealed that either N-glycans or O-glycans on MBGs were inclined to be high sialylated or disialylated in terminal in ASD versus TD (Figures 3 and 4), which implied the significant function of sialylation in ASD. In general, total serum sialylation levels appear to be increased with various malignancies and show a potential for clinical disease monitoring and prognosis [36,37]. Therefore, it is important and necessary to stress that sialylated glycoprofiling of specific cancer- [37] or ASD-associated glycoproteins in serum would be more accurate for disease diagnosis than overall sialic acid levels as biomarkers.
In our previous study, a total of 194 and 217 MGBs were identified from TD and ASD sera using LC-MS/MS analysis, respectively, of which 74 proteins were specially identified or up-regulated in ASD. Thereinto, expression of APOD was no changed between ASD samples and TD samples but its α2-3 linked sialoglycosylation was significantly increased in ASD samples relative to TD samples (p= 0.004).
ROC curve analysis revealed that serum levels of α 2-3 sialoglycosylated APOD resulted in an AUC of 0.88, with a specificity of 86.7% and a sensitivity of 80.6% for differentiating ASD from TD [17]. In this study, the equal amounts of the MBGs were used to release N- and O-glycans in ASD and TD sera respectively, regardless of the enrichment of hundreds of individual MBG in ASD and TD sera. The aim was to systematically compare similar and different expressions of N-/O- glycans on MBGs between TD and ASD, which might avail to speculate the potential changes in expressions or activities of enzymes related to sialylation in ASD via the overall trend of MBGs sialylation alteration in TD vs. ASD sera.
Sialyltransferases are enzymes that add sialic acid to the terminal portions of the sialylated glycolipids (gangliosides) or to the N- or O-linked sugar chains of glycoproteins. CMP-N-acetylneuraminatebeta- galactosamide-alpha- 2,3-sialyltransferase 1 (ST3GAL1) is responsible for the synthesis of the sequence NeuAc-alpha-2,3- Gal-beta-1,3- GalNAc found on sugar chains O-linked to Thr or Ser [38]. Beta-galactoside alpha-2,6-sialyltransferase 1 (ST6Gal1) is sialyltransferases which preferentially transfer sialic acid from CMPsialic acid to galactose-containing N-glycan acceptor substrates [38].
According to the MS results, both α2-3-linked sialylated O-glycans and α2-6-linked sialylated N-glycans were increased on MBGs in ASD. Upon the open data provided by the consortium for functional glycomics (CFG) website, ST3GAL1-deficient mice (20% vs. 22% “won”) and ST6Gal1-deficient mice (30% vs. 57% “won”, p=0.057) were subordinate vs. wild-type mice respectively in the social dominance tube test [39,40], which mean both ST3GAL1 null mice and ST6Gal1 null mice displayed a ASDlike behavior. The neural cell adhesion molecule (NCAM) is a glycoprotein implicated in cell-cell adhesion, neurite outgrowth and synaptic plasticity. Polysialic acid (polySia) is mainly attached to NCAM (polySia-NCAM) and has an essential role in regulating NCAM-dependent developmental processes that require plasticity, that is, cell migration, axon guidance and synapse formation. PolySia-NCAM serum levels were increased in SZ patients, which were associated with decreased volume in the left prefrontal cortex, namely Brodmann area 46, in patients and increased volume in the same brain area of healthy individuals.
The data indicate that polySia-NCAM deserves further scrutiny because of its possible role in early neurodevelopmental mechanisms of the disorder [41]. In this study, two peaks of N-glycans, i.e., m/z 2207.375 and 2532.783, that were polysialic acid structure, were specific identified in ASD serum and might partially explain the pathogenesis of ASD. In short, sialylation definitely played important roles in ASD, however two elements should be considered. First, increase or decrease of sialylation (i.e., abnormal sialylation) was likely to relate to ASD but the exact mechanisms involved should be further studied. Second, increased sialylation of N-/O-glycans on serum MBGs might be serological marker for ASD, which was not contradictory with the decreased expression of sialyltransferases and desialylation of glycoproteins in certain tissues or cells that might affect the neural development and as a result display ASD-like behaviors in mouse.
Our previous study found that hepatic asialoglycoprotein receptor [Ashwell-Morell receptor (AMR)] promoted preferential adherence to and phagocytosis of desialylated and/or HC C1galt1-/- platelets by the Kupffer cell through its C-type lectin receptor CLEC4F [42], which demonstrated that functions of sialylation and desialylation of glycans were various based upon different glycoproteins, cells, tissues, organs, and species.
For the past few years, a variety of methods for the detection of sialic acids bound to glycoproteins or glycolipids have been performed [37,43,44]. Mass spectrometry has become one of the most important technologies for glycan analysis. It offers sensitivity, high accuracy, tolerance for the sample impurity, and compatibility with various separation techniques. MALDI-TOF-MS has become a major approach for glycan profiling of human serum (in highthroughput manner) and identifying sialylated glycoproteins.
However, the cleavage of the sialic acid moiety by in- and postsource decay can cause biases in the determination of sialylated glycans by MALDI-MS. Many chemical derivatization methods were introduced to stabilize the sialylated glycan during MALDIMS analysis including permethylation [45], esterification [46,47], amidation [48], methylamidation [49] and dimethylamidation [50] and have increased the sensitivity of detection and the stability of sialic acids. In the present study, native N- and O-glycans without any chemical modification were identified using MALDI-TOF/ TOF-MS to display not only sialylated glycans but also all glycans released from MBGs. So, there was the possibility of missing a small amount of terminal sialic acid at these glycans, which can be further studied by employing appropriate chemical methods.
In conclusion, a total of 16 representative N-glycans including high-mannose, complex and hybrid, di-/tri-antennary structures and bisecting GlcNAc glycoforms and 21 representative O-glycans derived from core structures 1, 2, 3, and 4, containing Siaα2- 3GalNAc, Siaα2-3Gal/Lac, and Siaα2-3Galβ1-3GalNAcα were annotated in TD and ASD sera. Among these, 9 N-glycans were specifically observed in ASD sera. Ten O-glycans were higher expressed and 4 O-glycans were lower expressed in ASD than that in TD.
Interestingly and importantly, both N-glycans and O-glycans on MBGs were inclined to being more sialylated or disialylated in terminal in ASD sera than that in TD sera, for examples, m/z 2061.356 and m/z 1338.258 were specially observed in ASD sera, which might be potential glycan biomarkers for ASD diagnosis. This study can facilitate the discovery of novel glycan biomarkers for ASD diagnosis of children at the earliest age based on precise alterations of N- and O-glycans of MGBs in serum, which might also provide pivotal information for understanding the pathogenesis of ASD.
This work is supported by National Natural Science Foundation of Shaanxi Province of China (Grant No. 2017JM8112).
The authors declare that they have no conflicts of interest.
Citation: Qin Y, Chen Y, Yang G, Zhao L, Shi Z, et al. (2019) Increased Sialylation of N- and O-Glycans on Serum Maackia amurensis Lectin II Binding Glycoproteins in Autistic Spectrum Disorder. J Glycobiol 8:137.
Received: 25-Nov-2018 Accepted: 26-Apr-2019 Published: 03-May-2019
Copyright: © 2019 Qin Y, et al. This is an open-access article distributed under the terms of the Creative Commons Attribution License, which permits unrestricted use, distribution, and reproduction in any medium, provided the original author and source are credited.
Competing interests: The authors have declared that no competing interests exist.
Sources of funding : This work is supported by National Natural Science Foundation of Shaanxi Province of China (Grant No. 2017JM8112).