Journal of Pollution Effects & Control
Open Access
ISSN: 2375-4397
ISSN: 2375-4397
Research Article - (2015) Volume 3, Issue 2
Ground-based ambient air monitoring was conducted at five different locations in Mandi-Gobindgarh (critically polluted area), Punjab, in order to determine the impact of stubble burning on the concentration of Particulate Matter (PM) in ambient air for one rice crop season (October 2012 to January 2013) and one wheat crop season (March 2013 to May 2013). The concentration of PM10 and PM2.5 in the ambient air was found to be more for industrial site as compared to other agricultural and mixed land use sites. Concentration of PM was found to be more in winters than in summers. The impact of stubble burning on the ambient air quality was found to be more for agricultural site (S1) when compared to other sites with an appreciable increase in concentration of PM10 and PM2.5 respectively during the paddy harvesting period and during wheat harvesting period. In general, the concentration of PM10 was significantly higher than PM2.5 and both the concentrations were beyond the prescribed limits in the ambient air. Total concentration of water soluble ionic species were found in the order of wheat pre-harvesting period
Keywords: Ambient air quality; Crop residue burning; PM10; PM2.5; Water soluble ionic species
Ambient air pollution is of great concern now a day due to its damaging effect on human health and property. According to CPCB (2011) [1], the environment of Mandi-Gobindgarh has degraded a lot during the last few years due to extensive industrialization. The Cumulative Environmental Pollution Index (CEPI) for Mandi- Gobindgarh with respect to air was calculated to be 62, on the basis of which, Mandi-Gobindgarh was declared as critically polluted area. Apart from industrial and vehicular emissions, crop residue burning in agricultural fields is also one of the main reasons for the deterioration of the ambient air quality of Mandi-Gobindgarh. In India, rice is generally sown during June and harvested during October-November and wheat is sown immediately after rice harvesting during the months of November-December. To prepare the fields for the subsequent crop to be sown, crop residue burning is done for clearing the land of stubble and weeds. Stubble burning is a cheapest and less time consuming method, but it is an important source of emission of Particulate Matter (PM) and gaseous pollutants like CO2, CH4, CO, N2O, NOx and SO2 into ambient air. In stubble burning, all the emissions are fugitive and smoke escapes through unplanned exit passages in the downwind direction. Particulates in the air are classified into aerodynamic diameter size and chemical composition. Particulate Matter (PM) is generally measured in terms of the mass concentration of particles within certain size classes: PM10 or coarse (with an aerodynamic diameter of less than 10 micron) and PM2.5 or fine (with an aerodynamic diameter of less than 2.5 micron). PM2.5 has a greater residing time in air when compared to PM10 because of the balance between the downward acting force of gravity and aerodynamic drag force. Particulates are the main component of air pollution and its harm to human body has already been proved by epidemiology. The extent of particulate’s harm is pertinent to the aerodynamic diameter, chemical composition and the category of the emission sources. Limited studies on emissions from open burning of crop residue, especially in an industrial area have been reported. In the survey of Gao et al. [2], on an average, only 6.6% of the crop residue was burned in the fields and 36.6% of the crop residue was returned to the soil directly. It has been reported by Yang et al. that many pollutants are released because of crop residue burning in China, resulting in serious pollution of ambient air. About 82% of wheat straw and 37% of rice straw were burned in the field, so the proportion of crop residue burned in the field was about 43%. The daily average concentration of PM10 kept exceeding 0.250 mg m-3. Guoliang et al. noted that wheat straw had the top emission factor for the total PM (8.75 g kg-1) among the four crop residues, while, highest emission factor of corn stover as well as wheat straw for Elemental Carbon (EC) was 0.95 g kg-1 while organic carbon (OC) was 3.46 g kg-1 respectively. The impact of spatiotemporal characteristics on ambient air-quality attributed to open burning of rice straw was assessed and it was reported that the average hourly incremental concentrations between the episode and non-episodes were greater than 300 mg m-3 for PM10 [3]. It was estimated that the spatial and temporal distribution of emissions from rice field residue burning during the period (1998-2009) in Thailand by Cheewaphongphan et al., using questionnaire survey and field experiment. The annual average amount of burned area was estimated as 4.7 Mha and the average annual amount of burned rice residue is about 21.7 Mt. About 62 percent of overall burned residue was the major rice residue and 38 percent was the minor rice residue. Groundbased ambient air monitoring at five different locations in and around Patiala city was conducted by Singh et al. [4] in order to determine the impact of open burning of rice crop residues on concentration levels of SPM, SO2 and NO2 in the ambient air. Substantially higher concentrations were recorded at the commercial area site as compared to the other sampling sites for all the targeted air pollutants, Awasthi et al. [5] studied the size segregated mass distribution of RSPM for two wheat and three rice crop seasons using eight staged impactor at rural and agricultural sites of Patiala (India) where the RSPM levels remained close to the National Ambient Air quality standards (NAAQS). The levels of PM10, PM2.5 and PM10-2.5 were increased by 66%, 78% and 71% during rice crop residue burning and 51%, 43% and 61% during wheat crop residue burning, respectively, Singh and Panigrahy [6] studied the spatiotemporal occurrence of agricultural residues burning in Indo- Gangetic plains of India using fire products from space borne satellites. The fire incidents were reported to be very high in October-December (55%) compared to that in March-May (36%), indicating that burning of rice residue is more prevalent than that of wheat residue burning. The burning of biomass and its effect on atmospheric quality and climate was conducted by Tripathi et al. [7] and they suggested some management options for disposal of crop residue besides burning, Gupta et al. [8] studied the type as well as amount of air pollutants in industrial town of Mandi-Gobindgarh along with surrounding areas and reported that the cause of urban air pollution is excessive suspended particles in the air, whereas, in rural areas, air is polluted by particulate matter, CO2, NOx from stubble burning, tractors, tube wells run on diesel generators, etc. Keeping this in view, the present study aims to investigate the effect of crop residue burning on the ambient air quality of Mandi-Gobindgarh. The study was carried out by measuring concentration of PM10 and PM2.5 for one paddy and one wheat season at selected sampling sites.
Description of a study area
Mandi-Gobindgarh is a town and a municipal committee in district Fatehgarh Sahib in the state of Punjab, India and is also known as ‘Steel town of India’ as various categories of steel manufacturing units is operating in this town. This town is located on national highway-I and spread over an area of 10.64 Sq. Kms that accommodates a population of 55,416 as per 2001 census. Geographically, Mandi-Gobindgarh falls in between north latitude 30°37’30”-30°42’30” and east longitude 76°- 15’-76°-20’ and it shares common boundaries with several districts such as Mohali, Patiala, Ludhiana and Rupnagar. There are 510 (i.e. 404 in Mandi-Gobindgarh and 106 in Khanna area) air polluting industries in Mandi-Gobindgarh which are using coal/furnace oil as fuel in their furnaces emitting the various air pollutants, besides the fugitive emissions [9].
Selection of sampling sites
On the basis of land use, demography and industrial clusters, five sampling sites were selected. The population of the Mandi-Gobindgarh city is 60,677 as per 2001 census. Punjab Pollution Control Board has identified eight industrial clusters within the jurisdiction of critically polluted area of Mandi-Gobindgarh and Khanna area. Out of total area of 9 sq.km, 33.74% is occupied by industrial use, 31.49% by residential use, 13.68% by traffic & transportation & 10.66% by agriculture.
The five sampling sites selected were: Site 1 (Agri Site, is an agricultural area, which is 20 kms South-East Mandi Gobindgarh bus stand. The site is a broad open area with no side buildings (30°34’23.16”N, 76°21’47.43”E). Site 2 (ind site), is designated as an industrial focal point which is 2 kms South-West from Mandi Gobindgarh bus stand. This area is less populated as land use of the area is totally industrial 30°38’34.97”N, 76°18’27.03”E). Site 3 (mixedland use site), is Guru ki nagri which is South-East on GT road from Mandi Gobindgarh bus stand. It is a semi- urban site, having mixed land use comprising of industrial, residential and agricultural area (30°40’18.77”N, 76°17’38.29”E). Site 4 (mixed land use site), is an area on national highway 1, with huge vehicular emissions. The site is a broad open area with no side buildings and it is a mixed land use area (30°39’5.91”N, 76°19’24.53”E). Site 5 (mixed land use site), is a partially industrialized area near Saliani village, 2 kms North from Amloh Chowk. It represents a site with major proportion of agriculture and to small extent industrial use (30°38’45.86”N, 76°16’1.97”E).
Instruments
Ambient fine dust sampler: Ambient fine dust sampler, model no. IPM-FDS-2.5 μ/10 μ of INSTRUMEX is an advanced sampler for measurement of PM2.5/10 in ambient air and it conforms to the USEPA and CPCB norms. This sampler uses a set of impactors standardized by USEPA to separate coarse particulates from the air stream. For sampling of PM10, PM10 impactor assembly was used with a filter paper of Whatman number 1820-047 having 47 mm diameter while, or PM2.5 sampling, particles with aerodynamic diameter larger than 10 microns are trapped by using the opposed jet impaction over a filter paper of specified Whatman number 7582-004 having 37 mm diameter supported on surface by silicon oil and those having a diameter between 2.5 and 10 microns were trapped over PTFE filters having diameter 46.2 mm, using the WINS Impactor.
Weather monitoring station: The weather monitoring station used in this study was Watch Dog of Spectrum Series 2000. The Watch Dog weather station is a multifunction device to detect as well as to store seven parameters including wind speed, wind direction, temperature, relative humidity, dew point, pressure and solar radiations using different sensor for each. The site for installation of weather monitoring station should be an open area with no obstruction to ensure accurate measurement of wind speed and direction. So for this study, the site selected was Thapar university (30°35’39”N, 76°37’07”E), Patiala as it is near to a study area.
Ion chromatograph: Ion Chromatograph from Metrohm and Dionex was used for the analysis of water soluble ions. Metrohm-761 IC is equipped with Shodex SI-90 4E column, and an eluent of 1.8 mM Na2CO3+1.7 mM NaHCO3 is used for anionic determination. Cations are isolated on a Shodex YK-421 column with an eluent of 4 mM H3PO4. The anionic-IC is equipped with a suppressor, and 4 mM H2SO4 solution is used to regenerate suppressor.
Wind rose plot software: In order to plot wind rose diagrams, Wind Rose PRO software was used. In wind rose, length of arm represents the frequency of a specific wind direction and its position on polar coordinate represents wind direction. The number of arms can be decided by user, which may be 4, 8, 16 and maximum of 360. The wind data was collected for the period September 2012 to May 2013 for making wind roses in order to assess the dispersive capacity of atmosphere. Wind roses were plotted from the wind speed and direction, collected for the period of nine months by weather monitoring station. During the study period, the predominant wind direction was western wind i.e. winds blowing from west to east direction (Figure 1).
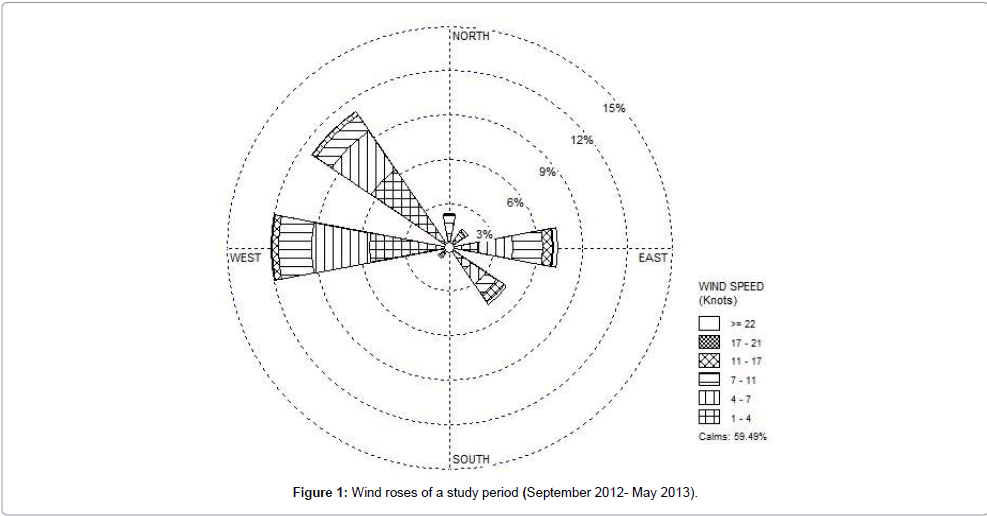
Figure 1: Wind roses of a study period (September 2012- May 2013).
Measurement of PM10 and PM2.5: Sampling of PM10 and PM2.5 was carried out for rice and wheat harvesting period starting from September 2012 to May 2013, at all the five selected sites using ambient fine dust sampler. The flow is controlled by microprocessor based flow controller for maintaining the flow rate constant at 16.67 LPM. It was installed in an open area at each individual sampling site for 24 hrs. Each new blank filter was conditioned over dried silica gel, prior to use, in a desiccator for 24 hrs and weighed at room temperature (25°C). Preinspected and weighed new blank filters were placed into the sampling device for continuous sampling. After 24 hrs of sampling, an exposed filter paper was reweighed; data is retrieve from the instrument to get initial and final flow rate for each sample and the concentration of PM10 and PM2.5 was calculated using following equation:
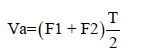
Calculation of the volume of air sampled
 (1)
(1)
Where, Va is volume of air sampled in m3, F1 is measured flow rate before sampling in LPM, F2 is measured flow rate after sampling in LPM, T is time of sampling.
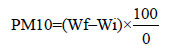
PM10 concentration was calculated by
 (2)
(2)
Where, PM10 is Total mass concentration of PM10 collected during the sampling period in μg m-3, Wf, Wi is Final and Initial mass of glass fibre filter paper in mg, Va is Total air volume sampled in m3.
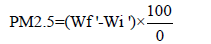
PM2.5 concentration was calculated by:
 (3)
(3)
Where, PM2.5 is Total mass concentration of PM2.5 collected during the sampling period in μg m-3, Wf ’, Wi is Final and Initial mass of PTFE filter paper in mg, Va is Total air volume sampled in m3. ’
Ion chromatography: Ion Chromatography (IC) was especially desirable for particle samples because it provides results for several ions with a single analysis and it uses a small portion of the filter extract with low detection limits. Ion analysis methods require a fraction of the filter to be extracted in double distilled water and then filtered to remove an insoluble residue prior to analysis. Each square centimeter of filters were extracted in not more than 2 ml of solvent for sampler flow rates of 16.7 L/min and sample durations of 24 hrs. Small amounts of wetting agents (or ethanol) were added to the filter surface to aid the wetting of hydrophobic filter materials. The filter section was placed in an extraction vial which was capable of allowing it to be fully immersed in ~10 ml of solvent. Each vial was properly labelled with the sample number. Agitation was needed to extract the water soluble particles into the solution. Since much of the deposit was there inside a fibre filter, sonication was employed for 1 hr, shaking for 1 hr, and aging under refrigeration for about 12 hrs assured complete extraction of the deposited material in the solvent. After extraction, the solutions were stored under refrigeration prior to analysis. The sample extracted was passed through an Ion-exchange column to separates the ions for individual quantification. Prior to detection, the column effluent entered a suppressor column where the chemical composition of one element was altered, which resulted in a matrix of low conductivity. The ions were identified by their elution/retention times and were quantified by the conductivity peak area or peak height.
Mandi-Gobindgarh being an industrial hub, suffer from severe air pollution owing to both extensive industrial and agricultural practices, which has detrimental impact on the ambient air quality. In order to establish the impact of agricultural residue burning on the ambient air quality, the study on particulate matter (PM) was conducted at five specified locations during the rice and wheat harvesting period. The total time period of monitoring has been categorized as pre-harvesting period (September, 2012 for rice and February to March, 2013 for wheat), harvesting period (October-November, 2012 for rice and April, 2013 for wheat) and post-harvesting period (December, 2012 to January, 2013 for rice and May, 2013 for wheat).
Impact of paddy harvesting
In order to adjudge the impact of paddy crop residue burning on air quality, the concentration of PM10 and PM2.5 were plotted against three sampling periods i.e. pre-harvesting, harvesting and postharvesting for all the five sampling sites and are shown in Figures 2a and 2b respectively. The concentration of PM10 was more than PM2.5 for all the sites and the concentration of PM was more at site 2 (ind site) because of the presence of large number of steel industry, emitting fugitive emissions. During harvesting period, there was an increase of 86.7% and 53.2% in PM10 and PM2.5 respectively when compared to pre-harvesting period for agri site (S1). This substantial increase in PM concentration is attributed to stubble burning in the open field. For post-harvesting period, there was an increase of 66.6% and 5.5% in PM10 and PM2.5 concentration respectively, when compared to preharvesting period whereas, reduction of 10.7% and 30.9% in PM10 and PM2.5 concentration respectively, when compared to harvesting period. The pollutant concentration for post-harvesting is lesser than harvesting period because of two reasons, first, because of less stubble burning impact and secondly, due to dispersion of pollutants to North- West direction owing to wind movement as depicted by wind rose diagram. At ind Site (S2), PM10 and PM2.5 concentration were much higher than site 1 even during pre-harvesting period, due to release of industrial emissions. During harvesting period, there was an increase of 33.3% and 31.1% concentration of PM10 and PM2.5 as compared to preharvesting period, owing to open field burning of paddy crop residue. For post-harvesting period, there was an increase of 20% and 18.7% in concentration PM10 and PM2.5 respectively, when compared to preharvesting period whereas, reduction of 10.0% and 9.5% in PM10 and PM2.5 concentration respectively, when compared to harvesting period. The increase in PM10 and PM2.5 concentrations during harvesting period is lesser because of the prevalence of low area under agricultural use. At other three mixed-land use sites, similar trend was observed i.e. concentrations of PM10 and PM2.5 during post-harvesting period is less than harvesting period but more than pre-harvesting period, which clearly substantiate that stubble burning is deteriorating the ambient air.
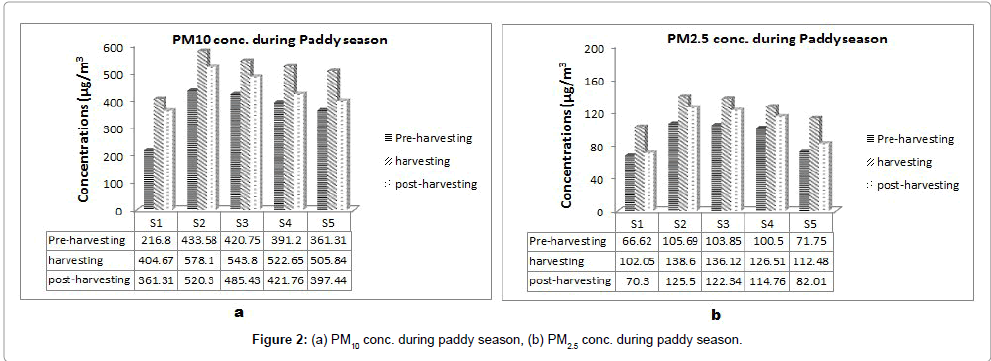
Figure 2: PM10 conc. during paddy season, (b) PM2.5 conc. during paddy season.
Impacts of wheat harvesting
Similarly, the impact of wheat crop residue burning on ambient air quality was assessed by measuring the concentrations of PM10 and PM2.5 for three sampling periods i.e. pre-harvesting, harvesting and post-harvesting at all the five sampling sites as shown in Figures 3a and 3b respectively. The Agri site (S1) showed increase of 60.4% and 33.1% in concentration of PM10 and PM2.5 respectively during harvesting period, when compared to pre-harvesting period. This substantial increase in PM10 and PM2.5 concentration was attributed to stubble burning. Whereas, results for post-harvesting period show that the concentration of PM10 and PM2.5 increase by 35.3% and 19.2% respectively, when compared to pre-harvesting period, and reduction of 15.7% and 10.4% respectively when compared to harvesting period because of the dispersion of pollutants owing to wind movement to North-East direction. Winds coming from North-West were already polluted from industrial emissions, which further increased the PM10 and PM2.5 concentration level at site 1. PM10 and PM2.5 concentration at ind site were much higher than at site 1, due to enhanced emission by industrial sources. During harvesting period, there was an increase of 23.7% and 9.5% concentration of PM10 and PM2.5 respectively, when compared to pre-harvesting period. While, for post-harvesting period, there was an increase of 20.24% and 2.4% in concentration of PM10 and PM2.5 respectively, when compared to pre-harvesting period, and reduction in concentration of 2.8% and 6.4% in PM10 and PM2.5 respectively, as compared to harvesting period. The increase in PM concentration after stubble burning at site S2 was found to be less because of less area available for agriculture. At other three mixed-land use sites, similar trend was observed. Out of all the sites, maximum increase in PM10 and PM2.5 concentration, were observed to be at Agri Site for both paddy and wheat crop harvesting periods, which manifests the fact that ambient air quality is deteriorating due to stubble burning. Concentration of PM was observed to be more in winter months as compared to summers which may be attributed to the fact that the dispersive capacity of the atmosphere is low in winters caused by lower mixing heights or even inverted conditions. Moreover, the concentration of PM10 and PM2.5 measured at all the sites are above the prescribed limits published in National Ambient Air Quality Standards, 2009 (60 and 40 μg m-3 for PM10 and PM2.5 respectively).
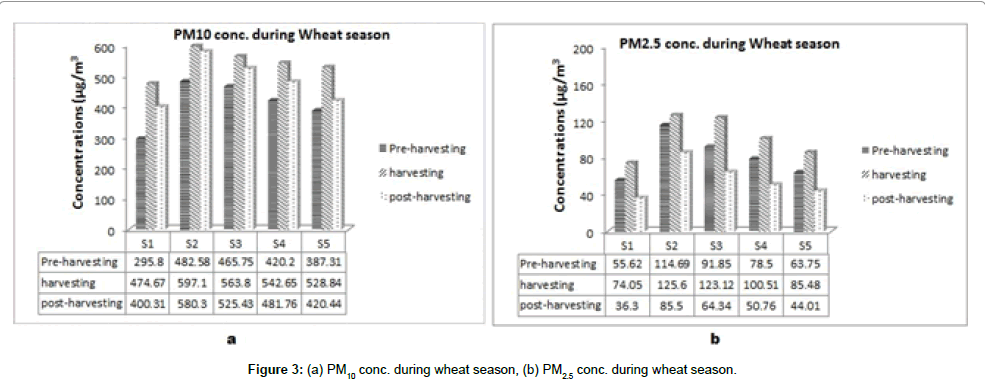
Figure 3: (a) PM10 conc. during wheat season, (b) PM2.5 conc. during wheat season.
Ion chromatography
Water soluble ions are chemical species which are easily soluble in water in the lower troposphere under certain conditions and they are usually significant components by mass of atmospheric particulate matter. Ion Chromatography (IC) of the filter samples was done to know the water soluble ions present in the particulate matter. The results are presented in Table 1. The trend for the mean water soluble ionic concentrations for samples collected during paddy harvesting study period was Cl- > NH4 + > SO42- > Na+ > Ca2+ > K+ > NO3- > Mg2+ > F-. The concentration of total water soluble inorganic ions for study period during paddy season ranged from 0.27 ppm to 12.39 ppm with mean concentration of 3.688 ppm. The trend for the mean water soluble ionic concentrations for samples collected during wheat harvesting period was NH4+ > Cl- > Na+ > SO42- > Ca2+ > K+ > Mg2+ >NO3- > F-. The concentration of total water soluble inorganic ions for study period of paddy crop ranged from 0.21 to 14.61 ppm with mean concentration of 3.62 ppm. Seasonal variation of major water soluble ions show similar trend for both paddy and wheat harvesting seasons. Total mass of water soluble ionic species was found to be higher in Winter i.e. during harvesting (39.07 ppm) and post harvesting period of paddy (39.76 ppm) and Spring i.e. pre harvesting period of wheat (40.42 ppm), whereas, lower during summer i.e. during harvesting (23.95 ppm) and post harvesting period of wheat (29.71 ppm) and fall i.e. pre harvesting period of paddy (13.37 ppm). Concentrations of chloride (Cl-) and potassium (K+) ions were highest in winter and lowest during summer and fall seasons. The seasonal variation of K+ was similar to Cl-, indicating that both K+ and Cl- were primarily related to the burning activities, which were enhanced in the low ambient temperature conditions. High sulfate ion concentrations are resulted from emissions of SO2 by a variety of combustion sources such as coal and oil. SO42- and NO3- both show highest concentrations during harvesting and post harvesting period of paddy. NO3- formed from the oxidation of NOx and its reaction with ammonia leads to formation of ammonium nitrate particle. The main reason for highest concentrations of water soluble ions during winter can be attributed to lower temperature which favored the transformation of ions from gas phase to particle phase and also due to lower mixing height and increased anthropogenic activities. Lower concentrations measured during fall period can be attributed to the washout of PM containing water soluble ions by rainfall while for summer months (April, May and June) ventilation effect of high wind movements could be the possible reason. The results obtained during characterization of water soluble ions present in particulates during wheat and paddy harvesting are in agreement with the previous studies (Wang et al.) [10-12].
| Study period | Concentration of ions (ppm) | ||||||||
| SO42- | Cl- | NH4+ | Ca2+ | Na+ | NO3- | K+ | Mg2+ | F- | |
| Paddy | |||||||||
| Pre-harvesting | 1.98 | 4.61 | - | 2.76 | 2.38 | - | 0.98 | 0.38 | 0.28 |
| Harvesting | 7.07 | 10.87 | 6.53 | 3.53 | 5.37 | 1.76 | 2.56 | 1.04 | 0.34 |
| Post harvesting | 5.68 | 9.61 | 12.39 | 3.26 | 5.09 | 1.23 | 1.47 | 0.76 | 0.27 |
| Wheat | |||||||||
| Pre-harvesting | 3.62 | 9.02 | 14.61 | 3.26 | 6.39 | 0.95 | 1.67 | 0.65 | 0.25 |
| Harvesting | 2.68 | 7.15 | 4.17 | 2.84 | 4.74 | | 1.34 | 0.74 | 0.29 |
| Post harvesting | 2.82 | 5.58 | 11.99 | 2.65 | 4.64 | 0.21 | 1.05 | 0.51 | 0.26 |
Table 1: Concentration of water soluble ions.
The study on the impact of stubble burning on ambient air quality has shown significant increase in PM10 and PM2.5 concentrations during crop residue burning periods in Mandi-Gobindgarh (an industrial town of Punjab). Before harvesting, the concentration of PM10 and PM2.5 was minimal at site 1 (agricultural site), as compared to other four sites, which are industrial and partially industrialized areas. During harvesting, there was a substantial increase in the magnitude of PM10 and PM2.5 at all the sites because of three reasons viz. threshing process, which leads to entrainment of rice husk particles in air, secondly, the shattering process which leads to entrainment of dry shell of wheat seed and lastly, stubble burning. During post-harvesting season, the values of PM10 and PM2.5 showed a decline trend because of the reduced quantum of stubble burning and dispersion of pollutants. So the present study clearly manifests the effect of stubble burning on the ambient air quality of an industrial estate (Mandi-Gobindgarh). Total mass of water soluble ionic species were higher during harvesting and post harvesting period of paddy and pre harvesting period of wheat and lower during harvesting and post harvesting period of wheat and pre harvesting period of paddy. Concentrations of chloride (Cl-) and potassium (K+) ions were highest in winter and lowest during summer and fall seasons. Concentration of PM10 and PM2.5 obtained at all the sites were above the permissible limits as given in National Ambient Air Quality Standards (NAAQS-2009). Thus, it can be concluded from the study that the stubble burning caused great deterioration in the ambient air quality of Mandi-Gobindgarh and pose serious threat to biological life as well as property.
The authors wish to thanks Punjab Pollution Control Board, Mandi-Gobindgarh for providing logistic support for the completion of the study and National Physical laboratory, New Delhi for analysis of water soluble ions in a sample.