Journal of Geography & Natural Disasters
Open Access
ISSN: 2167-0587
ISSN: 2167-0587
Research Article - (2023)Volume 13, Issue 1
Hypsometric analysis is the study of the relationship between horizontal cross-sectional drainage basin area and elevation. The hypsometry of drainage basins has been assessed in an attempt to simulate the stages of geological maturation and to study the influence of varying forcing factors (i.e., tectonics, climate, lithology) on watersheds. The shape of the hypsometric curve provides valuable information on the erosional stage of the basin, and also on the tectonic factors controlling it. Comparisons of the shape of the hypsometric curve for different drainage basins under similar hydrologic conditions provides a relative insight into the past soil movement of basins. In addition, calculating the Hypsometric Integral (HI) is a suitable method to describe the form of the hypsometric curve for a particular drainage basin. In this study, hypsometric analysis of four sub- basins in southern part of Al Jabal Al Akhdar area, NE of Libya, is carried out using DEM of 90 m resolution by SRTM. The elevation ratio was used to evaluate various hypsometric integral and establish the geological stage of water development. According to generated results shape of hypsometric curves of four hydraulic sub- basins significantly differs from each other. The geological stages of water developments in these sub-basins are ranging from the young to the old stage. HI values are ranging from 0.28 to 0.56 show different stages of watershed erosion; from fully stabilized to highly susceptible of erosion. Differences on hypsometric curve and HI values may provide information about tectonic effect on the given hydraulic basins.
Hypsometric curve; Watersheds; Hypsometric integral; Hypsometric analysis
Hypsometric analysis using GIS technique has been used in several studies dealing with erosional topography [1-5]. Weathering processes, stream erosion pattern and sediment transportation by surface runoff all contribute to landscape development within watersheds. The link between horizontal cross-sectional drainage basin area and elevation is known as hypsometric analysis. The drainage basin relief graph is the name given to the hypsometric curve.
Some researchers have assessed the hypsometry of drainage basins (area-elevation study), in an attempt to simulate the geological stages of watershed development and to study the influence of varying forcing factors (i.e., tectonics, climate, lithology) on watersheds. Langebein [6] developed hypsometric analysis for the first time to represent the overall slope and drainage basin shapes. Further, the hypsometric curve is a relationship between the volume of soil mass in a basin and the degree of erosion that has occurred in the basin compared to the remaining mass [7]. The shape of the hypsometric curve provides valuable information on the erosional stage of the basin, and also on the tectonic factors controlling it [8].
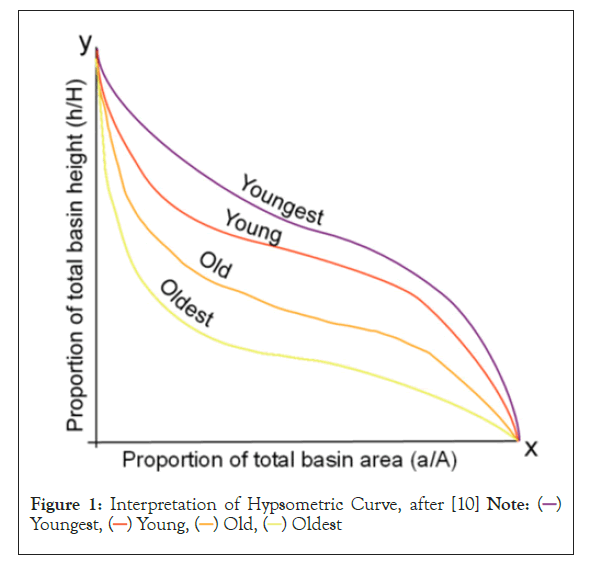
Strahler [9] interpreted the shape of the hypsometric curves and classified the basins as Convex hypsometric curves characterize young slightly eroded basins; S shaped curves characterize moderately eroded basins; concave curves point to old, highly eroded basins (Figure 1). Comparisons of the shape of the hypsometric curve for different drainage basins under similar hydrologic conditions provides a relative insight into the past soil movement of basins. Thus, the shape of the hypsometric curves explains the temporal changes in the slope of the original basin.

Figure 1: Interpretation of Hypsometric Curve, after [10] Note: ( )
Youngest, (
 ) Young, (
 ) Old, (
 ) Oldest
The southern part of Al Jabal Al Akhdar area in Cyrenaica region, NE of Libya, is considered as vulnerable area to erosion due to its undulating topography, and it is lack of hypsometric based studies to watershed. In this study, four sub-basins in the southern part of Al Jabal Al Akhdar area were selected for hypsometric analysis. Besides that, this research aimed to evaluate various hypsometric integral estimate approaches and establish the geological stage of development of the sub-basins.
Location of the study area
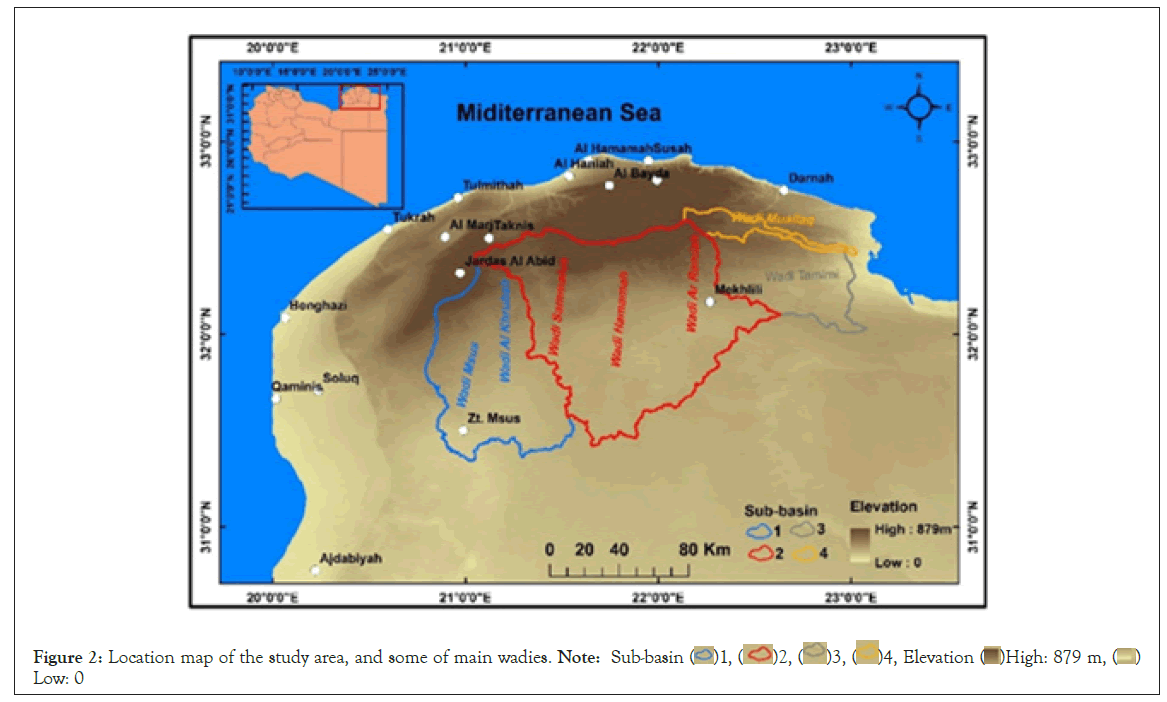
The study area is located in southern part of Al Jabal Al Akhdar area which is an integral part of Cyrenaica region in NE Libya. The selected region covers an area about (18,378) km2, and has classified into four sub-basins which are named in this study as sub-basin (1), sub-basin (2), sub-basin (3), and sub-basin (4), each of which has one or more valley incised through it (Figure 2).

Figure 2: Location map of the study area, and some of main wadies. Note: Sub-basin ( )1, (
)1, ( )2, (
)2, ( )3, (
)3, ( )4, Elevation (
 )High: 879 m, (
 )
Low: 0
Morphologically the area is generally an uplifted mountain with an oval shape trending in northeast-southwest, with a gentle slope towards the south and west, while to the north it is characterized by two escarpments separated by a hinge line called the Cyrenaica fault system. The study area is more or less eroded by discontinuously flooded valleys (wadies). Most of wadies in the southern part of Al Jabal Al Akhdar are flattened, broaden and shallowing with a few meters deep [11].
Methods
There are many methods used to determine the flow directions from DEM data. This study mainly relies on an Arch Map software (10.5) version in extraction procedure which is the most convenient and widely used tool to extract drainage network and its related basins recently. The DEM data over the study area is collected form SRTM with spatial resolution 90 m.
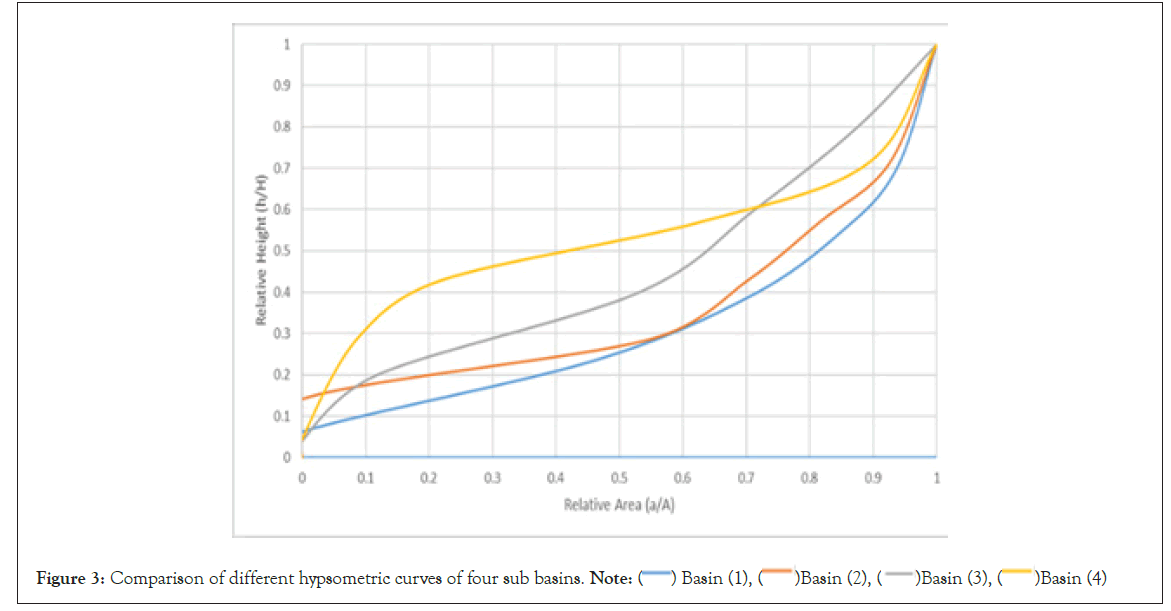
The result of the hypsometric curves belonging to four hydraulic sub-basins are given in Table 1. And were plotted and presented in Figure 3. During the early geomorphic stages of development, there is a lot of variances in the shape of the hypsometric curve, but after the watershed reaches a stable or mature state, there is very little variance [12]. According to generated results shape of hypsometric curves of hydraulic sub-basins significantly differs from each other. The hypsometric curve of the sub-basin (1) and the sub-basin (2) is a concave shape curve that indicates in old stage of water development. However, although the hypsometric curve of sub-basin (2) is slightly less concave than sub-basin (1), but both is considered in late stage of water development. The sub-basin (3) is slightly a S-shaped curve that indicates mature stage of this basin. The shape of the hypsometric curve of the sub-Basin (4) is an S-shaped to a convex shape curve characterizing the youngest stage of water development in the area of the study.
| Basin | Main Wadies | Area (km)2 | Alluvial plain (Balta) km2* | Elevation (m) | HI | Geological Stage | ||
|---|---|---|---|---|---|---|---|---|
| Min | Max | Mean | ||||||
| 1 | Msus Al Khrubah | 5232 | 454 | 42 | 638 | 210 | 0.28 | Old stage or peneplain |
| 2 | Sammalus Hamamah Ar Ramlah | 9904 | 480 | 99 | 724 | 269 | 0.27 | Old stage or peneplain |
| 3 | Tamimi | 2681 | 263 | 22 | 462 | 224 | 0.46 | Mature stage or Late youthful |
| 4 | Mullaq | 561 | 13 | 31 | 677 | 394 | 0.56 | Inequilibrium or Youthful |
| Note: *Modified after Hamad [13]. | ||||||||
Table 1: Show the main results of hypsometric analysis the sub-basins in the southern part of the Jabal Al Akhdar area.

Figure 3: Comparison of different hypsometric curves of four sub basins. Note: ( ) Basin (1), (
 )Basin (2), (
 )Basin (3), (
 )Basin (4)
In addition, a simple way to explain the shape of the hypsometric curve for a given drainage basin is by calculating the Hypsometric Integral (HI), which is known as the region under the hypsometric curve [10]. The Hypsometric Integral (HI) is also an indication of the (cycle of erosion) which is the total time required for reduction of land area to the base level [9,14]. The hypsometric integral values are ranges between 0 and 1, where low hypsometric integral values indicate old and more eroded areas and dissected drainage basins, while the high values indicate that young and less eroded areas. The Hypsometric Integral values of a drainage basin can determine by using formula as;
Mean Elevation - Minimum Elevation ÷ Maximum Elevation - Minimum Elevation
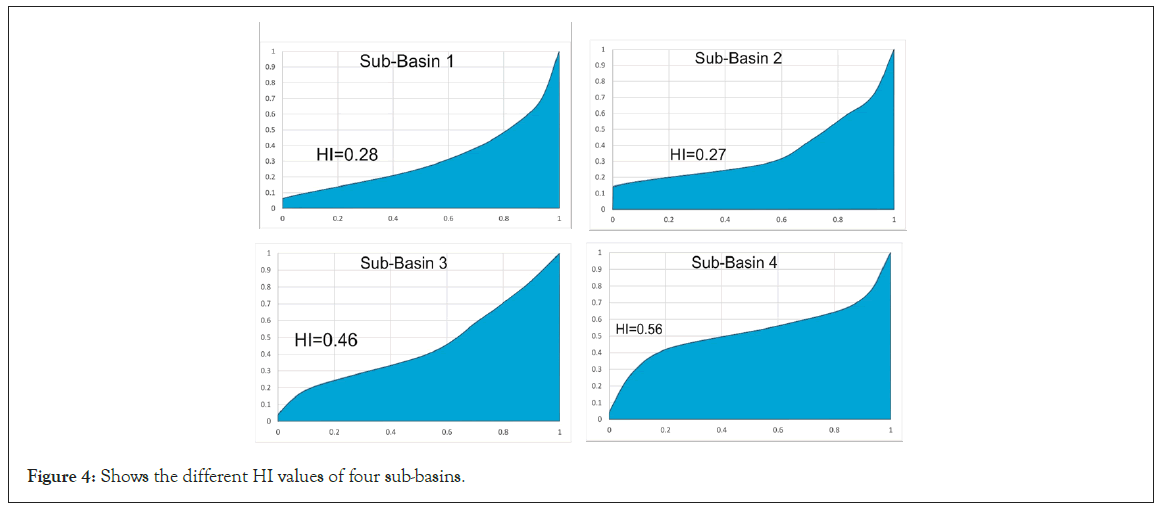
The HI values of the studied sub-basins are posted in the Table 1; they are indicated in the young stage to the late stage of mass removal in the southern part of Al Jabal Al Akhdar area. Further, according to Strahler [9] and from the HI values, the cycle of erosion within these sub-basins can be divided into three stages; peneplain or monadnock stage (old) (HI<0.3), in which the watershed is fully stabilized; equilibrium or mature stage (HI 0.3 to 0.45); and i equilibrium or young stage (HI>0.45), in which the watershed is highly susceptible to erosion (Figure 4).

Figure 4: Shows the different HI values of four sub-basins.
The valleys in sub-basins (1,2 and 3) are capable to discharge a large amount of water, which is causing erosion and soil loss, and thus transport the soil from the Northern part of the study area to the South. This process will eventually lead to degradations in the Northern parts of sub-basins. The area within the sub-basin (4) appears to be more vulnerable to erosion and has a high rate of mass wasting activity in contrast with other sub-basins. The quantities and sizes of the transported sediments by these valleys are different according to the geomorphic development stages. The old stage valley is capable of moving small size sediments such as silt and clay, whereas the young valley is capable of moving all sediment sizes from silt to boulders.
However, despite the presence of erosion, sediment deposition also occurs (flood plain). As a result of the weathering process and surface runoff, large flat areas with a significant quantity of transported sediments are created by some studied valleys. These places where the valleys are drained and temporary lakes formed are known as alluvial plains, and locally named as Balta. Table 1 shows the total area of the regions produced by drained valleys. The valleys in the old stage of geomorphic development are able to make high accumulation of sediments in a large flat area with a very low slope (alluvial plains), while the alluvial plain does not exist within the valleys that are in the young stage.
The comparison between the hypsometric curves shown in the Figure 3 revealed a major difference in mass removal from the subwatersheds of study area. Differences on hypsometric curve and HI values may provide information about tectonic effect of Al Jabal Al Akhdar area on hydraulic basins.
GIS techniques have been applied for hypsometric study of the southern part of Al Jabal Al Akhdar area, and these contemporary approaches have demonstrated their ability to improve results accuracy and save time in hypsometric analysis. The mature to the old stage of geomorphic development are the main dominated in the southern part of Al Jabal Al Akhdar area. The sub-basins (1 and 2) are in old age of water development and are highly eroded valleys; the sub-basin (3) is in a mature stage with low susceptibility to erosion. While the sub-basin (4) is at the youth stage of geomorphic development, with highly susceptible of erosion and high mass movement activities. The old and mature valleys within the sub-basins (1, 2 and 3) have made a large area of flood plains, while the youngest valley such Mullaq in the sub-basin (4) have not.
The authors declared that this research work is original, and no funding was received for conducting the study.
The Authors declare that there is no conflict of interest.
Citation: Zamot J, Afkareen M (2023) Hypsometric Curve of Watersheds in Southern Part of Al Jabal-Al Akhdar Area, North-East Libya. J Geogr Nat Disasters. 13: 262
Received: 17-Dec-2022, Manuscript No. JGND-22-20981 ; Editor assigned: 20-Dec-2022, Pre QC No. JGND-22-20981 (PQ); Reviewed: 04-Jan-2023, QC No. JGND-22-20981 ; Revised: 11-Jan-2023, Manuscript No. JGND-22-20981 (R); Published: 18-Jan-2023 , DOI: 10.35841/2167-0587.23.13.262
Copyright: © 2023 Zamot J, et al. This is an open-access article distributed under the terms of the Creative Commons Attribution License, which permits unrestricted use, distribution, and reproduction in any medium, provided the original author and source are credited.