Forest Research: Open Access
Open Access
ISSN: 2168-9776
ISSN: 2168-9776
Research Article - (2014) Volume 3, Issue 3
In a three (light availability levels)×two (soil moisture levels) factorial greenhouse experiment we quantified to what extent light availability and soil moisture on the one hand and seedling size on the other hand control the relationship between branch and stem biomass of European beech and Norway spruce seedlings. Aboveground biomass partitioning of both tree species were influenced by size and to a lesser extent by the environmental conditions. The branch biomass allocation pattern to reduced light and soil moisture differed strongly between the two species. European beech allocation was only driven by size and of Norway spruce by size and the environmental conditions. Overall, beech seedlings seem to have much higher crown plasticity as spruce. Our results indicate that in contrast to above-belowground biomass allocation pattern which depend very much on the environmental conditions, aboveground biomass partitioning seem to be mainly controlled by plant size.
<Keywords: Aboveground biomass; Branch; Environmental condition; Size; European beech; Norway spruce
European beech (Fagus sylvatica L.) and Norway spruce (Picea abies L.) are prevalent and the economically most important tree species of Central Europe. For a variety of reasons the two species are cultivated in mixed stands on an increasing number of sites [1,2]. Such mixtures have been studied in detail [3,4]. It was shown that beech is more efficient in space occupation while spruce is more efficient in space exploitation under constant conditions in mixed stands. Furthermore, spruce is more sensitive to disturbance than beech [5]. However, most of the studies which compared the plasticity of European beech and Norway spruce focused on mature stands, but not on seedlings and hence did not address tree regeneration. Experiments using seedlings mainly dealt with the growth responses of one of the two species to different resource availabilities (light, soil moisture and/or nutrients) [6-12]. However, we know of just one study, which comparatively investigated the response of beech and spruce to different levels of light and soil moisture [13]. Moreover the existing studies on beech or spruce seedlings and saplings mainly focused on photosynthesis, diameter and height growth or above and belowground biomass partitioning [14,15], but not much comparative research was done on the pattern of space occupation by the two species under different resource availability levels in the seedling stage.
Beech seedlings are characterized as shade-tolerant, whereas spruce seedlings are considered to be of intermediate shade-tolerance. Both tree species are regarded as sensitive to drought in Central Europe [16-18] but for beech the situation seems to be much less clear than for spruce [19,20]. Climatic changes with more extreme heats, droughts and storms are predicted for Europe [21,22]. These changes in environmental conditions could fundamentally alter interspecific competition and hence the composition, structure, and biogeography of forest in many regions [23]. For example Grundmann et al. found for Southern Sweden that these shifts increased the sensitiveness of Norway spruce, whereas European beech seemed to benefit from warmer conditions in the growing season [24]. However, the impact of more frequent droughts on beech in Central or Southern Europe may be seen in a different light [25].
Against this background it is of interest to analyze the response of the two species to limited resource availability in more detail as it will inherently alter their competitive interactions. The expected climate changes, i.e. higher temperatures and reduced precipitation during summer may affect seedlings even more than mature trees, as resource limitations are known to be crucial in the establishment phase [1]. During this stage the seedlings have to compete for light, water and nutrients with over-story and under-story trees, herbaceous plants but also neighboring seedlings [26,27]. However, resource availability does not only limit tree growth but also determine biomass allocation to shoot, branches, or roots [28], organs which are essential for space occupation and hence competition.
Most research on biomass partitioning has focused on the influence of light and/or soil moisture on stems, leaves or roots [e.g. 7,11,29,30]. In a recent study Schall et al. showed that Norway spruce and European beech seedlings responded differently to limitations in light and water [13]. Whereas growth and biomass allocation to above and belowground plant components of both species were affected by light availability, a shift in biomass partitioning between above and belowground components due to limited soil moisture was found for European beech but not for Norway spruce. While the effect of resource availability on seedling above and belowground biomass was studied for many species and resource levels [9,15,29,31-35], only few studies differentiated between the aboveground components [12,36- 38], although the partitioning between branch and stem seems to be an interesting but often disregarded factor for studying pattern of interspecific competition.
In the present study branch growth dynamics of European beech and Norway spruce seedlings in response to shade and drought, was investigated in a greenhouse experiment. The aim of the study was to quantify to what extent light availability and soil moisture on the one hand and seedling size on the other hand control the relationship between branch and stem biomass of the two species. More specifically, we hypothesized that i) the expected change in the relationship between branch and stem biomass to reduced soil moisture and/or shade does vary between tree species, and ii) resource availability determines the relationship between branch and stem biomass to a lesser extent than seedlings size. The latter would mean that, in contrast to biomass partitioning between above and belowground compartments, the partitioning within the aboveground compartment are rather size dependent than influenced by the environment.
Experimental design and treatments
We set up a 3×2 factorial greenhouse experiment with 32 replicates per treatment and species between April 2006 and November 2008. In total 192 one-year-old European beech and 192 two-years-old Norway spruce seedlings were examined (two species×three light levels×two soil moisture levels×32 seedlings) using potted plants. The seeds originated from stands registered for seed harvests which were located in the Bavarian alpine foreland (Provenance Hkg 81024, certificate D-092161001603 for European beech and provenance Hkg 84027, certificate D-092160002003 for Norway spruce). The seeds were cultivated in a stated owned nursery (Pflanzgarten Stützpunkt Laufen, Bayerische Staatsforsten), where the seedlings grew under open field conditions. In 2006 all seedlings were planted in pots each with a volume of 20 l. The mineral soil in the pots was taken from two neighboring and very productive forest stands growing on haplic luvisols from loess near Freising (southern Germany). One stand was a pure beech, and the other a pure spruce stand. The mineral soil was mixed and filled into the pots. This advancement should assure that seedlings were able to develop a species-specific mycorrhiza during the period of the experiment [13].
At the beginning of the experiment all seedlings were well watered to field capacity and obtained a photosynthetic radiation representing 65% of open field conditions. In 2007 and 2008 the seedlings were exposed to different treatments on the basis of three light levels (28.7%, 58.9% and 80% of ambient light) and two soil moisture levels (-400 hPa and -1500 hPa on average). The three light levels reflected different light conditions below the canopy of spruce stands where irregular single or group selection was applied [15,38]. Different light levels were achieved by using net covers of differing mesh size. The two water levels should simulate a moist and a dry vegetation period (01.05-31.09). During winter all seedlings were well watered to field capacity. In order to approximate natural conditions soil moisture fluctuated [13]. Nevertheless water potential was significantly different between the two moisture treatments [13]. The plants were irrigated automatically (system: Watermark Sensor SIS, [13] due to a predefined scheme representing a wet and a dry summer period. In 2007 some Norway spruce seedlings of the moist variant were infested by fungi and were therefore treated with a fungicide.
Measurements
At the end of the vegetation period each year the following parameters were measured: diameter (3 cm above root collar; the position was marked with a white line in 2006), length of the main shoot, diameter of all first order branches at the branch basis and the length of these branches. At the end of the experiment, all seedlings were harvested and separated into the compartments stem, branch, and roots. Dry weights of the three compartments were measured after drying at 105°C until constant weight.
On a subsample of 20 European beech and 19 Norway spruce seedlings length, diameter at branch basis and branch dry weight of first order branches (European beech: N=60 branches, Norway spruce: N=254 branches) were determined at the end of the experiment (2008).
Data analysis
Branch diameter and length data from the subsample of 20 European beech and 19 Norway spruce seedlings was used to estimate branch biomass by non-linear regression (Table 1). Various models were tested and the model with the lowest Akaike information criterion (AIC) was taken (Table 1). As branch and stem diameter and length was measured each year and for each seedling the results were used to predict branch biomass and stem biomass at any time from branch and stem length and diameter for individual seedlings using the model with the lowest AIC.
| Model type | a | B | c | d | df | RSE | AIC | |
|---|---|---|---|---|---|---|---|---|
| European beech | ||||||||
| Branch | BB=a* diameterb* lengthc | 0.7761 | 2.0534 | 0.6875 | 57 | 0.58 | 110.76 | |
| BB=a+b* diameterc* lengthd | -0.0291 | 0.7899 | 2.0382 | 0.6834 | 56 | 0.59 | 112.73 | |
| BB=a+b* diameter2* length | 0.2643 | 0.2004 | 58 | 0.63 | 118.98 | |||
| Stem | SB=a+b* diameter2* length | 0.9111 | 0.1700 | 182 | 9.30 | 1346.94 | ||
| SB=a* diameterb* lengthc | 0.1426 | 1.9544 | 1.0429 | 181 | 9.32 | 1348.71 | ||
| Norway spruce | ||||||||
| Branch | BB=a* diameterb* lengthc | 0.1185 | 1.6360 | 1.1657 | 251 | 0.17 | -182.04 | |
| BB=a+b* diameterc * lengthd | 0.0211 | 0.1089 | 1.6629 | 1.1921 | 250 | 0.18 | -181.74 | |
| BB=a+b* diameter2* length | 0.0473 | 0.2461 | 252 | 0.18 | -154.57 | |||
| Stem | SB=a* diameterb* lengthc | 0.7185 | 1.2701 | 0.7148 | 139 | 2.06 | 613.31 | |
| SB=a+b* diameter2* length | 5.3097 | 0.1242 | 140 | 2.29 | 641.62 |
Table 1: Analysis of nonlinear models estimating branch and stem biomass of European beech and Norway spruce seedlings. Note: The sample size of European beech was n=60 and of Norway spruce n=254. The coefficients a to d are fitted values, BB=estimated branch biomass, SB=estimated stem biomass, df=degrees of freedom, RSE=Residual standard error, AIC=Akaike information criterion.
At the end of the experiment (2008) estimated branch biomass was plotted against measured biomass indicating a systematic bias which was corrected by the following correction factor:
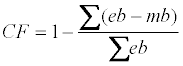
Where mb the measured branch biomass 2008 is, eb is the estimated branch biomass 2008. CF (European beech CF=0.89, Norway spruce CF =1.07) was used for correcting the estimated branch biomass for all years.
Estimated branch biomass for all years and the share of increment of branch biomass to increment of aboveground biomass were analyzed with non-parametrical Kruskal-Wallis ANOVA followed by multiple comparisons using Wilcoxon rank sum test with the Bonferroni adjustment.
The effect of light availability and soil moisture on the relationship between increment of branch biomass and increment of aboveground biomass of the seedlings was analyzed using Generalized Least Squares (GLS). In GLS model variance functions were used to model the variance structure of the errors using covariates [39]. The variance covariate with the best visual fit was used. Aboveground biomass increment, light availability, soil moisture, size (initial aboveground woody biomass) and interactions between aboveground biomass increment and light availability or soil moisture were included in the full model. The full model and all potential simplifications were tested to find the best and simplest model (Table 1 and Table 2 in Appendix). Therefore the Akaike’s Information Criterion was used [40,41]. Pseudo R² was used to describe the strength of the relationship between dependent and independent variable. It was calculated by regressing model predictions and observations.
| Light level | Soil moisture | ||||||
|---|---|---|---|---|---|---|---|
| 81% | 59% | 29% | P-value | Moist | Dry | P-value | |
| European beech | |||||||
| 2005 | 0.03a± 0.0 | 0.03a ± 0.0 | 0.03a ± 0.0 |
0.809 | 0.03 ± 0.0 |
0.03 ± 0.0 | 0.770 |
| N | 62 | 63 | 62 | 92 | 95 | ||
| 2006 | 1.06a ± 0.1 | 0.84a ± 0.1 | 0.84a ± 0.1 |
0.204 | 0.98 ± 0.1 |
0.85 ± 0.1 | 0.158 |
| N | 62 | 63 | 61 | 92 | 94 | ||
| 2007 | 11.86a ± 0.8 | 13.62a ± 1.2 | 10.87a ± 0.7 |
0.405 | 14.11 ± 0.8 | 10.20 ± 0.6 | <0.001 |
| N | 62 | 62 | 61 | 91 | 94 | ||
| 2008 | 24.48a ± 1.2 | 31.33b ± 2.2 | 23.69a ± 1.3 | 0.017 | 30.94 ± 1.5 | 22.32 ± 1.0 | <0.001 |
| N | 62 | 62 | 61 | 91 | 94 | ||
| Norway spruce | |||||||
| 2005 | 0.03a ± 0.0 | 0.03a ± 0.0 | 0.03a ± 0.0 | 0.323 | 0.03 ± 0.0 | 0.03 ± 0.0 | 0.209 |
| N | 61 | 63 | 64 | 94 | 94 | ||
| 2006 | 0.20a ± 0.0 | 0.20a ± 0.0 | 0.27a ± 0.0 | 0.952 | 0.19 ± 0.0 | 0.25 ± 0.0 | 0.240 |
| N | 59 | 57 | 59 | 88 | 87 | ||
| 2007 | 6.26a ± 0.4 | 4.44 b ± 0.4 | 2.46c ± 0.3 | <0.001 | 6.78 ± 0.5 | 3.40 ± 0.2 | <0.001 |
| N | 59 | 57 | 30 | 59 | 87 | ||
| 2008 | 20.60a ± 1.3 | 17.12a ± 1.0 | 11.79b ± 0.9 | <0.001 | 22.99 ± 1.3 | 13.63 ± 0.6 | <0.001 |
| N | 56 | 57 | 30 | 57 | 86 | ||
Table 2: Estimated branch biomass (g), mean ± standard error, from 2005 to 2008. Significance of treatment effects is indicated by P-value of the Kruskal-Wallis test.Treatments started in spring 2007. Same letters indicate a non-significant difference between single treatments (two-sided: P<0.05, Wilcoxon rank sum test with the Bonferroni adjustment).
Normal distribution and homogeneity of variance of residuals were analyzed visually and by using the Kolomogorov-Smirnov-test and the Fligner-Killeen test. All analysis and statistical tests were conducted using R, version 2.14.2 (R Development core team). Norway spruce seedlings infested by fungi (treatment 29% light and moist) had to be excluded from the analyses.
Branch biomass
The regression equations for estimating branch biomass (BB) from branch diameter at branch basis and branch length were:
BB=0.7761×diameter 2.0534×length 0.6875 for beech and
BB=0.11848×diameter 1.63601×length 1.16567 for spruce.
The relationship between measured and calculated branch biomass yielded an adjusted R² of 0.97 (P<0.001) for European beech and of 0.95 (P<0.001, Figure 1) for Norway spruce. Thus, branch biomass could be estimated quite precisely from the measurements. Also the relationship between measured and calculated stem biomass yielded an adjusted R² of 0.90 (P<0.001) for European beech and of 0.89 (P<0.001) for Norway spruce.

Figure 1: Relationship between measured branch biomass (g) and estimated branch biomass of European beech (y = -0.01188 + 1.00170 * x; N=60) and Norway spruce (y = 0.01277 + 0.99217 * x; N=254). Biomass models are given in Table 1.
Prior to shading and irrigation estimated branch biomasses within species did not differ between the variants (Table 2). After being exposed to different resource levels, both species responded. Whereas branch biomass of beech did not differ between light levels in the first but in the second year (2008), branch biomass increased with increasing soil moisture in both years (P<0.001). In contrast to beech, spruce showed an increase in branch biomass with increasing light and soil moisture already in the first year (P<0.001, Table 2). In 2008 beech seedlings which had been exposed to the medium light level yielded the highest branch biomass (P=0.017), whereas for spruce highest branch biomass was found for the seedlings which received the highest amount of light (P<0.001, Table 2). In the second year branch biomass of both tree species was higher under moist than under dry conditions (P<0.001).
Partitioning between aboveground compartments
Both tree species responded to resource availability in the share of branch biomass increment on aboveground biomass increment. The share of branch biomass increment of European beech responded to different light availability in the first year and showed a higher value under full and low light conditions than under medium light (Table 3).
| Soil moisture level | ||||||||
|---|---|---|---|---|---|---|---|---|
| Moist | Dry | |||||||
| Light level | 81% | 59% | 29% | 81% | 59% | 29% | P-value | |
| European beech | ||||||||
| 2007 | 0.44a ± 0.02 | 0.34b ± 0.02 | 0.39ab ± .02 | 0.40ab±0.02 | 0.34b ±0.02 | 0.40ab ± 0.02 | 0.004 | |
| N | 30 | 30 | 31 | 32 | 32 | 30 | ||
| 2008 | 0.31ab ± .03 | 0.28a ± 0.01 | 0.32ab ±0.02 | 0.30a ± 0.02 | 0.31ab ± 0.02 | 0.37b ± 0.02 | 0.017 | |
| N | 30 | 30 | 29 | 32 | 32 | 30 | ||
| Norway spruce | ||||||||
| 2007 | 0.50ab ± 0.02 | 0.52a ± 0.02 | 0.48ab± 0.01 | 0.42b ±0.02 | 0.42b ± 0.02 | <0.001 | ||
| N | 27 | 30 | 30 | 27 | 30 | |||
| 2008 | 0.60a ± 0.01 | 0.56a ± 0.02 | 0.54a ± 0.02 | 0.58a ±0.01 | 0.57a ± 0.01 | 0.164 | ||
| N | 26 | 30 | 28 | 26 | 29 | |||
Table 3: Share of increment of branch biomass on increment of woody aboveground biomass, mean ± standard error, of European beech and Norway spruce seedlings in 2007 and 2008 (light availability levels expressed in % of ambient light, soil moisture levels: moist and dry). Significance of the treatments is indicated by P-value of Kruskal-Wallis test. Same letters indicate a non-significant difference between single treatments (P<0.05, Wilcoxon rank sum tests). Same letters indicate a non-significant difference between single treatments (two-sided: <0.05, Wilcoxon rank sum test with the Bonferroni adjustment).
In contrast to beech spruce showed no response to light availability in the first year. In 2008 only the beech seedlings of the dry treatment responded in the share of branch biomass increment to light availability and showed the highest increment in branch biomass under low light. For spruce in 2008 no significant effects of the different treatments on the share of branch biomass increment were detected.
The relationship between branch increment and total aboveground biomass increment of European beech did not differ between the treatments in both years. However it was affected by tree size (Figures 2a and 2b, Table 1 in Appendix). The shift in partitioning to branch biomass increment became more pronounced with increasing seedling size in 2007, whereas the opposite was true for the second year.

Figure 2: Relationship between increment of branch biomass (g/a) and increment of aboveground woody biomass (g/a) of European beech seedlings in 2007 (a) and 2008 (b). Regression lines represent the minimum, mean and maximum initial biomass (g, size).
For Norway spruce the allocation between increment of branch biomass and increment of aboveground biomass was changed by size (Figure 3a) and by different environmental conditions for Norway spruce in 2007. Only slight differences were found in the AICc-values of the models tested (Table 2, Appendix). Thus it was difficult to decide which of two more or less equal models should be identified as ‘best’ model: a model indicating an effect of light availability or a model suggesting soil moisture being important. However, the model including soil moisture showed a slightly higher pseudo R² (0.93) when compared to the model including light availability (0.92).

Figure 3: Relationship between increment of branch biomass (g/a) and increment of aboveground woody biomass (g/a) of Norway spruce seedlings in 2007 (a) and 2008 (b). (a) Regression lines represent the minimum, mean and maximum initial biomass (g, size) under dry (black) and moist (grey) conditions. (b) Regression lines represent the minimal adequate model derived through analysis of generalised least squares model fits using the information-theoretic AICc-approach (Table 2 in Appendix).
In the first model the slope of the relationship was higher under moist conditions than under dry conditions. Moreover we identified an interaction between soil moisture and increment of aboveground biomass. In other words, spruce showed disproportionately high increment in branch biomass with increasing aboveground biomass when growing under moist conditions. In the second model the slope of the partitioning was higher under full and middle light conditions than under low light. However, in both models size was an influential factor, indicating that the allocation of branch biomass increased with increasing aboveground biomass (Figure 3a).
In the second year the partitioning between branch biomass increment and aboveground biomass increment was influenced only by light availability. The intercept of the partitioning was higher under middle and low light conditions than under full conditions. Thus, whereas the slope and hence the partitioning between branch biomass increment and total aboveground biomass increment remained unchanged, branch biomass increment at a given value of aboveground biomass increment was higher in the medium and low light environment (Figure 3b).
In contrast to 2007 the partitioning was not significantly influenced by size in 2008. Norway spruce showed a higher pseudo R² in 2007 and 2008 when compared to European beech (Table 1 and Table 2, Appendix). In contrast to Norway spruce, where the pseudo R² remained unchanged between 2007 and 2008, the pseudo R² of European beech was smaller in 2008.
As in other studies branch biomass was positively related to light availability [29,36,42-45] and soil moisture [14,46] in our experiment. However, the main focus of this study was on aboveground biomass allocation. We found that aboveground biomass partitioning of tree seedlings was influenced by size in three out of four cases (2 species and 2 years) and to a lesser extent by the environmental conditions. These findings confirm hypothesis 2 which stated that resource availability determines the relationship between branch and stem biomass to a lesser extent than seedlings size. This result is important as its shows that the partitioning within the aboveground compartment are rather size dependent whereas biomass partitioning between above and belowground compartments is very much influenced by the environment [13]. As hypothesized (hypothesis 1) the branch biomass allocation pattern to reduced light and soil moisture differed strongly between European beech and Norway spruce.
Aboveground biomass allocation as a function of size
As predicted by the pipe model [47] both species showed a rather constant relationship between branch biomass increment and the increment of total aboveground biomass indicating a substantial size effect (Figures 2 and 3a).
However, interestingly spruce showed higher pseudo R² (Figures 2 and 3, Table 1 and Table 2 in Appendix) than beech, indicating a higher variability of allocation to branches of the latter species. These different patterns can be explained by the morphology of the two species. Spruce is characterized as a monopodial growing tree species, with a straight stem axis and a more or less fixed pattern of branch number per whorl. In contrast to spruce, beech is characterized as a plagiotrop growing tree species, with a highly variable stem axis and the ability to promote spur shoots and thus providing a high number of leaves without many branches [48,49]. Surprisingly the effect of size on aboveground biomass partitioning changed for European beech between 2007 and 2008 (Figure 2). Whereas the increment in branch biomass in relation to total aboveground biomass increment increased with increasing plant size in 2007, the opposite was true in 2008 (Figure 2). It might be that this observation was caused by an artefact. In the second year beech seedlings from neighboring pots may had restricted the growing space which could had led to a reduced branch growth.
Aboveground biomass allocation as a function of the environmental conditions
The results of our experiment did not only reveal changing patterns of aboveground biomass allocation as a function of size, but also due to resource availability (Figure 3b, Table 3). At the end of the study period the seedlings were harvested. For beech, but not for spruce, it was shown that the seedlings allocated more biomass to the belowground compartments under dry conditions [13]. This is in line with the biomass partitioning theory [50]. However, it seems as if this shift of biomass toward the roots was caused by equal reductions of branch growth and main stem growth, as beech did not change aboveground biomass allocation in the different soil moisture treatments (Table 3). This is in contrast to the results of a field study where beech seedlings responded to increased soil moisture due to cutting over story tree roots with a higher increase in branch biomass compared with the increase in main stem biomass [14]. However, as the plants were not harvested in the field study, it is not clear whether the changed aboveground pattern were actually linked to changes in root biomass. Additionally sizes effects, which were shown to be important for aboveground biomass allocation, were not tested.
Spruce on the other hand, which had not changed its biomass allocation to above and belowground compartments under dry or moist conditions at the end of the experiment [13], showed adjustments in aboveground biomass allocation due to drought in the first year. Actually, under dry conditions branch biomass increment of spruce was reduced at a given aboveground biomass increment. However, we have no explanation why this effect could not be observed also in the second year. The allocation of spruce responded to light availability. Branch biomass increment was reduced at a given aboveground biomass increment under high light conditions in 2008 (Figure 3b). In summary it can be concluded that spruce seedlings tended to cope with environmental stress primarily by adjustments in aboveground biomass partitioning whereas beech responded in a change of above and belowground biomass allocation.
Overall our results confirm the conclusions of [51] suggesting that aboveground biomass allocation of seedlings and sapling are driven by size and – in our case only for spruce – by the environmental conditions. Delagrange et al. [52] and Balandier et al. [53] stated that morphological parameters are driven more by tree size than by light availability, whereas physiological leaf parameters reflect light availability. From our experiment this statement can be widened in so far that aboveand belowground biomass partitioning and physiological adjustments seem to be ways to cope with limited resource availability. Adjustments in aboveground biomass seem to be less important. Instead the aboveground allocation pattern seems to represent plant size effects. Spruce and beech are described as tree species sensitive to drought [18], but the aboveground biomass allocation pattern as reaction to drought differed between both species. Beech seedlings seem to have much higher crown plasticity as spruce. However with regard to climate change, the question, if the better plasticity of beech in response to drought may reflect a competitive advantage compared to spruce, cannot be answered yet. Further long-term experiments with beech and spruce under different environmental conditions and different tree ages are required to increase our knowledge in this field. In further studies non-destructive monitoring methods such as 3D-laser scanning are promising tools to provide more insights in aboveground biomass allocation in the field [54].
We gratefully acknowledge the support by Isabella Dully, Fevzije Osmani, Ulrike Westphal and student helpers with the laborious measurements. This research was funded by the Bavarian Forest Service, grant No. ST 176 and financially supported by the Forest Service of Rhineland-Palatinate. Christina Lödige was supported by the Functional Biodiversity Research Cluster of Göttingen University, led by Andrea Polle and financed of the Lower Saxony Ministry of Science and Culture. We are grateful for this support