Advanced Techniques in Biology & Medicine
Open Access
ISSN: 2379-1764
ISSN: 2379-1764
Research Article - (2022)Volume 10, Issue 2
The study aimed to establish a high-throughput bioassay method for the determination of total bioactivity of Atractylodes lancea (AL) in human serum samples. In addition, a simple HPLC-UV method for the determination of plasma concentrations of Atractylodin (ATD), the main bioactive component of AL, was also developed. For the bioassay method, Staphylococcus aureus (S. aureus) ATCC 25923 strain was used as a test organism. Inhibition of bacterial growth was assessed using MTT assay. The calibration curve was prepared from the concentration response curve in serum (0, 0.39, 0.78, 1.56, 3.13, 2.56, and 50 ng/ µl), which was linear with correlation coefficients better than 0.990. The Limit of Quantification (LOQ) was 1.66 µg/ml using 20 µl serum samples. The HPLC-UV assay procedure was developed based on reversed-phase chromatography using Hypersil Gold C18 column and elution solvent consisting of acetonitrile and water at the ratio of 70:30 (v:v). The UV detection was set at the wavelength of 340 nm. The calibration curve was prepared from concentration-response curve in serum (0, 0.39, 0.78, 1.56, 3.13, 2.56, and 50 ng/µl), which was linear with correlation coefficients (r) better than 0.990. The LOQ was 2.5 ng/ml using 1 ml plasma sample. Both assay methods were specific, sensitive, accurate and reproducible quantitative analyses of serum bioactivity of AL and plasma concentrations of ATD. The methods were successfully applied for the pharmacokinetic study of total bioactivity (anticholangiocarcinoma activity) of AL extract in five patients with advanced-stage cholangiocarcinoma.
Bioassay; Staphylococcus aureus (S. aureus) ATCC 25923; HPLC; Cholangiocarcinoma; Pharmacokinetics
ATD: Atractylodin; AL: Atractylodes lancea; HPLC: High-Performance Liquid Chromatography; LC-MS: Liquid Chromatography-Mass Spectrometry; GC: Gas Chromatography; UPLC-LTQ-Orbitrap MS: Ultra-Performance Liquid Chromatography coupled with electron spray ionization LTQ-Orbitrap high-resolution Mass Spectrometry; DMSO: Dimethylsulfoxide; CFU: Colony-Forming Unit; LOQ: Limit of Quantification; QC: Quality Control; CV: Coefficient of Variation; SD: Standard Deviation; MDV: Mean Deviation from the theoretical Values; SPE: Solid-Phase Extraction
Atractylodes lancea (Thunb.) DC. (AL) has a long history as one of the important herbs used in traditional Chinese medicine (“Cang Zhu”), Japanese campo (“So-Jutsu”), and Thai traditional medicine (“Khod-Kha-Mao”). The ethnopharmacological uses of AL as a single crude extract or as a component in herbal medicine formulas include the treatment of rheumatic diseases, digestive disorders, night blindness, influenza [1], fever and cold [2], and as a diuretic and stomachic drug [3]. These ethnopharmacological uses are supported by the wide range of pharmacological activities of AL in various diseases [4]. The crude extracts (ethanolic, water, benzene, and methanol) of AL rhizomes and its major constituents (β-eudesmol, Atractylodin (ATD), hinesol, atractylon, atractykochromene, and quinone) have been demonstrated for various pharmacological activities, e.g., anticancer, antimicrobial (Staphylococcus aureus (S. aureus), Escherichia coli, Saccharomyces cerevisiae, Candida albicans, Rhodotorula glutinis, and Saprolegnia), anti-inflammatory, immunomodulatory, analgesic, antipyretic and hepatoprotective activities, as well as activities on gastrointestinal, nervous, and cardiovascular systems and various microorganisms [5]. A series of studies conducted by our group confirm the potential of AL for further development as a chemotherapeutic for cholangiocarcinoma, the bile duct cancer [6,7]. Atractylodin (ATD) (Figure 1) and β-eudesmol are the main compounds of AL and have commonly been used as markers of biological and pharmacological activities, as well as chemical markers for quality control of standardized extract of AL [8].
Bioanalysis of AL is challenging due to its complexity and the large number of constituents [9]. Gas Chromatography (GC), High-Performance Liquid Chromatography (HPLC) and Liquid Chromatography-Mass Spectrometry (LC-MS) have been widely employed for the identification and quantitation of these constituents, particularly ATD and β-eudesmol [8,10-14]. Recently, Ultra-Performance Liquid Chromatography coupled with electron spray ionization LTQ-Orbitrap high-resolution Mass Spectrometry (UPLC-LTQ-Orbitrap MS) has been established for compositional analysis of Atractylodes spp. [15]. As several components may contribute to each pharmacological activity of the crude AL extract, it is likely that bioanalysis and investigation of the concentration-time profile (pharmacokinetic study) of a single constituent by these methods may not be correlated well with the overall pharmacodynamic activity of AL. Bioassay, which is based on the measurement of the total activity of all constituents, however, would better reflects the sum of bioactivity of all constituents in the herbal extract. The aim of the present study was to establish a high-throughput bioassay method for the determination of the total bioactivity of AL against cholangiocarcinoma cells (expressed as ATD equivalent concentration) in human serum samples. In addition, a simple HPLC-UV method for the determination of plasma concentrations of ATD was also developed. Both methods were successfully applied for the pharmacokinetic study of AL in Thai patients with advanced-stage cholangiocarcinoma.
Chemicals
Atractylodin (ATD) (Figure 1) was purchased from Shanghai Run-Biotech Co., Ltd (Shanghai, China). The internal standard for HPLC analysis 1,8-dihydroxyanthraquinone (Figure 2) was purchased from Merck (Darmstadt, Germany). HPLC grade reagents (acetonitrile and dichloromethane) were purchased from Fisher Scientific (New Hampshire, USA). Ultrapure analytical grade Type I water system (r>18 MΩ/cm) was produced by a Milli-Q Plus™ water system (Millipore Corporation, Bedford, MA, USA). MTT [3-(4, 5-dimethylthiazol-2-yl)-2, 5-diphenyltetrazolium bromide] was purchased from Sigma Chemical Co. (St. Louis, Mo, USA). Other analytical grade chemicals were purchased from Sigma Chemical Co. (St. Louis, Mo, USA).

Figure 1: Chemical structures of Atractylodin (ATD).

Figure 2: 1,8-dihydroxyanthraquinone (internal standard for HPLC analysis).
Bioassay for determination of ATD in serum samples
Preparation of bacterial suspension: The test organism Staphylococcus aureus (S. aureus) ATCC 25923 strain was obtained from the Department of Medical Sciences, Ministry of Public Health of Thailand. Biochemical identification of the organism was performed using the methods. [16].
To prepare stock culture, bacteria colonies were isolated in blood agar (Difco Laboartories, Detroit, Mich.), and a single colony was transferred to LB broth (Difco Laboratories, Detroit, Mich.) and incubated overnight (18-20 h) at 37°C. The bacterial colonies were suspended to the turbidity of the 0.5 McFarland standards to achieve bacterial density of 1 × 10⁸ CFU/ml and diluted to obtain the optimal numbers of bacteria colonies (1 × 10⁴ CFU/ ml) [17].
The stock culture was measured spectroscopically at the wavelength nm 600 (A 600) and the optical density was adjusted to 0.5 using McFarland No. 5 to obtain the optimal numbers of bacteria colonies (1 × 10⁴ CFU/µl). The stock culture was stored at 4°C and was suitable for the assay within one week of refrigeration.
Preparation of standard drug solutions: The stock solution of ATD (1,000 ng/µl) was prepared in Dimethylsulfoxide (DMSO), dispensed into small aliquots, and frozen at -20°C. Working standard solutions used for serum assay were prepared by two-fold serially diluting the stock solution (50 µl) with the human blank serum to final concentrations of 0.39, 0.78, 1.56, 3.13, 2.56 and 50 ng/µl. Serum samples used for preparing working standard solutions were screened for lack of activity against S. aureus ATCC 25923 strain. All working standards were stored at 4°C and were used for a period of up to 1 month.
Bioassay procedure: For each assay, serum (20 µl) containing different concentrations of ATD (0, 0.39, 0.78, 1.56, 3.13, 2.56 and 50 ng/µl; triplicate wells each) was pipetted with an Eppendorf pipette into each well of the 96-well microtiter plate (Thermo scientific (Suzhou) Instruments Co, Suzhou, Jiangsu, China) containing 150 µl of the prepared bacterial suspension in LB broth. The bacterial suspension was prepared just prior to each analysis in LB broth with inoculums containing approximately 1 × 10⁴ Colony-Forming Unit (CFU) per ml. The microtiter plate was then incubated at 37°C for 18-24 h.
Determination of S. aureus growth by MTT assay: Following an 18-24 h incubation period, 10 µl of the 5 mg/ml stock solution of MTT solution (20 µl of 5 mg/ml) was added to each well of the plate. The plate was left at room temperature (25°C) for 5 min and optical density reflecting bacterial growth was measured at 570 nm using a microplate reader (Molecular Devices Corporation, CA, USA). The blank well consisted of LB Both and MTT. The yellow MTT dye was reduced by succinic dehydrogenase in the mitochondria of viable bacteria to purple formazan crystals. The percentage of bacterial growth compared to the untreated control well was determined with the equation:
Bacterial growth (%)=OD of drug-treated wells/OD of control wells
A calibration curve was constructed by plotting on the y-axis the percent bacteria growth vs. the log ATD concentration on the x-axis and nonlinear regression analysis of sigmoidal dose- response (variable slope) was performed using automated curve fitting software (Calcusyn TM, Biosoft, Cambridge, UK). The function used was
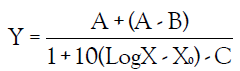
Where Y is the level of the percent bacteria growth, X is the dilution factor, A is the low level of the optical densities limit, B is the high level of the optical densities limit, X0 and C is the slope of the linear portion of the dose-response curve.
Total bioactivity of AL against S. aureus in serum sample was determined from the calibration curve and expressed as ATD equivalent concentration (ATDeq-Sa). Total bioactivity of AL against cholangiocarcinoma cells in serum samples was obtained by multiplying the ATDeq-Sa with the IC50 ratio of AL in cholangiocarcinoma and S. aureus (multiplying factor) and expressed as ATDeq-cca. The average IC50 of the crude ethanol extract of AL in various cholangiocarcinoma cell lines is 30 µg/ ml [6] and the IC50 of the crude ethanol extract of AL in S. aureus obtained from the present study is 11.42 µg/ml. Therefore, the multiplying factor used to determine the total bioactivity of AL against cholangiocarcinoma cells is 30/11.42=2.63.
Assay validation
Calibration curves: To determine the linearity of its response to ATD, S. aureus ATCC 25923 was tested using the above assay procedure. Calibration curves for serum samples were prepared by spiking standard solutions of ATD at concentrations of 0.39, 0.78, 1.56, 3.13, 2.56 and 50 ng/µl. The percentage of growth inhibition obtained from replicate samples, a calibration curve (dose-response curve) was plotted on semi-log graph paper and fitted to the least square regression line as described above.
Precision: The precision of the method based on within-day repeatability was determined by replicate analysis of six sets of serum samples (20 µl each) spiked with different concentrations of ATD (0.39, 0.78, 1.56, 3.13, 2.56, and 50 ng/µl). The reproducibility (day-to-day variation) of the method was validated using the same concentration range of plasma as described above, but only a single determination of each concentration was made on six different days. The Coefficient of Variation (CV) was calculated from the ratios of Standard Deviation (SD) to the mean and expressed as a percentage.
Accuracy: The accuracy of the method was determined by replicate analysis of six sets of serum samples (20 µl each) spiked with different concentrations of ATD (0.39, 0.78, 1.56, 3.13, 2.56, and 50 ng/µl) and comparing the difference between spiked values and those actually found (theoretical value).
Limit of quantification: The Limit of Quantification (LOQ) of the assay procedure was determined from the lowest concentration of ATD (in spiked serum samples) that produced growth inhibition.
HPLC-UV for determination of ATD in plasma samples
Preparation of standard drug solutions: Stock solutions of ATD and the internal standard were prepared at the concentration of 1,000 µg/ml. The stock solutions were further diluted with acetonitrile to obtain working solutions at concentrations of 5 ng/ml and 250 ng/ml, respectively. Standard solutions were stored at -80°C until use.
Chromatography: The method was developed on a chromatographic system consisting of the elution solvent delivery (SpectraSystem P4000 Quaternary Solvent Delivery/Controller: Thermo Fisher Scientific, CA, USA), equipped with solvent degasser (SpectraSystem SCM1000 Solvent Degasser: Thermo Fisher Scientific, CA, USA), an auto-sampler (SpectraSystem AS3500: Thermo Fisher Scientific, CA, USA) and a UV detector (SpectraSystem UV/Vis 3000: Thermo Fisher Scientific, CA, USA). The wavelength was set at 340 nm. The separation was carried out on a reversed-phase column (Thermo Hypersil Gold C18, 250 mm × 2.1 mm id, 5 µm: Thermo Scientific, CA, USA). The elution solvent consisted of acetonitrile and distilled water at the ratio of 70:30 (v:v). The chromatographic analysis was operated at 25°C. Aliquots of 200 µl samples or standard solutions were injected onto the column with an elution buffer at a flow rate of 1.0 ml/min.
Sample preparation: The procedure was validated on specimens using 1 ml of spiked human plasma. Outdated human plasma was obtained from the Blood Bank of Thammasat Chalermprakiet Hospital and stored frozen in aliquots at -20°C. To 1 ml plasma, 20 µl internal standard working solution (250 ng/ml) was added. After thoroughly mixing, 2 ml of acetonitrile was added. The mixture was vortexed for 30 seconds and centrifuged at 3,000 Xg for 10 min. The supernatant was transferred to a 15 ml test tube and extracted with 4 ml of dichloromethane for 30 minutes. The organic phase (upper layer) was separated through centrifugation at 3,000 Xg (4°C) for 10 min. The organic phase was transferred to a new polypropylene tube and evaporated to dryness under the nitrogen stream at 40°C. The residue was reconstituted with 100 µl of the mobile phase and filtered through a 0.22 µm nylon filter membrane, and an aliquot of 40 µl was injected onto the column.
Calibration curves: The calibration curves were prepared by replicate analysis of eight plasma samples (1 ml each) spiked with varying concentrations of ATD (2.5, 5, 10, 25, 50, 100, 250, and 500 ng/ml) and a fixed concentration of the internal standard (250 µg/ml). Samples were analyzed as described above.
Data analysis: Peak height ratios of ATD/internal standard were calculated. Concentrations of ATD in plasma samples were determined by matching peak height responses against a calibration curve of response ratio (height of ATD/height of internal standard) vs concentration, obtained from standard sample injection. The internal standard corrected for variation in the sample preparation (protein precipitation/dilution) steps used. Peak detection, peak height integration, peak height ratio calculation, calibration curve fitting (least square regression without weighting) and analysis of sample concentrations were performed by the Millenium 2000 Chromatograph™ software (Waters, Milford, MA, USA).
Method validation
Precision: The precision of the methods for the determination of ATD in plasma samples based on within-day repeatability was determined by replicate analysis of six sets of samples spiked with three different concentrations (25, 100, and 500 ng/ml) of ATD. The reproducibility (day-to-day variation) of the method was validated using the same concentration range, but only a single determination of each concentration was made on six different days. The CV values were calculated from the ratios of SD to the mean and expressed as percentage values.
Accuracy: The accuracy of the methods for the determination of ATD in plasma samples was determined by replicate analysis of six sets of samples spiked with three different concentrations of ATD (25, 100, and 500 ng/ml) and comparing the difference between spiked value and that actually found (theoretical value).
Recovery: The analytical recovery of sample preparation procedure for ATD in plasma samples was estimated by comparing the peak heights obtained from samples prepared as described above, with those measured with post-extraction sample spiked with equivalent amounts of ATD or internal standard. Triplicate analysis of ATD was performed at the concentrations of 50, 100, and 500 ng/ml. The triplicate analysis of internal standard was performed at a single concentration of 250 ng/ml.
Selectivity: The selectivity of the method was verified by checking for interference by commonly used drugs, i.e., paracetamol and dimenhydrinate after subjecting them to sample preparation procedures.
Limit of quantification: The LOQ of the assay procedure was determined from the lowest concentration of ATD (in spiked plasma samples) that produced a peak height ten times the baseline noise at a sensitivity of -0.2 µA in a 1 ml sample.
Stability: The stability of ATD in plasma samples was determined by storing spiked plasma samples (concentrations 50, 100, and 500 ng/ml; triplicate analysis for each concentration) in a -80°C freezer (Sanyo, Japan) for three months. Concentrations were measured periodically (1, 15 days and 1 and 3 months). For freeze and thaw stability, plasma samples were frozen at -80°C for at least 24 h and thawed unassisted at room temperature (25°C). When completely thawed, the samples were transferred back to the original freezer and refrozen for at least 24 h. The process was repeated for three cycles.
Quality control: Quality Control (QC) samples for ATD were made up in plasma samples using a stock solution separate from that used to prepare the calibration curve at the concentrations 25, 100 and 500 ng/ml (triplicate each). Samples were aliquotted into cryovials and stored frozen at -80°C for use with each analytical run. The results of the QC samples provided the basis of accepting or rejecting the run. At least four of every six QC samples had to be within ± 20% of their respective nominal value. Two of the six QC samples could be outside the ± 20% of their respective nominal values but not at the same concentration.
Application of the bioassay and HPLC-UV methods to biological samples
The developed bioassay and HPLC-UV methods were applied for the investigation of the pharmacokinetics of total serum bioactivity (anticholangiocarcinoma) of AL (ATDeq-cca) and plasma concentrations of ATD in five Thai patients with advanced- stage cholangiocarcinoma (aged 48-62 years and weighing 50- 62 kg) who received treatment with capsule formulation of the standardized extract of AL (Kao Laoor Co. Ltd., Thailand) at a single dose of 1,000 mg (contained 22.05 mg ATD). Approval of the study was obtained from the Ethics Committee of Thammasat University. Written informed consents were obtained from all patients before study. Venous blood samples (6 ml) were collected (3 ml into the heparinized-coated plastic tube and 3 ml into the plain tube) at the following time points: 0 (before dose) and 0.5, 1, 1.5, 2, 2.5, 3, 4, 5, and 6 h after dosing. Plasma (for ATD analysis) and serum (for analysis of total bioactivity) samples were separated through centrifugation at 2,000 Xg (15 minutes) and stored at -20°C until analysis.
Bioassay for determination of total bioactivity of AL in serum samples
Determination of the total bioactivity of AL was performed in serum samples to avoid interference of endogenous substances with the assay. Serum samples were heat-activated at 60°C to remove microbial contamination. The bioactivity (anticholangiocarcinoma activity) was expressed as ATDeq-cca.
Calibration curves: Serum analysis was calibrated within the concentration range of 0.39-50 ng/µl ATD (Figure 3). All calibration ranges yielded linear relationships with correlation coefficients of 0.990 or better.

Figure 3: Calibration curve of total bioactivity of AL extract in serum against S. aureus (expressed as ATDeq-cca) at the concentration range of 0.39–50 μg/ml.
Precision: Low variation of ATDeq-cca assay in serum samples was observed; Coefficients of Variation (CV) for three analyses at the three concentrations (0.78, 6.50 and 25.00 µg/ml) were all below 15%. The intra-assay (within-day) and inter-assay (day-to- day) variations for ATDeq assay in serum samples are summarized in Table 1. For intra-day assay validation, the Coefficients of Variation (CV) varied between 6.49% and 14.63%. The inter-day assay CV varied between 7.92% and 8.33%.
Accuracy: Good accuracy was observed from both the intra-day and the inter-day assays, as indicated by the minimal deviation of mean values found with measured samples from that of the theoretical values (actual amount added). The intra-assay (within- day) and inter-assay (day-to-day) accuracy for ATDeq assay in serum samples are summarized in Table 1. For the intra-day assay, the Mean Deviation from the theoretical Values (MDV) varied between -6.04% and+10.55%. The inter-day assay MDV varied between -3.01% and +9.69%.
| Concentration of ATD added (mg/ml) | Precision (%CV) | Accuracy (%DMV)a | ||
|---|---|---|---|---|
| Intra-assay | Inter-assay | Intra-assay | Inter-assay | |
| 25.00 | 14.63 | 8.17 | -6.91 | -4.15 |
| 6.50 | 9.52 | 8.33 | +6.04 | +3.01 |
| 0.78 | 6.49 | 7.92 | +10.55 | +9.69 |
a %DMV=deviation of mean value from theoretical value (%).
Table 1: Summary of assay precision and accuracy (intra-assay and interassay) for total bioactivity of AL in serum samples by bioassay method (expressed as ATD equivalent concentration: ATDeq-cca).
Limit of quantification: The limit of LOQ of ATDeq-cca by bioassay method was accepted as 1.66 µg/ml using 20 µl serum sample.
HPLC-UV method for determination of ATD in plasma samples
An HPLC-UV assay procedure was developed based on reversed- phase chromatography with UV detection for the specific, sensitive, accurate and reproducible quantitative analysis of ATD in human plasma samples. The method was based principally on the previously described method with modifications [18]. Development of the assay method was performed using plasma samples as it is the commonly used biological sample (clean and high quality samples) for pharmacokinetic study.
Chromatographic separation: A number of HPLC chromatographic systems were investigated to optimize the separation of ATD and the internal standard 1,8-dihydroxyanthraquinone. Retention maps were generated for both compounds as a function of the stationary phase and elution solvent (mobile phase). For the elution solvent, the composition of acetonitrile: distilled water (70:30, v:v) with a reversed-phase (5 µm, 250 mm × 2.1 mm; Thermo Hypersil Gold) column resulted in good separation with optimal separation. The retention times of internal standard and ATD were approximately 6.5, and 9.6 min, respectively. The chromatograms showed a good baseline separation. A chromatogram of the standard solution of ATD (100 ng/ml) and the internal standard (250 ng/ml) is shown in Figure 4.

Figure 4: Chromatograms of the standard solution of internal standard (IS: 250 ng/ml), and atractylodin (ATD: 100 ng/ml).
Sample preparation: A number of sample preparation procedures were investigated to optimize the extraction of ATD, and the internal standard from plasma samples. The optimal sample preparation procedure used in this study was simple, involving only a two steps of protein precipitation by acetonitrile followed by liquid-liquid extraction by organic solvent (dichloromethane), which resulted in clean chromatograms.
Calibration curves: Plasma analysis of ATD was calibrated using the concentration range of 2.5-500 ng/ml. All calibration ranges yielded linear relationships with correlation coefficients (r) of 0.999 or better.
Method validation
Precision: Low variation of ATD assay in plasma samples was observed; Coefficients of Variation (CV) for eight analysis at the three concentrations (25, 100 and 500 ng/ml) were all below 5%. The intra-assay (within-day) and inter-assay (day-to-day) variations for ATD assay in plasma samples are summarized in Table 2. For intra-day assay validation, the Coefficients of Variation (CV) varied between 0.9% and 2.9%. The inter-day assay CV varied between 2.2% and 3.3%.
| Concentration added (ng/ml) | Precision (%CV) | Accuracy (%DMV)a | ||
|---|---|---|---|---|
| Intra-assay | Inter-assay | Intra-assay | Inter-assay | |
| 25 | 2.2 | 3.3 | 6.1 | 7.0 |
| 100 | 0.9 | 2.0 | 3.3 | 2.4 |
| 500 | 2.9 | 2.2 | 0.2 | 2.9 |
a %DMV=deviation of mean value from theoretical value (%).
Table 2: Summary of assay precision and accuracy (intra-assay and interassay) for ATD assay in plasma samples by HPLC-UV method.
Accuracy: Good accuracy was observed from both the intra-day and the inter-day assays, as indicated by the minimal deviation of mean values found with measured samples from that of the theoretical values (actual amount added). The intra-assay (within-day) and inter-assay (day-to-day) accuracy for ATD assay in plasma samples are summarized in Table 2. For the intra-day assay, the Mean Deviation from the theoretical Values (MDV) varied between 0.2% and 6.1%. The inter-day assay MDV varied between 2.9% and 7.0%.
Recovery: The mean recoveries for ATD at 50, 100 and 500 ng/ ml were 75.6%, 77.4% and 76.2%, respectively. The recovery of the internal standard at the concentration of 250 ng/ml was 79.9%. The results reflect essentially high recovery for both compounds from the spiked plasma samples and indicate a lack of interference from the sample preparation procedure.
Selectivity: The selectivity of the chromatographic separation was demonstrated by the absence of interferences from endogenous peaks in blank plasma (Figure 5), plasma sample spiked with 100 ng/ml ATD (Figure 6), and plasma sample spiked with paracetamol (100 ng/ml) and dimenhydrinate (100 ng/ml) (Figure 7).

Figure 5: Chromatograms of blank plasma.

Figure 6: Chromatograms of plasma sample spiked with 100 ng/ ml ATD.

Figure 7: Chromatograms of plasma sample spiked with paracetamol (100 ng/ml) and dimenhydrinate (100 ng/ml).
Limit of quantification: The LOQ of ATD in human plasma samples was accepted as 2.5 ng/ml using 1 ml plasma.
Stability: Results from the present study show that plasma samples containing ATD at concentrations of 25, 100 and 500 ng/ml were found to be stable when stored in a -80°C freezer for a minimum of three months without significant decomposition of the drug (Table 3). Freeze and thaw stability of ATD in plasma expressed as the deviation of the mean from the values before the three freeze and thaw cycles procedure were determined by repeated analysis of three aliquots of samples at three different concentrations (25, 100, and 500 ng/ml). Aliquots of each sample were stored at the intended storage temperature for 24 h and thawed at room temperature. When completely thawed, they were refrozen for 24 h under the same conditions. The freeze- thaw cycle was being repeated three times and then analyzed after the third cycle (Table 4).
| Atractylodin (ng/ml) | Mean | SD | %DMVa | |
|---|---|---|---|---|
| 1 day | 25 | 23.9 | 1.7 | 6.8 |
| 100 | 103.4 | 2.4 | 5.6 | |
| 500 | 478.2 | 23.0 | -4.3 | |
| 15 days | 25 | 24.2 | 1.9 | 8.4 |
| 100 | 99.2 | 3.4 | -3.4 | |
| 500 | 492.6 | 12.8 | -1.46 | |
| 30 days | 25 | 25.4 | 52.8 | 2.8 |
| 100 | 101.3 | 3.8 | 6.4 | |
| 500 | 496.9 | 512.4 | 19.5 | |
| 90 days | 25 | 26.1 | 53.8 | 5.6 |
| 100 | 102.3 | 2.9 | 6.7 | |
| 500 | 510.3 | 520.9 | 20.8 |
a%DMV=deviation of mean value from the theoretical value (%).
Table 3: Storage stability data of ATD in plasma at concentrations 25, 100, and 500 ng/ml.
| Storage condition | Target concentration (ng/ml) | Measured concentration (mean + SD: ng/ml) |
|---|---|---|
| Freshly prepared | 25 | 26.1 ± 0.8 |
| 100 | 103.2 ± 1.8 | |
| 500 | 501.3 ± 1.2 | |
| 6 h at room temperature (25 °C) | 25 | 24.1 ± 0.3 |
| 100 | 104.9 ± 2.5 | |
| 500 | 502.2 ± 1.2 | |
| 1 freeze-thaw cycle | 25 | 23.4 ± 0.7 |
| 100 | 105.1 ± 2.5 | |
| 500 | 492.1 ± 1.0 | |
| 2 freeze-thaw cycles | 25 | 23.3 ± 1.1 |
| 100 | 105.2 ± 3.5 | |
| 500 | 501.6 ± 1.5 | |
| 3 freeze-thaw cycles | 25 | 26.7 ± 3.1 |
| 100 | 102.8 ± 3.9 | |
| 500 | 509.3 ± 1.2 |
Table 4: Freeze and thaw stability for ATD in spiked plasma samples at concentrations of 50, 500 and 1500 ng/ml at room temperature (freshly prepared) and following three freeze (-80 °C)-thaw cycles.
Application of the developed methods for human pharmacokinetic study
Total anticholangiocarcinoma activity-time profiles of AL in serum samples by bioassay: To demonstrate the clinical applicability of the developed method, ATDeq-cca concentrations in serum samples collected from five patients with advanced- stage cholangiocarcinoma during 0-6 hours were determined by the bioassay method following oral doses of capsule formulation of the standardized AL extract at a single dose of 1,000 mg (containing 22.05 mg ATD). The ATDeq-cca representing total anti cholangiocarcinoma activity of AL in serum samples from the five patients are presented in Table 5. The average maximum serum bioactivity of 16.54 ATDeq-cca concentration was achieved at 0.5 hour. At the last sampling time point (6 hours), ATDeq-cca was not detectable in two patients, while low activity (2.63-9.70 ATDeq-cca) was detected in three patients.
| Time (h) | ATDeq-cca (µg/ml) | |||||
|---|---|---|---|---|---|---|
| Subject no 1 | Subject N0. 2 | Subject No. 3 | Subject No. 4 | Subject No. 5 | Mean (SD) | |
| 0 | 0 | 0 | 0 | 0 | 0 | 0 |
| 0.5 | 16.72 | 14.93 | 17.62 | 16.91 | 7.88 | 16.54 |
| 1.0 | 23.30 | 8.52 | 10.04 | 10.70 | 5.92 | 13.14 |
| 1.5 | 13.93 | 6.89 | 11.23 | 5.65 | 4.38 | 9.42 |
| 2.0 | 10.09 | 2.39 | 15.22 | 7.99 | 3.94 | 8.92 |
| 2.5 | 10.94 | 5.49 | 9.28 | 7.83 | 6.63 | 8.38 |
| 3.0 | 7.31 | 0 | 12.43 | 4.73 | 4.86 | 6.12 |
| 4.0 | 8.73 | 0 | 8.65 | 3.70 | 3.07 | 5.27 |
| 5.0 | 4.10 | 0 | 6.65 | 2.20 | 4.14 | 3.24 |
| 6.0 | 2.68 | 0 | 9.70 | 0 | 2.69 | 3.09 |
Table 5: Serum total bioactivity (anti cholangiocarcinoma activity) of AL extract expressed as ATDeq-cca.
Plasma concentrations of ATD determined by HPLC-UV: To demonstrate the clinical applicability of the developed method, ATD concentrations in plasma samples collected from five patients with advanced-stage cholangiocarcinoma during 0-6 hours were determined by the bioassay method following oral doses of capsule formulation of the standardized AL extract at a single dose of 1,000 mg (containing 22.05 mg ATD) (Table 6). The average maximum plasma concentration of ATD of 65.90 ng/ml was achieved at 2.5 hour. At the last sampling time point (6 hours), ATD was not detectable in two patients, while low concentrations (5.20-14.95 ng/ml) were detected in three patients.
| Time (h) | ATD (ng/ml) | |||||
|---|---|---|---|---|---|---|
| Subject no 1 | Subject N0. 2 | Subject No. 3 | Subject No. 4 | Subject No. 5 | Mean (SD) | |
| 0 | 0 | 0 | 0 | 0 | 0 | 0 |
| 0.5 | 4.76 | 10.9 | 126.91 | 10.56 | 13.03 | 33.232 |
| 1.0 | 5.57 | 48.69 | 147.43 | 15.91 | 32.04 | 49.928 |
| 1.5 | 7.07 | 58.90 | 58.27 | 23.45 | 41.44 | 37.826 |
| 2.0 | 14.12 | 70.42 | 42.20 | 40.90 | 61.32 | 45.792 |
| 2.5 | 46.04 | 92.1 | 48.31 | 52.68 | 90.41 | 65.908 |
| 3.0 | 38.48 | 83.56 | 26.61 | 70.74 | 68.48 | 57.574 |
| 4.0 | 29.84 | 56.80 | 14.82 | 61.20 | 40.06 | 40.544 |
| 5.0 | 12.21 | 23.32 | 7.20 | 47.33 | 25.01 | 23.014 |
| 6.0 | 0 | 5.20 | 0 | 10.20 | 14.95 | 6.07 |
Table 6: Plasma concentrations of ATD analyzed by HPLC-UV.
Comparison of serum bioactivity expressed as ATDeq-cca and plasma ATD concentrations in all patients are presented in Figure 8. It was noted for a marked difference in the pharmacokinetic profiles of AL when using ATD and ATDeq-cca as biomarkers for antichoolangiocarcinoma. Full pharmacokinetic investigation of AL in a larger number of patients is underway. A bioassay procedure based on the colorimetric method for analysis of the total bioactivity of AL against cholangiocarcinoma in human serum as well as an HPLC-UV method for determination of ATD in plasma is described. Both analytical methods meet the criteria of high sensitivity, accuracy and reproducibility for routine use in pharmacokinetic studies [19,20].

Figure 8: Mean serum AL bioactivity (expressed as ATDeq-cca) and
plasma ATD concentrations in five patients with advanced-stage
cholangiocarcinoma. Note:  Mean ATDeq-cca concentrartion
(μg/ml),
Mean ATDeq-cca concentrartion
(μg/ml),  Mean ATD concentrartion (ng/ml).
The newly developed bioassay method for the determination of total anti-cholangiocarcinoma activity has advantages over other conventional analytical methods as it reflects the sum of the activity of all identified and unidentified active constituents. The endpoint of measurement was inhibition of bacterial growth assessed spectroscopically by MTT assay, which provides a high throughput platform for the assay. This would offer a realistic analysis of the pharmacokinetic-pharmacodynamic relationship of AL in patients who receive AL for treatment of cholangiocarcinoma as well as bacterial infections. The HPLC- UV method for the determination of Atractylodin (ATD) in plasma established in this study meets the criteria for application to routine clinical drug level monitoring or pharmacokinetic study Although liquid-liquid extraction is time-consuming, Solid-Phase Extraction (SPE) is relatively expensive, which is not applicable for most laboratories. The advantage of the method over previously reported ones is its rapidity, simplicity, and high sensitivity with simple UV detection. Besides, the sample preparation procedure is simple, faster and less expensive.
All authors declare no competing interest.
All data is included within the manuscript, and any further information is available from the author upon request.
The study was supported by National Research Council of Thailand, and Research and Innovation of Thailand (Frontier Research Seed Fund grant number TUFF20/2564), and Thammasat University (Center of Excellence in Pharmacology and Molecular Biology of Malaria and Cholangicarcinoma). Kesara Na-Bangchang is supported by the National Research Council of Thailand under the Research Team Promotion grant (grant number 820/2563). Nadda Muhamad is supported by Thailand Research Fund under the Royal Golden Jubilee Ph.D. Program (grant number PHD/0095/2561). The authors have no relevant affiliations
[Crossref] [Google Scholar] [PubMed]
[Crossref] [Google Scholar] [PubMed]
[Crossref] [Google Scholar] [PubMed]
[Crossref] [Google Scholar] [PubMed]
[Crossref] [Google Scholar] [PubMed]
[Crossref] [Google Scholar] [PubMed]
[Crossref] [Google Scholar] [PubMed]
[Crossref] [Google Scholar] [PubMed]
[Crossref] [Google Scholar] [PubMed]
[Crossref] [Google Scholar] [PubMed]
[Google Scholar] [PubMed]
[Crossref] [Google Scholar] [PubMed]
[Crossref] [Google Scholar] [PubMed]
[Crossref] [Google Scholar] [PubMed]
[Crossref] [Google Scholar] [PubMed]
Citation: Cheoymang A, Muhamad N, Kulama I, Na-Bangchang K (2022) High-throughput Bioassay and HPLC-UV Methods for Determination of the Bioactivity of Atractylodes lancea and Its Bioactive Constituent Atracylodin in Biological Samples: Application for Pharmacokinetic Study in Patients with Advanced-stage Cholangiocarcinoma. Adv Tech Biol Med. 10:343.
Received: 03-Mar-2022, Manuscript No. ATBM-22-16105; Editor assigned: 07-Mar-2022, Pre QC No. ATBM-22-16105 (PQ); Reviewed: 21-Mar-2022, QC No. ATBM-22-16105; Revised: 28-Mar-2022, Manuscript No. ATBM-22-16105 (R); Published: 04-Apr-2022 , DOI: 10.35248/2379-1764.22.10.343
Copyright: © 2022 Cheoymang A, et al. This is an open-access article distributed under the terms of the Creative Commons Attribution License, which permits unrestricted use, distribution, and reproduction in any medium, provided the original author and source are credited.
Sources of funding : The study was supported by National Research Council of Thailand, and Research and Innovation of Thailand (Frontier Research Seed Fund grant number TUFF20/2564), and Thammasat University (Center of Excellence in Pharmacology and Molecular Biology of Malaria and Cholangicarcinoma). Kesara Na-Bangchang is supported by the National Research Council of Thailand under the Research Team Promotion grant (grant number 820/2563). Nadda Muhamad is supported by Thailand Research Fund under the Royal Golden Jubilee Ph.D. Program (grant number PHD/0095/2561). The authors have no relevant affiliations