Journal of Ergonomics
Open Access
ISSN: 2165-7556
ISSN: 2165-7556
Research Article - (2017) Volume 7, Issue 6
Vibration is an inevitable phenomenon in machine tools. Human body can withstand certain threshold limit values (TLV) of vibration, above which it is injurious to health. This work is to study about the impact of vibration and various factors which contribute to vibration during demolition activity. Field study is conducted using demolition hammers and corresponding vibration intensities are measured using accelerometer sensors. The sensors are connected to vibrometer which measures response in units of frequency-weighted vibration (m/s2). Statistical analysis is carried out using l9 orthogonal array technique with four factors as handling time, tool position, age of worker and tool characteristics (low duty, medium duty and high duty). Percentage contribution of vibration is analyzed for each factor. Among them tool characteristics and tool usage time contributes nearly to forty-six and thirty-one percentage respectively. The study is conducted infield lab built of concrete material and the recorded vibration intensities are analyzed using Minitab software.
Keywords: Vibrometer; Hand-arm vibration syndrome; Hammers; Ergonomics
Demolition activities are carried out around the clock on many construction sites. High speed demolition hammers powered by electric motors are used for these activities. These tools are designed to work under high rpm (rotations per minute) depending upon the load conditions. It results in vibration exposure to the hand-arm of the workers during demolition. The physical nature of vibration can be explained by frequency of vibration. “Frequency” describes the number of vibrating movements in a given time period. Frequency is measured in “cycles per second or hertz (Hz)”. An object vibrating with a frequency of one hertz completes one full vibrating cycle over one second.
In general, vibration exposures of two type namely segmental vibration exposure and whole body vibration exposure. This work concerns with hand-arm section of human body which comes under segmental vibration exposure. Hand-arm vibration syndrome (HAVS) [1] is a collection of symptoms caused by vibration which transmits into the hands and arms through the palms and fingers. It will develop while handling hand-held power equipment. This syndrome affects the nerves, blood vessels, muscles and joints of the hand, wrist and arm. It can become very disabling if early symptoms are ignored. In this study the magnitude of vibration is measured using accelerometers attached to the hand-arm of workers.
Electric hammers play a vital role in demolition activities. Men workers are employed for these activities in many construction sites. Various studies are carried out to determine the health hazards of vibration.
This work is to quantify the factors which contribute to vibration by conducting analysis using Taguchi’s L9 Orthogonal Array technique. This study is conducted in field lab with workers who are performing demolition activities. Demolition hammers of three different load types as Low, Medium and High are selected. Vibrometer is used for response measurement which measures the intensity of vibration. Cesva Capture Studio is used to display the intensity of vibration in the units of m/s2.
Barregard et al, [2] assessed Hand-arm Vibration Syndrome (HAVS) in Swedish car mechanics. Authors related HAVS and duration of exposure by conducting study with 806 subjects. The mean age of the respondents was 33. Their study concludes that inspite of short daily exposure, HAVS is common among them. They also suggest following preventive measures and recommend using nut-runners with the lowest vibration levels.
Rober G Radwin et al. [3] analyzed vibration exposure for hand power tools used in automobile assembly. Work sampling technique was used for determining vibration exposure time. Vibration acceleration and frequency are measured using accelerometers. Eight different types of tools are used for analysis. Frequency and magnitude are measured as response. This study gave idea about the methodology of work sampling in vibration analysis.
Monica Lopez-alonso et al. [4] analyzed the exposure limit values of vibrating hand-held tools in the European Union. This study analyzed the exposure level of construction workers to hand-arm vibration. For this research common construction tools were taken and the maximum time that each tool could be safely used was established. Finally, these limit values were compared to the tool vibration data provided by manufacturers. The findings of this study shows that 83% of the tool vibration data provided by manufacturers produce vibration level which exceeds the exposure limit value, after which it is necessary to take remedial action. The data still shows that there is an urgent need to reduce exposure levels by reorganizing the workplace.
Margarita Vergara et al. [5] investigated hand-transmitted vibration in power tools. Hand-arm vibration was measured in 70 tools used in different industrial sectors. Ninety workers were interviewed about their perception of vibration and the symptoms of diseases related with hand vibration. Compliance with current regulations was checked and the relationships between workers’ perception of vibration, measured vibration levels and symptoms of vibration-related disorders were analyzed. They concluded that about 15% of the tools exceeded the action limits according to applicable standards. No preventive action was taken in any of these cases. It has also been shown that workers are not really aware that the levels of vibration transmitted to their hands exceed certain limits, which represents an additional risk.
This study emphasizes the harmful effects of vibration on handarm of the workers. The aim of this work is to study the percentage contribution of each factor which contributes to vibration during demolition activity.
Demolition hammer
Demolition hammer used for this experiment is powered by electric motor. They are used for roadwork, quarrying and general demolition or construction groundwork. For experimentation three different hammers are chosen with Low, medium and high load characteristics (Figure 1).

Figure 1: Types of demolition hammer used.
Vibrometer (cesva vc431 triaxial virometer)
It measures all parameters simultaneously for hand-arm vibration. The VC431 enables all the necessary parameters to be measured simultaneously, to evaluate exposure to vibration. The ideal instrument for measuring vibration according to directive 2002/44/econ risks deriving from worker’s exposure to vibration (Figure 2).

Figure 2: Vibrometercesva v431.
Accelerometers and adapters
CESVA VC431 vibrometer with the hand held power tools are used for measuring the frequency of vibration. Screw is used to combine the vibrometer with the help of key. The sensors are connected with the vibrometer through the optical cable (Figure 3).

Figure 3: Accelerometers and adapters of vibrometer.
Taguchi experimental design-l9 orthogonal array
The selection of parameters and levels are the important steps for parametric analysis in the Taguchi method. In this study, the parameters related to factors that influence vibration exposure are considered. The time of working, tool characteristics, age of worker and the angle of impact are the four most important parameters that characterize the vibration exposure. L9 Orthogonal array is used for the present investigation. The factors and their respective levels are shown in table (Table 1).
| Experiment no. | Control factors | |||
|---|---|---|---|---|
| 1 | 2 | 3 | 4 | |
| 1 | 1 | 1 | 1 | 1 |
| 2 | 1 | 2 | 2 | 2 |
| 3 | 1 | 3 | 3 | 3 |
| 4 | 2 | 1 | 3 | 2 |
| 5 | 2 | 2 | 1 | 3 |
| 6 | 2 | 3 | 2 | 1 |
| 7 | 3 | 1 | 2 | 3 |
| 8 | 3 | 2 | 3 | 1 |
| 9 | 3 | 3 | 1 | 2 |
Table 1: General taguchi L9 orthogonal array.
Signal to noise ratio
Taguchi developed a special design of orthogonal arrays to study the entire parameter space with a small number of experiments. The experimental results are then transformed into a signal-tonoise (S/N) ratio. It uses the S/N ratio as a measure of quality characteristics deviating from or nearing to the desired values. There are three categories of quality characteristics in the analysis of the S/N ratio, i.e. the smaller the better, the larger the better, and the nominal the best.
Smaller the better: It is a non-negative measurable characteristic having an ideal target as zero.
It is used where the smaller value is desired.
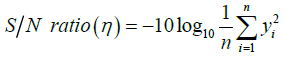
Where, yi=observed response value
n=number of replications.
Nominal the best: When we have a characteristic with bi-lateral tolerance, the nominal value is the target. That is, if all part is made to this value, the variation will be zero and it is the best. It is used where the nominal or target value and variation about that value is minimum.
Where, μ=mean and σ=variance.
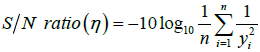
Higher the better: It is a non-negative measurable characteristic having an ideal target as infinity. It is used where the larger value is desired.
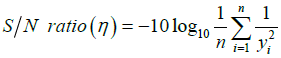
Where yi=observed response value and n=number of replications.
ANOVA is a statistical technique for determining the degree of difference or similarity between two or more groups of data. It is based on the comparison of the average value of a common component. ANOVA was used which measures the importance of each process parameter. The ANOVA technique is a quick and easy method to analyze results of the parametric design. This technique identifies the important parameters and calculates the percentage influence of each parameter on different quality characteristics. The use of both ANOVA technique and S/N ratio approach makes it less effect to analyse the results and hence, make it fast to arrive at the conclusion.
Sum of square of total: It is expressed as:
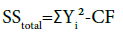
Where,
Correction Factor=(Grand total) 2/Total number of observation), Yi-observed responses value.
Sum of square of factor: SSfactor=A12/n1+A22/n2+A32/n3-CF
Where,
n=number of observation
Sum of square of error: SSerror=SStotal-SSfactor
Percentage of contribution: %C=(SSfactor/SStota)*100
Field study
Field study is done using three different hammers with Low, Medium and High range. The tools are tested before experiment. Various factors, levels and equipment capability are studied before taking field data (Table 2).
| Factors | Levels | ||
|---|---|---|---|
| 1 | 2 | 3 | |
| Time | 0.5 | 1.0 | 2.0 |
| Tool characteristics | low | medium | high |
| Age | 20-30 | 30-40 | 40-50 |
| Position (in degree) | 90 | 45 | 180 |
Table 2: Field study at different factors and levels.
Required field study factors and levels: For this study, four factors and three levels are considered for getting optimal operating condition which will reduce the vibration exposure. For the time factor, half minute, one minute and two minutes are considered (Table 3).
| S.no | Time | Tool | Age | Tool position in degree |
|---|---|---|---|---|
| 1 | 0.5 | Low | 20-30 | 90 |
| 2 | 0.5 | Medium | 30-40 | 45 |
| 3 | 0.5 | High | 40-50 | 180 |
| 4 | 1 | Low | 20-30 | 180 |
| 5 | 1 | Medium | 30-50 | 90 |
| 6 | 1 | High | 40-50 | 45 |
| 7 | 2 | Low | 20-30 | 45 |
| 8 | 2 | Medium | 30-40 | 180 |
| 9 | 2 | High | 40-50 | 90 |
Table 3: L9 orthogonal array.
Likewise, tool characteristics are based on weight, acceleration, and impact energy are considered. Age factor is considered between 20 to 30, 30 to 40 and 40 to 50. Positions of the tools are considered at 45, 90 and 180 degrees (Table 4).
| Time | Time (in min) | Tool characteristic | Age | Position In degree | Vibration 1 | Vibration 2 | Average M/ S2 |
|---|---|---|---|---|---|---|---|
| 1 | 0.5 | Low | 20-30 | 90 | 13.839 | 14.5919 | 14.21568 |
| 2 | 0.5 | Medium | 30-40 | 135 | 5.7981 | 6.95279 | 6.37548 |
| 3 | 0.5 | High | 40-50 | 180 | 9.3697 | 10.6688 | 10.0193 |
| 4 | 1 | Low | 20-30 | 180 | 13.862 | 13.9902 | 13.92645 |
| 5 | 1 | Medium | 30-40 | 90 | 11.567 | 11.0884 | 11.3278 |
| 6 | 1 | High | 40-50 | 135 | 13.087 | 13.1394 | 13.11328 |
| 7 | 2 | Low | 20-30 | 135 | 10.646 | 12.5509 | 11.5987 |
| 8 | 2 | Medium | 30-40 | 180 | 8.0798 | 8.57331 | 8.3266 |
| 9 | 2 | High | 40-50 | 90 | 10.63 | 11.7003 | 11.1654 |
Table 4: Field data.
Cesva capture studio result example
Cesva Capture Studio displays response in form of image. The image can be documented for further analysis. (Table 5 and Figures 4 and 5)
| S.no | Time | Tool | Age | Position in degree | Vibration M/S2 |
|---|---|---|---|---|---|
| 1 | 0.5 | Low | 20-30 | 90 | 13.8395 |
Table 5: Cesva capture studio result.

Figure 4: Field data taken at 90 degree.

Figure 5: Cesva capture studio.
Anova table for vibration
Based on the experimentation ANOVA table is obtained using MATLAB software. This table will relate the percentage contribution of each factor for vibration (Table 6).
| Factor | Sum of square | % contribution |
|---|---|---|
| Time | 18.383 | 31.19 |
| Tool characteristics | 27.061 | 45.91 |
| Age | 2.959 | 5.03 |
| Position in degree | 6.53 | 11.07 |
| Error | 4.005 | 6.79 |
| Total | 58.938 | 100 |
Table 6: Anova table.
Average response (s/n ratio) for vibration
The rank of various factors at three different levels is obtained using Average response table (Figure 6 and Table 7).
| Level | Time | Characteristics | Age | Position |
|---|---|---|---|---|
| 1 | -19.74 | -22.42 | -21.28-19.99 | -21.70 |
| 2 | -22.11 | -18.54 | -19.99 | -19.93 |
| 3 | -20.23 | -21.12 | -20.81 | -20.44 |
| Delta | 2.37 | 3.88 | 1.29 | 1.77 |
| Rank | 2 | 1 | 4 | 3 |
Table 7: Average response.

Figure 6: Effect of s/n ratio.
Initial set of readings for three vibratory equipment’s are obtained from the experimental setup. The intensity of vibration is recorded using Cesva Capture studio software. It is found that percentage contribution of tool characteristics and working time contributes nearly to Seventyseven percentage of total vibration intensity. This result highlights, that greater care should be given to tool selection and working time during demolition activity.
According to, Control of Vibration at Work Regulations 2005 standards by UK [6], the Exposure Limit Value for daily vibration exposure is 5 m/s2. This value is for the average working time of eight hours. But the experimentation response shows that the safe limit of vibration exceeds the standard value nearly by two times in some cases.
Various studies are carried out around the globe to study the ill effects of hand-arm vibration. But this work concerns with the causes of vibration. Further the causes are quantified and results are obtained statistically. This study stands unique from other vibrational studies in two approaches. Primarily, the subject selections, the subjects who perform experimentation are doing demolition activity for many years, secondarily, dedicated field lab selection. The field lab is a structure of 20*5 feet with depth of 5 feet. These two factors improve the accuracy of readings taken during the study.
In developing environment like India, the demolition activity is unorganized in nature. In addition to it, the tools designed are more productive but they are ergonomically used is a big question stands before us. As the workers who perform this activity are unaware of work standardization methodology and work rest cycle concepts they fall prey to ill effects of vibration in the long run.
Government support, management initiative and further research in the field of hand-arm vibration will help the workers to create better work environment in future.
The authors express their gratefulness to all field workers for their co-operation during this study.
We hereby declare that the paper is original and has not been submitted elsewhere for publication.