Journal of Fundamentals of Renewable Energy and Applications
Open Access
ISSN: 2090-4541
ISSN: 2090-4541
Research Article - (2025)Volume 15, Issue 1
Although biogas technologies have been promoted for a decade in many developing countries to reduce firewood consumption the acceptance of the technology by smallholder farmers is still low, particularly in the countries with limited biomass resources (i.e., Ethiopia). The objectives of this study was therefore to (i) Investigate the acceptance of the low degree of biogas technology; (ii) Quantify the reduction in greenhouse gas emission owing to biogas technology compared to fuel wood and charcoal. The study was conducted at Kersa South West Ethiopia in four kebeles accordingly, a total of 130 households were interviewed using simple random sampling techniques. Descriptive statistics and a probit binary logistic regression model were to examine the analysis of the low degree of biogas technology acceptance and the extent of greenhouse gas emission reduction due to usage of biogas plants. The results of the study showed educational status affected the acceptance of biogas technology more than illiterate household’s and the result indicated that from the mean of all respondents, 143 non-biogas users head and 14.1 biogas users mainly use firewood. The mean of charcoal 14.8 nonusers and 7.1 biogas users mainly use charcoal as a source of energy for cooking. Finally, the finding showed that between biogas technology users and non-biogas users there was significantly difference. Energy policies should focus on raising awareness of the community to use modern renewable energy technology
Renewable energy sources like biogas have become a significant part of the policies and strategies of many countries including Ethiopia. Strategies that assist to reduce fuel wood consumption have the potential of simultaneously using alternative renewable energy technology, conserving forests, improving human livelihoods. To overcome the fuel wood problems, alternative renewable energy sources have recently become more and betterlooking due to the increasing energy demand. This is possible because of its long life span, robustness, rigidity, easy maintenance and cleaning [1].
National biogas program of Ethiopia has planned 14,500 biogas plants for first period (2009-2013) and the program has achieved to construct 20,000 biogas plants for second phase (2014-2017) in 163 districts including the study area. However, only 8,063 and 1762 biogas plants were installed in first period and second phase respectively.
Fuel wood collection for cooking is a main driver of forest degradation in developing countries and transforming today’s use of biomass into cleaner “greener” technologies in the rural developing area would improve the standard of living, health and local environment. And also the role of biogas technology in saving biomass, mitigating Greenhouse Gases (GHG) emissions and maintaining environmental sustainability.
The consumption of biomass fuel, including charcoal and firewood, remains the main source of energy. More than 93% of the households in our country are also still dependent on biomass fuel for cooking, which surpasses 99% in rural areas.
As a result, in most areas of Sub-Saharan Africa, indoor air pollution caused by traditional cooking constitutes a major health risk [2]. According to the rampant exhaustion of fuel wood supplies, predicted increase in fuel wood demand in the future and the resulting social and environmental effects urge the need to look for alternative and clean fuel sources in developing countries.
Ethiopia is one of the top-ranking countries in Africa and among the first ten in the world in terms of livestock resources. The mainstream of the rural population in Ethiopia is involved in some way in animal husbandry. Consequently, the country has the greatest potential for the development of biogas technology. Among these factors, the number of livestock, family size and farmland size is important in determining the probability of accepting or not accepting the biogas technology. The economic status of the household heads influences the acceptance of technology and education plays a major role in the introduction of emerging innovations, including fuel-efficient stoves. Factors influencing households' acceptance of clean and modern energy fuels and technologies include education, age, household size, income and the price of fuel [3].
However, no studies have not been conducted on the current status of energy utilization and factors affecting rural households' biogas technology implementation in Kersa district. Most rural households still rely on traditional biomass energy sources and they are not even familiar with the technology. Furthermore, the progress of biogas installation is low in the study site; only 43 households use biogas technology [4].
Moreover, it is very common to observe children and women competing for dung fuel in communal grazing lands due to scarcity of fuel wood and other domestic energy sources in the study site. Thus, it is needed to investigate why the progress of biogas technology acceptance has been low. The main objective of this study was to analyze the low degree of biogas technology acceptance and the extent of GHG emission reduction due to the usage of biogas [5].
The socioeconomic constraints to adoption of biogas in SSA are further examined by Mwirigi, et al. [6]. The economic viability of small-scale biogas digesters is assessed in more detail for Uganda by Walekhwa, et al. [7]. For household digesters of volume 8 m3, 12 m3 and 16 m3, they calculate positive net present values, suggesting small-scale biogas systems are economically viable. Tumwesige, et al. also review biogas appliances for different purposes, including biogas lamps, biogas fuelled engines, refrigerators, radiant heaters and incubators [8]. Tests on locally available biogas burners show them to be of poor quality with very low efficiency.
In order to remain economically viable, the biogas digester must also be productive over the long term. Naik, et al. using wood fuel or charcoal for household energy places a daily economic burden on rural households [9]. Deforestation means that the average time spent collecting wood and the cost of charcoal are increasing. The impact on deforestation of replacing wood fuel or charcoal by biogas is discussed by Subedi, et al. [10].
Biogas digesters could further improve the livelihoods of rural households by reducing the occurrence of diseases that reduce productivity through decreased human and livestock resources, Yongabi, et al. [11].
This study was conducted in Jimma town and Kersa district, Jimma zone, Jimma town is situated 346 km from Addis Ababa. Geographically, the town is located at 70°40’N latitude and 360°60’E longitude. According to the master plan of the town, the total area of land town is 4623 hectares (Figure 1).

Figure 1: Location map of the study area.
Kersa is one of the districts in the Jimma zone of the Oromia region. Geographically, the district is located between 7°35′-8°00′N latitudes, 36°46′-37°14′E longitude and altitude that ranges from 1740 m to 2660 m above sea level and access to electricity is limited to urban areas in the Kersa district.
Sampling technique and sample size determination
A multi-stage sampling technique was followed in this study to conduct and its ability to provide equal opportunity to be included in the sample, hence the low degree of sampling error (Table 1).
The total sample size was determined by using the approach and a confidence interval level of 10% (0.1) (e), the total sample size is determined as;
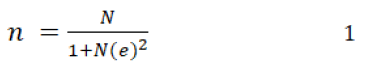
Where “n” is the sample size, “N” is the population size (total household heads size), and “e” is the level of precision. In the four kebeles, there were a total of 26362 none users’ household and 43 biogas users’ household.
Therefore,
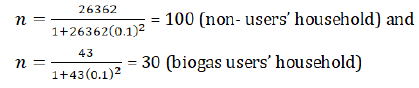
Hence, totally the sample sizes for this study were 130.
| Name of kebeles | Number of HH | Sample size | Total sample size | ||
|---|---|---|---|---|---|
| Non-users | Users | Non-users | Users | ||
| Kitimbile | 6600 | 13 | 25 | 10 | 35 |
| Merewa | 6530 | 12 | 23 | 8 | 33 |
| Toli | 6676 | 4 | 28 | 5 | 30 |
| Girma | 6556 | 14 | 24 | 7 | 32 |
| Total | 26362 | 43 | 100 | 30 | 130 |
Table 1: The distribution of sample size in each kebeles.
Estimation of greenhouse gas emission reduction and fire wood will saved due to using biogas plants
Kitchen Performance Test (KPT) was used to estimate the amount of fuel saved owing to biogas technology. It is performed in an actual kitchen in the field (Tables 2 and 3).
Sources of energy such as firewood and charcoal for cooking purposes and kerosene for lighting purposes were selected for this study. Then GHG emissions of woody biomass (firewood and charcoal) were calculated based on clean development mechanism (General guidelines of CDM methodologies) according as follows:
ERy=Y, savings*fNRB,y *NCVbiomass *ERprojected fossil fuel 2
Where;
ERy=Emission reductions during year in tone of carbon dioxide equivalent (tCO2e),
By, savings=Quantity of woody biomass that is saved in tons or kilogram per device,
fNRB, y=Fraction of woody biomass saved by the cook stove used in year y defined as non-renewable biomass.
Since more than half of fuel wood collected by household they for cooking stems from forest, it is therefore justified to assume that 88% of total consumed fuel wood stems from forest for Ethiopian case [12].
| Parameter | Values |
|---|---|
| Annual woody biomass saved per biogas (By, savings) | From KPT |
| Emission factors of fuel wood (both fire wood and charcoal) (EFbiomass) | 81.6CO2/TJ |
| Fraction of non-renewable fuel wood (fNRB, y) | 88% |
Table 2: Parameters used for calculating GHG emission.
Whereas, greenhouse gas emission from kerosene were calculated based on global standard emission estimation methodology (IPCC, 2006) as following:
EFi=EF × NHV 3
Emission reduced from kerosene consumption (kg)=Average kerosene saved per HH (L) × EFi (Kg/L) 4
Where;
EF: Default emission factor (Kg/MJ) (IPCC, 2006),
EFi: Emission factor for i GHG (kg GHG/unit fuel combustion),
NHV: Net heat value of (MJ/unit fuel combustion).
Net heat value/NHV/of Kerosene=36 MJ/liter.
| Fuel source | GHG | GWP | EF in kg/TJ | EF in kg/MJ |
|---|---|---|---|---|
| Kerosene | CO2 | 1 | 71900 | 0.07 |
| CH4 | 25 | 3 | 0.000003 | |
| N2O | 298 | 0.6 | 0.0000006 |
Table 3: Emission factors of combustion for various fuels.
Typically, GHG reduced from kerosene contain CO2, CH4 and N2O and other gases. Those gases should be reported in units of carbon dioxide equivalent (CO2e). Gases are converted to CO2e by multiplying with their Global Warming Potential (GWP). To do so, multiply each emission gas by the corresponding GWP (Table 7) as following equation:
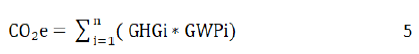
Where;
CO2e=Emissions in carbon dioxide equivalents (tons per year),
GHGi=Emissions of GHG saved “i”,
GWPi=Global warming potential of GHG,
n=Number of GHG emitted from the source.
Focus group discussion
Financial source for the construction of biogas plant was government and farmers with better economic positions but farmer with relatively low and medium income challenged by financial source to construct biogas plant. Thus, the acceptance of biogas technology was decrease because the limitation of financial source.
Data sources
The primary data was obtained from primary sources including household survey, focus group discussions, key informant interviews and field observation. A set of closed ended and open ended questionnaires were developed and administered to respondents. The secondary data sources were collected from available sources of information such as published and unpublished documents.
Data analysis
Data collected through interviews and field experiment were coded and entered into the Microsoft Excel. Data cleaning was done by running frequencies of individual variables and the clean data was exported to python 3.8.2 and Statistical Package for Social Sciences (SPSSv20).
The data were analyzed using descriptive statics and presented by tables, pie-charts and graphs. Logit regression model were employed to determined respondents’ demographic characteristics.
Demographic factor influencing and cause of low degree of biogas acceptance
The socioeconomic characteristics of the sample households were in the following tables and the result implies that the majority of the household can read and write as well as easily accept new information about biogas technology. Overall results showed that educated households accept biogas technology more than illiterate households. This result indicates that the gender and educational level of households influenced the biogas technology acceptance (Table 4).
| Categories | Respondents | |
|---|---|---|
| N | % | |
| Female | 3 | 2.3 |
| Male | 127 | 97.7 |
| Total | 130 | 100 |
| Illiterate | 31 | 23.8 |
| Primary school (1-8) | 59 | 45.4 |
| Secondory school (9-12) | 31 | 23.8 |
| Higher education | 9 | 6.9 |
| Total | 130 | 100 |
Table 4: Sex of respondents and their education level.
The survey also shows that the maximum and minimum ages of respondents are 66 and 25 years, respectively. The mean age was 45.5 years (Table 5). This shows that there is age gap among the respondents. However, the average age of respondents is in the productive age group; thus, the age of households was an incentive for enhancing biogas technology acceptance in the area of study. With regard to family size, the survey result showed that the mean family size of the respondents is 8.5; the maximum and the minimum family size are 15 and 2, respectively.
| Variables | N | Min. | Max. | Mean | Std. |
|---|---|---|---|---|---|
| Age of respondent | 130 | 25 | 66 | 45.5 | 25.99 |
| Family size | 130 | 2 | 15 | 8.5 | 9.2 |
| Farmland size | 130 | 0 | 3 | 1.5 | 2.1 |
| Total | 130 | 0 | 66 | 18.5 | 46.67 |
Table 5: Demographic characteristics that influence biogas technology acceptance.
All of the respondents have a land certificate and they feel secure in their possession. The survey results indicated that the maximum and minimum farmland held by respondents were 3 and 0 hectares, respectively. The overall average farmland of respondents was 1.5 hectares with a standard deviation of 2.1 (Table 5).
Empirical: The result of the probit model is summarized in the Table 6. To investigate the factors affect the sample households decision technology acceptance level, a total of 9 explanatory variables were selected and entered into the model.
| Variables | Description | Marginal effect | Coef. | Std. err. | P>z |
|---|---|---|---|---|---|
| Age | Age of household head in year | 0.003592 | 0.026795 | 0.029735 | 0.368 |
| Gender | Sex of household head | -0.00066 | -0.00489 | 1.081363 | 0.996 |
| Edu | Educational level of household head | 0.056083 | .4183949* | 0.236389 | 0.077 |
| FS | Family size | -0.04204 | -.3136288** | 0.128627 | 0.015 |
| NC | Number of cattle | 0.100947 | .7530881** | 0.316259 | 0.017 |
| FLS | Farm land size | -0.0168 | -0.12533 | 0.323673 | 0.699 |
| FWA | Fuel wood availability | -0.11076 | -.8262646* | 0.489859 | 0.092 |
| AWFD | Availability of water for domestic use | 0.068918 | 1.007738 | 1.417507 | 0.477 |
| TSA | Technical service availability | 0.701927 | 2.655713*** | 0.539146 | 0 |
| Cons | Constant | -2.80241 | 2.102628 | 0.183 | |
| Note: ***,** and * Significant at 1%, 5% and at 10% level; No. observation=130; Log likelihood=-20.010382; LR chi2 (9)=100.43; Prob>chi2=0.0001; Prob>chi2=0.0000; Pseudo R2=0.715 | |||||
Table 6: Estimation of the probit model output for analysis of low degree of biogas technology acceptance.
Interpretation of the regression result: An increase in the age of the household head increases the probability of the household decided to accept the technology. For the age of the household, heads increase by one year the probability to accept biogas technology increase by 0.35% (Table 6). This is perhaps because older household heads do have the resources (in terms of finances, farmland and cattle ownership) required to construct biogas plants since they have no financial constraints. The findings are consistence with those of who reported that the probability of accepting biogas technology increased with the increasing age of household heads? On the other hand as the education level of the household head increase, the probability of households accepting biogas technology increases by 5.6% (Table 6). This indicates that as the household’s education level increases the ability to obtain information, understand and consequently operation of biogas technology also increases. The findings of revealed that an increase in the education level can increase the degree of accepting biogas technology [13].
Results in this study revealed that the coefficient on biogas awareness was positively associated with biogas technology acceptance and highly significant at a 99% confidence interval (Table 6). The probit model also further indicated that keeping all other things the same, for those having awareness of the probability to accepting biogas technology. This result indicates that households who have an opportunity to attend awarenesscreation activities such as training, workshop, seminar and demonstration are more likely to accept technology like biogas than households who never attended such awareness-creation activities. This result was in line that who reported that awareness is just the first stage of the acceptance process, and it has to be followed by the accumulation of knowledge which in turn induces the perception of people on the technology. The result indicates that, if all other factors remain constant, the technical support service is the easy availability in their surround; more households can accept biogas technology. The result indicated that the households with access to technical support services were more likely to accept biogas technology than those without access to technical support services.
Analysis of the root cause of accepting or not accepting biogas technology
Reasons to accept biogas technology in the study area: As indicated in Figure 2, the effects of economic influence on the degree of acceptance of biogas plants. Accordingly, 18 (81.82%) and 2 (9.1%) were very high and high while the remain 2 (9.1%) of was medium. The mean score of the response was 4.40 (SD=7.67). The results indicated that the effects of economic benefit were at the range of moderate level. The bio-slurry from biogas digesters has been attested to be the best organic fertilizer which will lead to increased crop productivity by substituting chemical fertilizer. From this one understand that the economic benefit of household biogas motivated the degree of acceptance of biogas technology.
In Figure 2, respondents N17 (77.3%) and 3 (13.64%) the effects of governmental subsidy for biogas plants on the degree of biogas technology acceptance were very high and high respectively while the remaining 1 (4.55%) was medium. The mean score of the response was 4.4 (SD=7.13). This indicated that the effects of the governmental subsidy on the degree of acceptance of the biogas plant were at the range of medium level. In addition to this through interviews with biogas users, there were government subsiding systems to facilitate household biogas technology awareness creation. Postulated that subsidy was indicated to be important for respondents in taking a decision to accept biogas technology. This implied that household biogas technology was accelerated by government subsidy [14].

Figure 2: Reason to accept the biogas technology.
As shown in Figure 2, 2 (9.1%), 13 (59.1%) and 6 (27.3%) the effects of reducing health risk as stimulation of degree of biogas technology acceptance were very high, high and medium respectively. The mean score indicated that the motivator of the degree of biogas technology acceptance was at the range of moderate level. The use of biogas technology has numerous health benefits such as a reduction in smoke-borne diseases like headache, eye burning, eye infection, and respiratory organ infection and a reduction in burning accidents. This implied that the degree of acceptance of the biogas plant was attracted by its reduction of health risks.
As indicated in Figure 2, a fast and more convenient cooking biogas stove is the proxy for the degree of acceptance of biogas technology. In line with this request, 12 (54.55%), 8 (36.4%) and 2 (9.1%) were very high, high and medium respectively. The mean score of the responses was 4.40 (SD=5.37). This indicated that a fast and more convenient cooking stove as the alternative for the degree of acceptance of biogas technology was at the range of moderate level. It was also proven by interviews of accepters were the fastness and convenience of biogas cooking stoves was one of deriving factors to accept biogas technology. This pointed out that the degree of acceptance of biogas technology was accelerated by the fastness and convenience of the biogas cooking stove in the study area.
In Figure 2, 4 (18.2%), 7 (31.82%) ,7 (31.82%), 2 (9.1) and 2 (9.1) bright light of biogas as a motivator of the degree of biogas acceptance were very high, high, medium and low respectively while the rest 2 (9.1%) of them replied that bright light of biogas as a motivator of the degree of biogas acceptance was very low. The mean score of the responses was 4.40 (SD=2.51). This showed that bright light of the degree of biogas as a motivator of biogas acceptance at the interval of moderate level. The primary uses of biogas technology in developing countries are cooking and lighting, also pointed out that biogas is utilized both for cooking and lighting in Ethiopia. This implied that the bright light of biogas was encourage biogas users to accept the technology.
As can be seen from Figure 2, better quality bio-slurry for fertilizer is an initiator of the degree of biogas technology acceptance. Accordingly, 16 (72.7%), 4 (18.2%), 1 (4.55%) and 1 (4.55%) were very high, high, medium and low respectively. The mean score was 4.4 (SD=0.6.67). This indicated that better quality bio-slurry for fertilizer as the initiator of accepters of biogas technology was at the range of moderate level. The ammonia content of bio-slurry from biogas digester is about 10% higher than the fresh manure. From this, one can understand better quality bio-slurry for fertilizer as the initiator of accepters of biogas technology.
The respondents were asked to maximize saving time and reducing workload by encouraging biogas technology acceptance. Based on this request, 17 (77.3%), 4 (18.2%) and 1 (4.55%) were very high, high and medium respectively. The mean score was 4.40 (SD=7.23). This indicated that saving time and reducing workload as encouraging biogas accepters were at the range of medium level. The biogas acceptance saves time for social activities. This implied that saving time and reducing workload inspired accepters of the technology.
Reason to not accepting the biogas technology: Table 7 reasons for not accepting the biogas technology in Kersa district responses of frequency N (6) and 6%. This indicates that the district has a frequent response to the indication of biogas acceptance. This implied lack of awareness was a discouraging factor for the degree of biogas acceptance in the study area.
| Variables | Frequency | Percent |
|---|---|---|
| Lack of awarness | 6 | 6.0 |
| Small number of cattle | 51 | 51.0 |
| Lack of space or land size | 19 | 19.0 |
| Lack of adequate fund | 7 | 7.0 |
| Non-functionality of biogas technology | 17 | 17.0 |
| Total | 100 | 100.0 |
Table 7: Reason to not accept the biogas technology in the study area.
As can be seen in the table small number of cattle in the analysis of the cause of the low degree of biogas technology acceptance. Accordingly, responses of frequency N (51) and 51% indicated that the effects of responses of frequency N (51) and 51% were at the range of moderate level. Financial status is one of the most critical and frequently mentioned factors that determine the degree of acceptance of biogas technology. This implied that the acceptance of biogas technology in the study area was challenged by the lack of adequate funds [15].
In Table 7, N19 (19) %, the effects of lack of land size on the low degree of biogas technology acceptance was high in frequency and percent. The frequency score of the responses was N (19). This indicated that the effects of lack of land size were at the interval of discouraging level. This implies that the lack of land size in the study area highly discourages the analysis of a low degree of biogas acceptance.
As indicated in Table 7 the effects of biogas non-functionality on the analysis of the low degree of biogas technology acceptance. In line with this, frequency N (17), percentage 17(%). This point out that the effects of biogas non-functionality on the analysis of the low degree of biogas acceptance were at the range of high level. A satisfied user with the proper functioning of biogas installation can serve as the best advocate of the technology. Moreover, the information from the interview supplemented problems faced by their biogas accepters’ friends, especially nonfunctioning and poorly functioning biogas plant neighbors and relatives of the non-accepters respondents disturbed the potential biogas accepters’ interest. This implied that the level of biogas functionality determined the degree of acceptance in the study area.
Energy consumption: The primary energy source for domestic use in the study area is woody biomass in the form of fuel wood and charcoal. The result in Figure 3, indicates that, from the mean of all respondents, 143 non-biogas users head and 14.1 biogas users mainly use firewood, the mean of cow dung nonusers were 26.9 and 4.3 biogas users and followed by 14.8 of them non-biogas users and 7.1 biogas users mainly use charcoal as a source of energy for cooking. Finally, the finding showed that from the mean of all respondents, 7.5 and a standard deviation of 7.1 of biogas users heads contributed as a source of energy for cooking in the study area is used only by a small number of households (Table 8). This implies that the constant use of woody biomass as the main source of energy which has led to deforestation is high despite the existence of biogas development in the study area. In Ethiopia, almost all rural households depend on fuel wood as a major source of energy (Figure 3). Overall consumption of fuel wood, 14727 kg (83.21%), cow dung, 1749 kg 9 (9.88%) and charcoal 1221.9 (6.91) were measured in the study area respectively (Table 8).

Figure 3: Weekly fuel wood and charcoal consumption in the study area.
| Source of energy | Measurement in kg | Percent |
|---|---|---|
| Fuel wood | 14727 | 83.21 |
| Charcoal | 1221.9 | 6.91 |
| Cow dung | 1749 | 9.88 |
| Total | 17697 | 100 |
Table 8: Types of energy consumption in the study area.
Estimating greenhouse gas emission reduction
Estimating GHG emission reduction from woody biomass: The emission factors and fraction of nonrenewable woody biomass (both firewood and charcoal) were, 81.6% CO2/TJ and 88% respectively. Net calorific values for firewood and charcoal are different; that were 15.6 MJ/kg and 29.5 MJ/kg respectively. The average quantity of firewood and charcoal saved per year per households were 254,259 kg and 11,614.3 kg, respectively. The results of greenhouse gas emission, CO2e (carbon dioxide equivalent) reduced from woody biomass (firewood and charcoal) were calculated based on CDM methodology. GHG emission reduced from firewood and charcoal were ≈ 228.5 tCO2e/yr/hh and 24.6 tCO2e/yr/hh respectively [16].
The above results indicated that forty three biogas plants were saved about 228.5 tons of CO2e and 24.6 tons of CO2e in one year from fire wood and charcoal, respectively.
The result of the t-test also indicated that there was no significant difference between them. This implies that since the household size, the average frequency of end users per day and the annual income of both biogas users and biogas non-users selected for this study are similar which indicates the energy consumed for cooking and lighting for those households whether from biogas or from another energy source to be supposed the same for Roubík, et al. study (Table 9) [17].
| Variable | Categories | N | Mean | Std. | t-test | p |
|---|---|---|---|---|---|---|
| Ave. annual income | Biogas users | 15 | 30066.7 | 12009 | -0.13 | 0.9 |
| Charcoal users | 15 | 30533.3 | 7395.6 | |||
| Biogas users | 15 | 30066.67 | 12009 | 0.04 | 0.97 | |
| Firewood users | 15 | 29933.33 | 7525.8 | |||
| Note: ***indicate significant at 1% significant level | ||||||
Table 9: Annual income and household energy use.
The result in Table 10, shows that the average charcoal consumed/improved stove/week for biogas non-user is 7.65 kg with a standard deviation of 0.75 kg which was replaced by biogas in the household of biogas users. This indicates that the use of charcoal for cooking wat and coffee has totally been substituted by biogas in the household of biogas users. So, one biogas user can save about 7.65 kg of charcoal/week or 1.07 kg of charcoal/day in the study area. When it is translated to annual consumption, about 390.92 kg of charcoal/improved stove can be saved by one biogas plant. The result of this study is higher than the national level average charcoal consumption of 219 kg per annul that estimate the charcoal consumption per household was 219 kg/annum (0.6 kg/day). But the result of this study is less than the result which is 40 kg-80 kg of charcoal per month that the study conducted in Addis Ababa city. Since the total amount of biogas plants in the study area is 43 and if all are functioning, 16,809.3463 kg or 17.07 tone of charcoal for only cooking wot and coffee can be saved [18].
| Source of fossil fuel | Device | N | Mean | SD | t-test | P |
|---|---|---|---|---|---|---|
| Kerosene/week/hour | Biogas (Lamp) | 15 | 0 | 0 | -13.103*** | 0 |
| Kuraz | 15 | 0.57 | 0.17 | |||
| Wood/week/hour | Biogas | 15 | 0 | 0 | -25.269*** | 0 |
| TFS | 15 | 44.69 | 7 | |||
| Charcoal/week/hour | Biogas | 15 | 0 | 0 | -39.559*** | 0 |
| Improved stove | 15 | 7.65 | 0.75 | |||
| Note: ***indicate significant at 1% significant level | ||||||
Table 10: Source of energy consumed (kg) per week in different stoves in the study area from the field experiment.
Moreover, the results in Table 10, revealed that the average firewood consumed/per week/hour for cooking is 44.69 kg with a standard deviation of 7 by using three stone fire stove; which was replaced by biogas. On the other hand, one biogas for cooking can replace 6.38 kg of firewood per three-stone fire stove daily. This result is comparable to the result reported by Shrestha, et al. in Nepal where a biogas user can be reduced up to 6.13 kg of fuel wood per day [19]. Consequently, when this result converts to annual consumption, one biogas plant can save on average about 2328.4 kg of firewood in one year. This indicated that if all have functioned, 43 of the biogas plants in the study area can substitute 100,121.2 kg or 100.1224 tons of firewood for cooking.
Furthermore, the finding in Table 10, also shows that the average kerosene consumed/week/hour for lighting is 0.57 litter with a standard deviation of 0.17 which is immediately substituted by biogas plants. This finding only focused on households that use kerosene for lighting purposes by using Kuraz to estimate the amount of kerosene substituted by biogas. So that the annual average kerosene used for lighting by one household which is saved due to biogas technology is 29.72 liters. This implies that a total of 43 biogas plants in the study area can reduce 118.88 liters per year [20].
[Crossref] [Google Scholar] [PubMed]
Citation: Meskele TF, Ramayya VA, Nigussie A (2025) Greenhouse Gas Emission from Biogas Plants and Acceptance of the Low Degree of Biogas Technology in South West Ethiopia. J Fundm Renewable Energy Appl. 15:371.
Received: 13-Dec-2023, Manuscript No. JFRA-23-28456; Editor assigned: 15-Dec-2023, Pre QC No. JFRA-23-28456 (PQ); Reviewed: 29-Dec-2023, QC No. JFRA-23-28456; Revised: 09-Jan-2025, Manuscript No. JFRA-23-28456 (R); Published: 16-Jan-2025 , DOI: 10.35248/2090-4541.25.15.371
Copyright: © 2025 Meskele TF, et al. This is an open-access article distributed under the terms of the Creative Commons Attribution License, which permits unrestricted use, distribution, and reproduction in any medium, provided the original author and source are credited.