Cell & Developmental Biology
Open Access
ISSN: 2168-9296
ISSN: 2168-9296
Research Article - (2013) Volume 2, Issue 2
Background: The glycome has emerged as a key regulator of cell fate, partly through its ability to potentiate the action of numerous signaling pathways. We recently demonstrated that a sulfated component of the glycome plays a critical role in promoting the differentiation of embryonic stem cell (ESC)-derived embryoid bodies by modulating downstream growth factors, such as the insulin-like growth factor (IGF) signaling axis. However, the exact components of the glycome which promote ESC differentiation versus stemness remain uncharacterized, due to the lack of a rapid, simple and easily quantifiable methodology. As a proof-of-concept in this study, we utilized a custom-made glycoarray in combination with bioinformatics and molecular biology tools in order to uncover novel glyco-signatures underlying ESC differention in an embryoid body model. A better elucidation of the glycomic transcriptomal signature underlying ESC differentiation would allow us to better manipulate these cells towards a desired lineage.
Method: We used a custom-designed Affymetrix microarray, the Glycogene-chip, to screen the transcriptome of differentiating embryoid bodies versus that of undifferentiated ESC. In conjunction with gene ontology, pathway analyses, real-time PCR and immunoblotting, we validated the involvement of the IGF family, and furthermore, uncovered novel differentially regulated genes belonging to the glycoprotein (Angiopoietin-1 and Angiopoietin-like members), sulfotransferase, sulfatase and glycosyltransferase families.
Conclusion: These results suggest that the Glycogene-chip, in conjunction with the embryoid body model, provides a fast and reliable tool to uncover novel glycomic signatures that are critical to maitain ESC stemness versus differentiation. In turn, this will allow us to understand the mechanisms governing ESC fate, bringing us one step closer towards finding a new paradigm for the regenerative medicine field.
<Keywords: Embryonic stem cells, Differentiation, Glycome, Microarray, Angiopoietin
ABIN: A20 Binding Inhibitor of NF-kappaB; AN: Analyze Networks; ANGPT: Angiopoieitin; ANGPTL: Angiopoieitinlike; AP: Activator Protein; BRB: Biometric Research Branch; CBF: Core-Binding Factor; CFG: Consortium for Functional Glycomics; CHST: Carbohydrate-Specific Sulfotransferase; DCN: Decorin; ESC: Embryonic Stem Cells; EXTL: Exostoses (multiple)-like; FGF: Fibroblast Growth Factor; FKHR: Forkhead Transcription Factor; GO: Gene Ontology; GOBP: Gene Ontology Biological Process; IGF: Insulin-like Growth Factor; IGFBP: IGF-binding protein; ITGA: Integrin Alpha; GALNS: Galactosamine (N-acetyl)-6-sulfate Sulfatase; HS3ST: Heparan Sulfate (glucosamine) 3-O-sulfotransferase; LIF: Leukemia Inhibitory Factor; PDGF: Plated-Derived Growth Factor; LUM: Lumican; PECAM: Platelet Endothelial Cell Adhesion Molecule; SP: Specificity Protein; ST3GAL: Beta-galactoside alpha-2,3-sialyltransferase; STAT: Signal Transducer And Activator Of Transcription; TGF: Transforming Growth Factor; NDST: N-deacetylase/N-sulfotransferase; TIE: Tyrosine Kinase with Immunoglobulin-like and EGF-like Domains; SULF: Sulfatase.VCAM: Vascular Cell Adhesion Molecule
Within the past decade, glycomics has emerged as a key modulator of cellular function and homeostasis. As such, glycosylation of protein and lipids constitutes one of the most common posttranslational modifications in eukaryotes, resulting in modulation of key developmental functions, including innate immunity, signal transduction and cell differentiation [1,2]. These pleitropic effects of the glycome are mainly mediated by the presence of a wide range of glyco-enzymes and their respective isoforms, as well as by the fact that a single glyco-conjugate can simultaneously modulate the activity of numerous growth factors/receptor complexes due to the complexation of various factors onto one conjugate [3,4]. Glyco-conjugates are therefore more potent determinants of cell fate as opposed to the action of a single growth factor/receptor pair.
Despite these predominant roles of the glycome in governing cell fate, its underlying mechanisms of action remain largely uncharacterized, especially in the stem cell field. Effectively, the mechanisms which act as a switch between stem cell proliferation versus differentiation remain the subject of extensive studies, and harnessing these mechanisms would have immense potential in the field of regenerative medicine. Most studies thus far have focused on the roles of various growth factors to induce stem cell renewal or to promote their differentiation into selective lineages [5,6]. The few studies which have investigated glycome-related changes governing stem cell fate have used either lectin or antibody arrays which monitor specific glycoprotein-receptor interactions [7,8]. These studies have all encountered similar limitations, including false negatives and analyses artefacts (as many lectins have low affinity for their ligands and glyco-antibodies are scarce), growth factor/cytokine redundancy and irreproducibility.
We were one of the first groups to report that the glycome is a critical modulator of embryonic stem cell (ESC) fate [9]. Specifically, using an embryoid body model, we demonstrated that a sulfated subset of the glycome (the heparan sulfate glycosaminoglycans) directed ESC differentiation towards the mesodermal lineage, partly through modulation of the insulin-like growth factor (IGF) pathway [9,10]. Similarly, recent studies imply that the glycome is dynamically regulated during (embryonic or precursor) stem cell differentiation [11,12]. The exact players involved in ESC differentiation versus stemness, however, remain uncharacterized. A main reason for this lacuna remains the lack of a rapid, simple and easily quantifiable screening methodology to probe the ESC glycome.
In this study, we took advantage of a custom-designed oligonucleotide array developed and annotated by the Consortium for Functional Glycomics (CFG), which specifically probes for glycomic transcripts, in order to screen for the glyco-specific transcriptome underlying ESC differentiation [13-16]. As a proofof- concept, we employed a well-established embryoid body model of ESC differentiation, which recapitulates embryonic development in vivo, and compared its transcriptomal profile over time to that of undifferentiated ESC using bioinformatic analyses. We uncovered novel genes implicated in ESC differentiation versus stemness and validated these findings by real-time PCR and immunoblotting. Some of the genes of interest included glycoproteins, namely the Angiopoietin (ANGPT) and Angiopoietin-like (ANGPTL) families, as well as sulfotransferases, sulfatases and glycosyltransferases.
Materials
The RNeasy kit was obtained from Qiagen (Valencia, CA), whereas the iScript cDNA synthesis kit, iTaq SYBR Green Supermix and MyIQ PCR cycler were all from Bio-Rad Laboratories (Hercules, CA). All primers were obtained from Integrated DNA Technologies (Coralville, IA). Tie-2 receptor antibodies (sc-324, dilution 1:250) were purchased from Santa Cruz Biotechnology (Santa Cruz, CA).
Stem cell culture
A murine embryonic stem cell (ES) line derived from a 129 substrain (9TR#1) was purchased from ATCC (Rockville, MD). ES were maintained undifferentiated on gelatin-coated plates using a growth medium consisting of L-glutamine-containing DMEM, 0.1 mM non-essential amino acids, 0.1 mM sodium pyruvate, 0.1 mM 2-mercaptoethanol, all from Invitrogen (Carlsbad, CA), as well as 1000 U/ml LIF (Chemicon Inc., Temecula, CA) and 15% fetal bovine serum (HyClone, Logan, UT). Differentiation into embryoid bodies was induced by removing LIF from the medium and seeding the cells on ultra-low attachment 100mm dishes (Corning, Lowell, MA). Cells were imaged in real-time using bright field microscopy (Nikon Eclipse TE-2000 U).
RNA preparation and quality control
ES were differentiated on ultra-low attachment dishes to induce embryoid body formation. Quadruplet dishes were harvested for RNA extraction and the same samples subjected to real-time PCR and Glycogene-chip analyses. Undifferentiated ES were considered as Day 0 control. At indicated time-points, cells were harvested and total RNA extracted using the Qiagen RNeasy Mini Kit, following the manufacturer’s instructions. All samples were treated with DNAseI to prevent genomic DNA contamination. Quantification and purity of total RNA was assessed by A260/A280 absorption using a microvolume plate reader (Biotek, Winooski, VT). RNA quality was further investigated by the CFG core E facility using the Agilent Technologies 2100 Bioanalyzer using the RNA 6000 Nano LabChip (Santa Clara, CA) and was deemed to be excellent.
Glycogene-chip oligonucleotide array hybridization
GLYCOv4, referred to herein as Glycogene-chip, is a custom-made Affymetrix oligonucleotide array (Affymetrix, Santa Clara, CA) designed for the Consortium for Functional Glycomics (GFC) at the Scripps Research Institute (La Jolla, CA) [13]. Information is available online at: http://www.ncbi.nlm.nih.gov/geo/query/acc.cgi?acc=GPL11098. This array includes probes for~1246 murine probe-ids related to mouse glycome and developmental genes, where each gene is represented by 11 probe pairs. Unlike commercial oligonucleotide microarrays, it includes genes not currently represented, including glycosyltransferases, carbohydrate-binding proteins and proteoglycans. RNA (0.5 μg) from quadruplate samples was amplified using the Ambion Message Amp II Biotin Enhanced Single Round aRNA Amplification Kit (Agilent Technologies) and hybridized overnight to the GLYCOv4 array using a standard Affymetrix protocol, as previously described [17]. Glycogenechips were scanned using the Affymetrix GeneChip Scanner 3000 7G with default settings and a target intensity of 250 for scaling.
Glycogene-chip data analysis
The dendogram was generated by unsupervised hierarchical clustering using Biometric Research Branch (BRB) ArrayTools, as previously described [13]. Acquired probe level data was normalized using the RMA Express 1.0 with quantile normalization, median polish and background adjustment. Differential expression between transcripts was generated using the Limma package in the R software [18]. The fold changes and standard errors were estimated by fitting a linear model for each gene and empirical Bayes smoothing was applied to the standard errors. Results are presented as fold induction, and were calculated using the moderated t-statistic, the p-value, and the adjusted p-value, the latter being generated using the Benjamini and Hochberg’s method. The transcripts identified as differentially expressed were those with adjusted p-value<0.1 and fold change >1.4. These anaylsis were performed by the GFC. The Gene Ontology Biological Process (GOBP) terms were retrieved using the Bioconductor [19] packages ‘biomaRt’ and ‘GO.db’ and GeneGo Metacore (www.genego.com) biological pathway analysis tool [20].
Biological chart and pathway analyses
The Cytoscape (http://cytoscape.org/) plugin ClueGO [21] was used to generate functionally-grouped molecular function network charts (26.03.2012, cutoff of Q = 0.000 01 level of significance). Significance for enrichment and depletion of groups and terms was calculated by a two-sided hypergeometric test with a Bonferroni correction for multiple testing. The differentially expressed genes were subjected to biological pathway analysis from the GeneGo Metacore software (www.genego.com) using Analyze Networks (AN) algorithm with default settings [20]. Enrichment analysis was performed by mapping gene IDs of the dataset onto gene IDs in entities of built-in functional ontologies represented in MetaCore by pathway maps. Gene networks were then segregated into their respective cellular compartments. The gene content of the uploaded files is used as the input list for generation of biological networks using Analyze Networks (AN) algorithm with default settings. This is a variant of the shortest paths algorithm with main parameters of relative enrichment with the uploaded data, and relative saturation of networks with canonical pathways. These networks are built on the fly and are unique for the uploaded data. In this workflow the networks are prioritized based on the number of fragments of canonical pathways on the network.
Real-time PCR
RNA was extracted from cells using the RNeasy kit and reversetranscribed with the High-Capacity cDNA Reverse Transcription kit, according to the manufacturer’s instructions. The resulting cDNA was subjected to SYBR Green real-time PCR using primers designed to amplify ANGPT-1, ANGPTL-2, -4, -6, CHST-1, EXTL-1, GALNS, HS3ST-1, NANOG and SULF-1. GADPH was used as the endogenous control [22]. Primers were designed to span exon-exon boundaries using the Universal Probe Library Assay Design Center (Roche Applied Science) and. Normalized reporter (Rn) values were calculated using the threshold cycle value (CT) for each gene, as follows:
Rn=2 X-delatadelta CT, where deltadelta CT=average CTtarget-average CTexperimental control.
Results were expressed as mean ± SEM of quadruplate samples and repeated at least twice. Statisticalcomparisons were obtained using one-way ANOVA, followed by the New man-Keuls test. Probability (p) values less than 0.05 were considered significant.
Immunoblotting
Cells were washed twice with PBS and directly lysed in 3X loading buffer containing 12% sodium dodecyl sulfate, 15% 2-mercaptoethanol, 1 mM sodium orthovandate and protease inhibitor cocktail tablets from Roche Applied Science. Cells were further homogenized by passing the lysates 3 times through an insulin needle. Samples were then heated for 5 min at 100°C and equal amounts loaded onto tris-glycine SDSpolyacrylamide gels. Proteins were electrophoretically transferred onto polyvinylidene difluoride membranes, blocked for 1 h with 5% non-fat dry milk, and subsequently incubated overnight at 4°C with primary antibodies directed against phosphor-Tie-2 receptor. Proteins were detected using horseradish peroxidase-conjugated anti-rabbit secondary antibodies and Lumi-LightPLUS Western Blotting Substrate (Roche Applied Science). The blots were developed using GeneSnap and optical densities off the protein bands quantified using GeneTools (both from SynGene, Frederick, MD). Predetermined molecular weight standards were used as markers. Proteins were normalized against total Tie-2. Statistical comparisons of 3 immunoblots were obtained using one-way ANOVA, followed by the Newman-Keuls test. Probability (p) values less than 0.05 were considered significant.
A glycome-selective microarray shows specific clustering during ESC differentiation
We used a standard model of ESC differentiation into embryoid bodies, which spontaneously recapitulates the three stages of in vivo embryonic development, namely mesoderm, endoderm and ectoderm [9,23,24]. These cells were maintained in suspension for 5 to 15 days on ultra-low adherent wells and in the absence of leukemia inhibitory factor (LIF) (Figure 1A). In contrast, ESC maintained in the adherent state and in the presence of LIF, represented as Day 0, served as the undifferentiated control, before gastrulation has occurred. Cells maintained for 5 days differentiate into cystic, symmetrical embryoid bodies, representing the beginning of the gastrulation stage [9,24,25]. Day 7 represent the organogenesis stage, beginning with the development of the cardiovascular system, whereas Day 10 and therafter are characterized by a high proportion of endodermallyderived cell types and neurogenesis [9,24]. This model hence allows us to accurately monitor glycome-selective changes occurring during all stages of development.
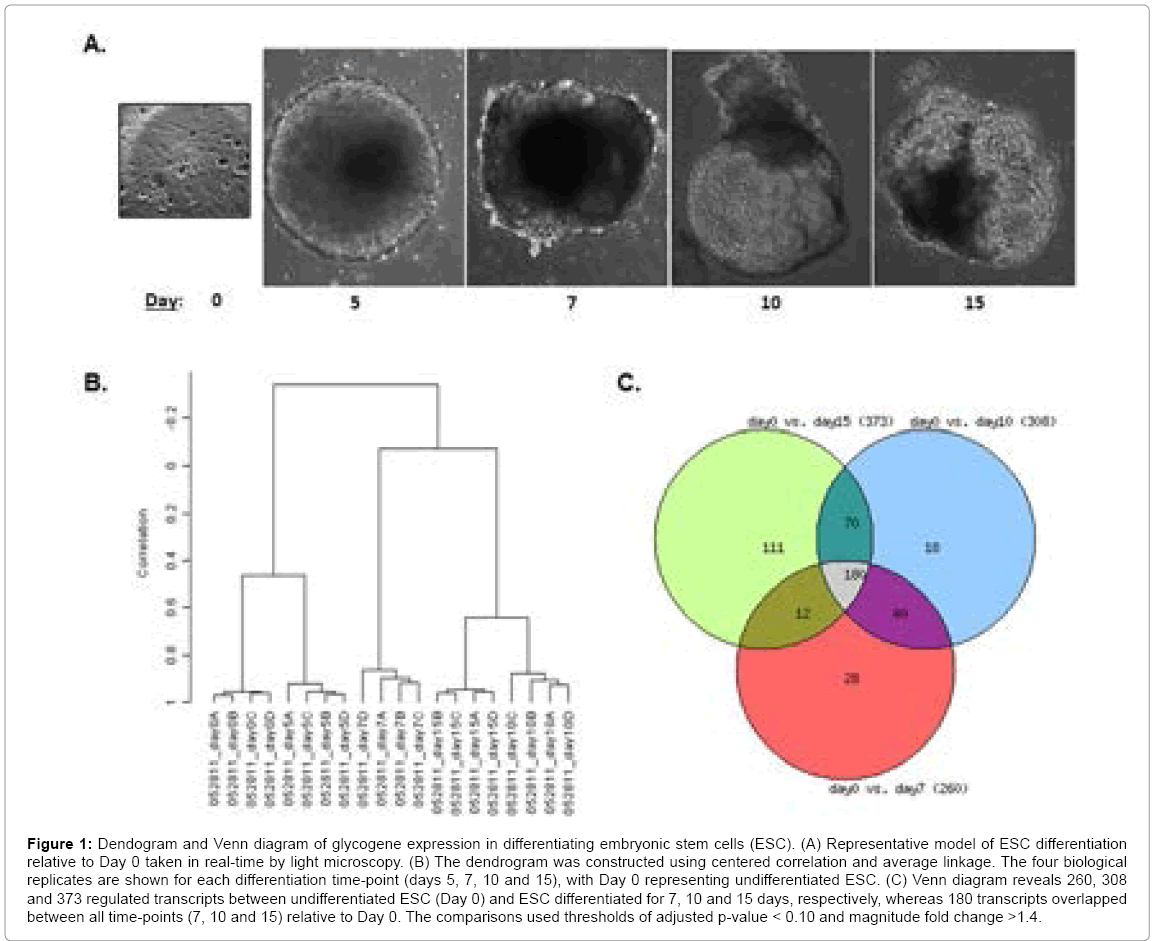
Figure 1: Dendogram and Venn diagram of glycogene expression in differentiating embryonic stem cells (ESC). (A) Representative model of ESC differentiation relative to Day 0 taken in real-time by light microscopy. (B) The dendrogram was constructed using centered correlation and average linkage. The four biological replicates are shown for each differentiation time-point (days 5, 7, 10 and 15), with Day 0 representing undifferentiated ESC. (C) Venn diagram reveals 260, 308 and 373 regulated transcripts between undifferentiated ESC (Day 0) and ESC differentiated for 7, 10 and 15 days, respectively, whereas 180 transcripts overlapped between all time-points (7, 10 and 15) relative to Day 0. The comparisons used thresholds of adjusted p-value < 0.10 and magnitude fold change >1.4.
RNA was extracted and labeled from these ESC, with each timepoint represented by quadruplate experimental groups. Following microarray hybridization, gene expression patterns were analyzed using unsupervised hierarchical cluster analysis in order to assess experimental reproducibility and uncover general clustering patterns. The resulting dendogram (Figure 1B) demonstrates excellent sample reproducibility among each quadruplates, as shown by the short branches between them, which was further corroborated by quality assessment parameters (results not shown). In addition, days 0 and 5 clustered close together, as did days 10 and 15. There was a clear separation between days 0 and 5 from the rest of the experimental time-points, reflecting clear differences in the glycogene expression profiles as the ESC differentiated, as expected from the embryoid body model [9,23,24].
A more detailed investigation of the differential glycomic profile during ESC differentiation was investigated using the Venn diagram, which allowed us to focus on two groups for subsequent analyses. Figure 1C shows that 180 overlapping transcripts changed significantly between all time-points (omitting Day 5), indicating developmentallyconserved roles of the glycome throughout differentiation. We focused on these 180 genes for the first investigation. The number of genes that were unique to distinct time-points, with respect to Day 0, were as follows: 111 genes for Day 15, 18 genes for Day 10, 28 genes for Day 7 and 5 genes for Day 5. Hence, the Day 15 time-point would allow us to uncover the most glycome-related changes underlying ESC differentiation. Since, based on the dendogram of Figure 1A, days 15 and 10 clustered close together, we decided to also focus on the subset of genes (70) overlapping in only these two time-points, for a total of 181 genes for the second investigation. Since there were the less differences between Day 5 versus Day 0 using this array, we did not use this time-point for subsequent analyses. This is not to imply a lack of transcriptomal changes between both time-points, but since we’re using a focused microarray that doesn’t include most of the genome, subtle differences might be masked, as indicated by the dendogram of Figure 1B.
ESC exhibit a distinct glycomic transcriptomal signature during differentiation
Firstly, we focused on the upregulated (top 75, Table 1) and downregulated (69, Table 2) genes, omitting housekeeping genes, which significantly overlapped between all time-points.Transcripts identified as differentially expressed were those with adjusted p-value<0.1 and fold change >1.4. Results were annotated using gene ontology (GO) biological processes with fold changes tabulated using Day 0 as the denominator.The complete results from the list of the 180 transcripts are available upon request.
| Down Regulated Genes | Biological Processes | Gen Bank ID | Day 7 vs Day 0 | Adj. P. Val | Day 10 vs Day 0 | Adj. P. Val | Day 15 vs Day 0 | Adj. P. Val |
|---|---|---|---|---|---|---|---|---|
| FGF4 | chondroblast differentiation | NM_010202 | 0.15 | 8.68E-20 | 0.07 | 4.34E-23 | 0.07 | 5.37E-23 |
| MANBA | glycoprotein catabolic process | NM_27288 | 0.18 | 6.65E-19 | 0.11 | 5.02E-21 | 0.15 | 1.21E-19 |
| PECAM1 | positive regulation of tyrosine phosporylation of Star5 protein | NM_001032378 | 0.18 | 4.07E-17 | 0.16 | 7.56E-18 | 0.23 | 2.61E-16 |
| LGALS6 | induction of programmed cell death | NM_010707 | 0.2 | 3.02E-16 | 0.1 | 1.84E-19 | 0.09 | 1.21E-19 |
| ICAM1 | response to sulfur dioxide | NM_010493 | 0.21 | 3.03E-19 | 0.16 | 1.33E-20 | 0.11 | 2.38E-22 |
| FGF18 | endochodral ossification | NM_008005 | 0.24 | 1.30E-15 | 0.29 | 1.24E-14 | 0.51 | 1.07E-09 |
| HBEGF | positive regulation of keratinocyte migration | NM_010415 | 0.29 | 2.53E-15 | 0.4 | 5.82E-13 | 0.41 | 6.17E-13 |
| ANGPTL4 | triglyceride homeostasis | NM_020581 | 0.32 | 3.04E-16 | 0.21 | 3.81E-19 | 0.24 | 1.89E-18 |
| BMP8 B | ossification | NM_007559 | 0.32 | 3.11E-15 | 0.29 | 5.72E-16 | 0.26 | 8.53E-17 |
| PDGF A | positive regulation of mesenchymal cell proliferation | NM_008808 | 0.33 | 2.38E-15 | 0.36 | 1.17E-14 | 0.27 | 6.30E-17 |
| MCAM | vascular wound healing | NM_023061 | 0.33 | 3.95E-16 | 0.41 | 1.26E-14 | 0.42 | 2.19E-14 |
| MANBA | glycoprotein catabolic process | uc008rlu | 0.34 | 1.56E-12 | 0.25 | 8.20E-15 | 0.23 | 2.23E-15 |
| RBPJ | positive regulation of transcription of Notch receptor target | NM_009035 | 0.39 | 4.66E-16 | 0.4 | 4.97E-16 | 0.39 | 2.23E-16 |
| PTCH2 | skin development | NM_008958 | 0.41 | 4.34E-12 | 0.35 | 1.53E-13 | 0.32 | 3.04E-14 |
| GLB1 | galactose catabolic process | uc009rxh | 0.41 | 1.03E-15 | 0.44 | 4.54E-15 | 0.45 | 4.03E-15 |
| GDF3 | somite rostral/caudal axis specification | NM_008108 | 0.42 | 1.56E-12 | 0.28 | 1.06E-15 | 0.26 | 1.54E-16 |
| LGALS3 | extracellular matrix organization | NM_010705 | 0.42 | 2.43E-10 | 0.26 | 3.32E-14 | 0.24 | 8.50E-15 |
| CSF1 | positive regulation of macrophage derived from cell differentiation | NM_007778 | 0.45 | 2.16E-14 | 0.44 | 1.02E-14 | 0.42 | 2.31E-15 |
| B3GNT7 | protein glycosylation | NM_145222 | 0.46 | 2.68E-09 | 0.26 | 4.52E-14 | 0.21 | 2.26E-15 |
| GCNT2 | metabolic process | NM_133219 | 0.46 | 9.37E-09 | 0.38 | 1.26E-10 | 0.61 | 5.88E-06 |
| PMM1 | mannose biosynthetic process | NM_013872 | 0.47 | 2.77E-13 | 0.25 | 2.47E-18 | 0.21 | 1.53E-19 |
| VEGFC | positive regulation of protein autophosphorylation | NM_009506 | 0.47 | 5.57E-15 | 0.67 | 6.69E-10 | 0.58 | 2.78E-12 |
| PMM1 | mannose biosynthetic process | uc007wxu | 0.47 | 2.52E-12 | 0.26 | 2.00E-17 | 0.2 | 6.45E-19 |
| B3GNT2 | sensory perception of smell | NM_016888 | 0.48 | 1.16E-10 | 0.36 | 1.77E-13 | 0.2 | 2.14E-15 |
| NGF | positive regulation of protein autophosphorylation | NM_013609 | 0.48 | 2.01E-11 | 0.48 | 1.63E-11 | 0.46 | 3.13E-12 |
| CAPN1 | protein autoprocessing | uc008ggk | 0.49 | 4.00E-09 | 0.49 | 2.92E-09 | 0.42 | 9.50E-11 |
| HSPG2 | nuclear-transcribed m-RNA catabolic process, nonsense mediated decay | uc008vjf | 0.5 | 6.51E-11 | 44 | 1.77E-12 | 0.4 | 1.40E-13 |
| CHST6 | keratan sulfate biosynthetic process | NM_019950 | 0.5 | 4.41E-10 | 0.48 | 9.39E-11 | 0.56 | 5.21E-09 |
| BMP8A | ossification | NM_007558 | 0.51 | 1.41E-11 | 0.41 | 3.83E-14 | 0.39 | 1.33E-14 |
| CSF1 | positive regulation of macrophage derived from cell differentiation | NM_007778 | 0.53 | 1.07E-11 | 0.54 | 1.51E-11 | 0.52 | 3.87E-12 |
| IL17B | neutrophil chemotaxis | NM_019508 | 0.53 | 6.83E-11 | 0.45 | 8.17E-13 | 0.42 | 1.53E-13 |
| CSF1 | positive regulation of macrophage derived from cell differentiation | uc008qxm | 0.53 | 1.82E-11 | 0.54 | 2.22E-11 | 0.57 | 1.05E-10 |
| SLC35B2 | positive regulation of I-kappaB kinase/NF-kappaB cascade | uc008cqw | 0.54 | 4.43E-12 | 0.43 | 7.30E-15 | 0.35 | 6.71E-17 |
| GDF3 | somite rostral/caudal axis specification | NM_008108 | 0.54 | 6.11E-12 | 0.4 | 1.80E-15 | 0.34 | 5.81E-17 |
| CAPN1 | protein autoprocessing | uc008ggj | 0.54 | 4.93E-10 | 0.47 | 7.47E-12 | 0.47 | 4.85E-12 |
| BMP4 | mesenchymal cell differentiation involved in renal system development | NM_007554 | 0.56 | 4.63E-09 | 0.54 | 1.30E-09 | 0.4 | 5.22E-13 |
| BDNF | negative regulation of neuroblast proliferation | NM_007540 | 0.56 | 1.84E-11 | 0.57 | 2.67E-11 | 0.6 | 1.37E-10 |
| GLB1 | galactose catabolic process | uc009rxj | 0.58 | 2.61E-10 | 0.54 | 1.49E-11 | 0.54 | 1.62E-11 |
| B3GALT4 | protein glycosylation | NM_019420 | 0.59 | 4.93E-10 | 0.54 | 1.93E-11 | 0.6 | 5.05E-10 |
| EXTL3 | positive regulation of cell growth | uc007uiy | 0.59 | 4.42E-09 | 0.5 | 1.87E-11 | 0.48 | 4.24E-12 |
| TPST2 | metabolic process | NM_009419 | 0.6 | 2.67E-10 | 0.5 | 1.09E-12 | 0.49 | 4.36E-13 |
| GFPT2 | glutamine metabolic process | NM_013529 | 0.6 | 8.06E-09 | 0.46 | 3.75E-12 | 0.17 | 3.22E-19 |
| NCSTN | membrane protein ectodomain proteolysis | NM_021607 | 0.6 | 4.46E-06 | 0.65 | 3.59E-05 | 0.66 | 5.28E-05 |
| SLC35E4 | transmembrane transport | NM_153142 | 0.61 | 3.79E-09 | 0.6 | 2.04E-09 | 0.59 | 1.03E-09 |
| IGFBP6 | regulation of cell growth | NM_008344 | 0.61 | 1.32E-08 | 0.7 | 2.42E-06 | 0.71 | 2.64E-06 |
| ACAN | collagen fibril organization | NM_007424 | 0.62 | 3.09E-08 | 0.45 | 1.93E-12 | 0.5 | 2.09E-11 |
| ASGR2 | regulation of protein stability | NM_007493 | 0.62 | 7.47E-07 | 0.54 | 6.83E-09 | 0.64 | 1.27E-06 |
| MUC3 | biological process | uc009abs | 0.62 | 1.99E-09 | 0.6 | 2.87E-10 | 0.61 | 7.19E-10 |
| CAPN1 | protein autoprocessing | NM_007600 | 0.63 | 1.31E-07 | 0.56 | 2.85E-09 | 0.56 | 2.83E-09 |
| ALG13 | lipid glycolysation | uc009umu | 0.63 | 1.21E-06 | 0.35 | 4.38E-13 | 0.21 | 1.21E-16 |
| CLEC 10A | defense response | NM_010796 | 0.63 | 2.06E-08 | 0.61 | 4.11E-09 | 0.55 | 1.04E-10 |
| EGFR | positive regulation of fibroblast proliferation | NM_207655 | 0.64 | 3.05E-06 | 0.48 | 7.84E-10 | 0.5 | 1.90E-09 |
| WNT4 | non-canonical Wnt receptor signaling pathway via MAPK cascade | NM_009523 | 0.64 | 1.35E-07 | 0.46 | 5.60E-12 | 0.6 | 9.70E-09 |
| GMPPB | biosynthetic process | NM_177910 | 0.65 | 2.85E-09 | 0.6 | 9.28E-11 | 0.67 | 5.12E-09 |
| GDF15 | peripheral nervous system development | uc009mmb | 0.65 | 5.10E-09 | 0.57 | 2.27E-11 | 0.58 | 4.47E-11 |
| CHST 10 | long term memory | NM_145142 | 0.65 | 9.75E-08 | 0.51 | 2.27E-11 | 0.63 | 1.44E-08 |
| GNPDA1 | fructose 6-phosphate metabolic process | NM_011937 | 0.66 | 1.22E-09 | 0.57 | 4.51E-12 | 0.52 | 1.32E-13 |
| DHH | Leydig cell differentiation | NM_007857 | 0.66 | 6.74E-06 | 0.61 | 4.18E-07 | 0.63 | 1.37E-06 |
| SULF2 | glial cell-derived neurotrophic factor receptor signalling pathway | NM_028072 | 0.66 | 1.10E-05 | 0.6 | 2.92E-07 | 0.55 | 2.01E-08 |
| FGF17 | fibroblast growth factor receptor signaling pathway | NM_008004 | 0.67 | 3.08E-06 | 0.39 | 7.09E-13 | 0.46 | 2.79E-11 |
| COG1 | protein transport | NM_013581 | 0.67 | 1.54E-08 | 0.61 | 3.23E-10 | 0.57 | 1.91E-11 |
| SLC35D1 | carboxylic acid metabolic process | NM_177732 | 0.67 | 9.30-E-08 | 0.63 | 5.70E-09 | 0.61 | 1.23E-09 |
| GCNT2 | metabolic process | uc007qen | 0.68 | 2.22E-08 | 0.62 | 2.88E-10 | 0.66 | 2.90E-09 |
| LGALS1 | positive regulation of erythrocyte aggregation | NM_008495 | 0.69 | 1.64E-06 | 0.67 | 4.24E-07 | 0.57 | 1.58E-09 |
| CHST12 | dermatan sulfate biosynthetic process | NM_021528 | 0.69 | 5.84E-08 | 0.57 | 1.64E-11 | 0.53 | 1.67E-12 |
| EXTL1 | metabolic process | NM_019578 | 0.7 | 8.88E-06 | 0.71 | 1.09E-06 | 0.64 | 3.07E-07 |
| DHH | Leydig cell differentiation | NM_007857 | 0.7 | 2.62E-06 | 0.69 | 1.13E-06 | 0.61 | 1.06E-08 |
| FGFR1 | middle ear morphogenesis | uc009lgc | 0.7 | 5.35E-03 | 0.71 | 5.56E-03 | 0.47 | 5.68E-07 |
| RFNJ | positive regulation of Notch signaling pathway | NM_009053 | 0.7 | 2.27E-06 | 0.65 | 8.94E-08 | 0.7 | 1.38E-06 |
| CHPF | biological process | NM_001001566 | 0.71 | 2.55E-07 | 0.7 | 8.78E-08 | 0.68 | 2.24E-08 |
Table 1: Genes that were upregulated between all time-points of differentiating ESC versus Day 0. The top 75 transcripts, excluding housekeeping genes, are shown.
| Down regulated genes | Biological process | Gen Bank Id | Day7 vs Day 0 | Adj.P.Val | Day 10 vs Day 0 | Adj.P.Val | Day 15 vs Day 0 | Adj.P.Val |
|---|---|---|---|---|---|---|---|---|
| FGF8 | mesodermal cell migration | NM_010205 | 42.3797232 | 1.01E-22 | 9.47508413 | 8.07E-19 | 5.11704525 | 2.54E-16 |
| FGF5 | signal transduction involved in regulation of gene expression | NM_010203 | 26.6249968 | 9.02E-20 | 11.68384194 | 1.97E-17 | 2.5661838 | 1.36E-09 |
| CXCR4 | positive regulation of oligodendrocyte differentiation | NM_009911 | 17.5585811 | 2.83E-21 | 10.6838942 | 6.47E-20 | 5.15100692 | 6.30E-17 |
| FST | hair follicle morphogenesis | NM_008046 | 10.9455272 | 4.07E-17 | 4.6532678 | 1.53E-13 | 10.1117561 | 3.87E-17 |
| GPC3 | Positive regulation of BMP signalling pathway | NM_016697 | 9.26652576 | 1.59E-20 | 14.8298182 | 1.34E-22 | 12.9466229 | 3.72E-22 |
| HAS2 | celluar response to platelet-derived growth factor stimulus | NM_008216 | 7.70356913 | 2.80E-21 | 17.3878086 | 2.59E-24 | 5.40990498 | 4.71E-20 |
| ST3GAL6 | cellular response to interleukin-6 | NM_018784 | 7.16222841 | 5.10E-16 | 4.82707743 | 3.02E-14 | 8.19634912 | 7.17E-17 |
| PDGFRA | regulation of mesenchyaml stem cell differentiation | NM_011058 | 6.15377193 | 3.87E-18 | 6.33145576 | 2.47E-18 | 20.8620143 | 8.22E-23 |
| FGF10 | positive regulation of urothelial cell proliferation | NM_008002 | 6.05568444 | 1.87E-18 | 3.48723842 | 2.25E-15 | 1.9503577 | 2.65E-10 |
| BMP2 | negative regulation of cardiac muscle cell differentiation | NM_007553 | 5.92915174 | 3.07E-16 | 9.3431268 | 2.47E-18 | 3.68169914 | 6.55E-14 |
| TGFBR3 | organ regenration | NM_011578 | 5.84703718 | 8.68E-20 | 7.42068439 | 4.09E-21 | 11.6946987 | 5.37E-23 |
| ST6GAL1 | protien glycosylation | NM_145933 | 5.67294357 | 1.63E-19 | 4.34391694 | 3.15E-18 | 3.37249486 | 8.53E-17 |
| WNT5A | positive regulation of interleukin-8 secretin | NM_009524 | 4.62657159 | 5.71E-16 | 5.21939383 | 1.14E-16 | 3.48696591 | 1.71E-14 |
| ATRNL1 | G-protien coupled receptor signaling pathway | NM_181415 | 4.37184806 | 5.20E-17 | 4.79796121 | 1.13E-17 | 4.7087415 | 1.01E-17 |
| SLC35D3 | carbohydrate transport | NM_029529 | 3.68726723 | 1.51E-13 | 3.39456334 | 4.01E-13 | 1.52523442 | 2.28E-05 |
| BMP5 | male genetalia development | NM_007555 | 3.45441937 | 4.42E-14 | 4.40143286 | 1.26E-15 | 2.90982973 | 4.49E-13 |
| SHH | positive regulation of mesenchymal cell proliferation involved in urete development | NM_009170 | 2.84535026 | 2.97E-12 | 10.2782095 | 3.96E-19 | 7.52383004 | 4.87E-18 |
| SULF1 | glial cell derived neurotrophic factor receptor signaling pathway | NM_172294 | 2.8328506 | 1.61E-15 | 2.55258764 | 1.13E-14 | 1.8043247 | 6.04E-11 |
| SMO | regulation of heart morphogenesis | NM_176996 | 2.70695189 | 2.48E-14 | 2.66693471 | 2.39E-13 | 2.16278874 | 1.90E-11 |
| CHST1 | keratin sulfate metabolic process | NM_023850 | 2.64294381 | 1.25E-10 | 2.91968655 | 1.51E-11 | 1.81412014 | 3.65E-07 |
| IGFBP4 | regulation of cell growth | NM_010517 | 2.59971141 | 2.04E-10 | 2.99138788 | 1.16E-11 | 5.92184608 | 6.04E-16 |
| FZD1 | canonical Wnt receptor signaling pathway involved in osteoblast differentiation | NM_021457 | 2.5929974 | 5.24E-11 | 4.22231948 | 1.47E-14 | 5.1629406 | 7.60E-16 |
| PGM1 | glucose metabolic process | NM_028132 | 2.54449087 | 4.62E-15 | 2.51157005 | 5.74E-15 | 3.82588695 | 2.40E-18 |
| SRGN | maintenance of protease location in mast cell secretory granule | NM_011157 | 2.5281043 | 8.02E-07 | 9.04627559 | 1.15E-13 | 28.6174127 | 2.33E-17 |
| IGFBP5 | negative regulation of smooth muscle cell migration | NM_010518 | 2.52039135 | 1.33E-11 | 54.1924939 | 4.16E-24 | 49.0119677 | 1.49E-23 |
| COLEC12 | phagocytosis,recognition | NM_130449 | 2.50644878 | 1.07E-09 | 2.36517962 | 2.51E-09 | 1.76648989 | 1.85E-06 |
| ACVR2B | embryonicforegut morphogenesis | NM_007397 | 2.49946961 | 1.76E-12 | 2.22216356 | 1.82E-11 | 1.61950818 | 1.12E-07 |
| IL18 | positive regulation of superoxide anion generation | NM_008360 | 2.49609567 | 5.57E-13 | 2.01655918 | 6.05E-11 | 1.75678725 | 2.73E-09 |
| GAL3ST4 | biosynthetic process | NM_001033416 | 2.45265361 | 1.64E-11 | 2.78469868 | 9.79E-13 | 1.81364832 | 1.61E-08 |
| CXCL12 | organ regenration | NM_001012477 | 2.43638733 | 8.05E-14 | 2.3819499 | 6.16E-14 | 4.09876499 | 5.69E-18 |
| GPC1 | heparan sulfate proteoglycan catabolic process | NM_016696 | 2.41965101 | 8.35E-13 | 2.43278235 | 5.58E-13 | 1.88156515 | 2.85E-10 |
| GPC6 | hepran sulfate proteoglycan binding | NM_011821 | 2.37226306 | 5.03E-11 | 3.73767083 | 1.18E-14 | 6.05270893 | 1.96E-17 |
| HES1 | negative regulation ofpro-B cell differentiation | NM_008235 | 2.33630154 | 1.61E-15 | 1.7039937 | 1.08E-11 | 1.64633452 | 2.96E-11 |
| IGF1R | negative regulation of protein kinase B signaling cascade | NM_010513 | 2.32788291 | 2.37E-12 | 2.4505507 | 5.72E-13 | 2.64244098 | 9.13E-14 |
| IGFBP4 | regulation of cell growth | NM_010517 | 2.30803166 | 1.75E-09 | 2.49452869 | 2.43E-10 | 4.65968047 | 8.50E-15 |
| HSPC159 | biological process | NM_173752 | 2.28643633 | 2.50E-14 | 1.77978842 | 1.96E-11 | 1.51118941 | 6.90E-09 |
| PAPSS1 | 3'-phosphoadenosine5'-phosphosulfate biosynthetic process | NM_011863 | 2.22345505 | 7.55E-12 | 3.00822711 | 1.20E-14 | 3.15825684 | 3.43E-15 |
| GALNT12 | carbohydrate metabolic process | NM_172693 | 2.2185426 | 3.07E-14 | 1.43576461 | 5.31E-08 | 1.56253689 | 1.13E-09 |
| VEGFA | positive regulation of mesenchymal cell proliferation | NM_001025257 | 2.17808801 | 2.34E-08 | 4.54797309 | 8.33E-14 | 6.94702111 | 4.27E-16 |
| NAGLU | middle ear morphogenesis | NM_013792 | 2.16817882 | 1.72E-12 | 3.3499713 | 2.65E-16 | 4.71733471 | 1.44E-18 |
| PIGP | GPI anchor biosynthetic process | NM_019543 | 2.16685822 | 7.38E-14 | 2.20224463 | 3.69E-14 | 2.39139967 | 3.53E-15 |
| FZD2 | hard palate development | NM_020510 | 2.15852417 | 1.69E-14 | 3.68226121 | 4.69E-17 | 3.26765798 | 1.85E-16 |
| GALNT10 | protien O-linked glycosylaton | NM_134189 | 2.1458266 | 8.17E-14 | 2.62941978 | 7.23E-14 | 2.18241959 | 3.27E-12 |
| PIGP | GPI anchor biosynthetic process | uc008aak | 2.1176694 | 4.20E-14 | 2.23027137 | 8.59E-14 | 2.41404614 | 9.41E-15 |
| SLC35F1 | transport | NM_178675 | 2.09359733 | 3.71E-09 | 2.90190844 | 3.07E-12 | 5.36672409 | 2.88E-16 |
| PGM2L1 | glucose metabolic process | NM_027629 | 2.07386145 | 7.84E-10 | 1.70134356 | 1.38E-07 | 1.42281342 | 4.37E-05 |
| ARSA | binding of sperm to zona pellucida | NM_009713 | 2.04579877 | 5.44E-14 | 2.11042784 | 1.72E-13 | 1.88241796 | 3.19E-12 |
| IGF2BP3 | regulation of translation | NM_023670 | 2.03385031 | 7.89E-14 | 2.16576281 | 1.18E-14 | 1.75224985 | 4.19E-12 |
| EXTL2 | UDP-N-acetylgalactosamine metabolic process | NM_021388 | 2.02661107 | 5.57E-13 | 2.04072741 | 3.40E-13 | 1.92157761 | 1.39E-12 |
| WNT11 | adrenal gland development | NM_009519 | 1.99786452 | 7.49E-13 | 1.71547546 | 6.00E-11 | 2.70778888 | 2.92E-16 |
| FUT11 | protein glycosylation | NM_028428 | 1.99477254 | 1.94E-11 | 1.94396838 | 2.86E-11 | 1.73087405 | 8.54E-10 |
| FZD7 | substrate adhesion-dependent cell spreading | NM_008057 | 1.97598534 | 2.60E-12 | 1.87371495 | 9.43E-12 | 1.4459561 | 9.89E-08 |
| BMP7 | positive regulation of hyaluranone cable assembly | NM_007557 | 1.92125066 | 3.12E-12 | 2.01653612 | 6.05E-13 | 1.66673125 | 2.03E-10 |
| LARGE | muscle cell homeostasis | NM_010687 | 1.91184823 | 2.29E-11 | 2.95378278 | 1.07E-15 | 2.13292577 | 6.51E-13 |
| ACVR1 | pharyngeal system development | NM_007394 | 1.89679598 | 1.31E-08 | 2.27486114 | 1.07E-10 | 2.89562597 | 6.23E-13 |
| IGF2 | insulin receptor signaling pathway via phosphatidylinositol3-kinase cascade | NM_010514 | 1.88169069 | 1.45E-13 | 6.1570209 | 8.38E-23 | 7.57795059 | 1.76E-23 |
| GALNAC4S-6ST | hexose biosynthetic process | NM_029935 | 1.84870816 | 3.03E-11 | 2.01067722 | 1.99E-12 | 2.51071277 | 6.78E-15 |
| B4GALNT2 | lipid glycosylation | NM_008081 | 1.78603641 | 4.04E-05 | 8.15820522 | 8.20E-15 | 23.0281618 | 2.25E-18 |
| FZD8 | positive regulation of JUN kinsae activity | NM_008058 | 1.77135361 | 8.82E-10 | 1.58880657 | 2.69E-08 | 1.64734018 | 5.78E-09 |
| CHST2 | N_acetylglucosamine metabolic process | NM_018763 | 1.73501904 | 3.47E-09 | 2.31786732 | 9.79E-13 | 4.08678333 | 3.29E-17 |
| GPC2 | neuron differentiation | NM_172412 | 1.71524689 | 4.26E-07 | 2.81062501 | 3.16E-12 | 2.97005519 | 8.86E-13 |
| IGF2BP2 | regulation of translation | NM_183029 | 1.70770941 | 4.09E-11 | 2.16833289 | 2.70E-14 | 2.15663684 | 2.18E-14 |
| MAN2A2 | mannose metabolic process | uc009iap | 1.69900046 | 4.95E-09 | 2.06481819 | 1.21E-11 | 2.2423753 | 1.13E-12 |
| GFRA2 | nervous system development | NM_008115 | 1.68601544 | 2.05E-09 | 2.02091689 | 5.92E-12 | 1.4536158 | 3.43E-07 |
| MDK | adrenal gland development | NM_010784 | 1.66964049 | 1.71E-10 | 2.06917008 | 1.63E-13 | 2.30332421 | 7.95E-15 |
| ST8SIA4 | ganglioside biosynthetic process | NM_009183 | 1.66846652 | 1.34E-07 | 2.80887175 | 3.01E-13 | 2.80100684 | 2.46E-13 |
| FREM1 | cell-matrixadhesion | NM_177863 | 1.66772539 | 1.44E-07 | 3.00801501 | 9.55E-14 | 4.51578012 | 1.38E-16 |
| LMAN2L | protien transport | NM_001013374 | 1.65871958 | 3.15E-09 | 1.628116 | 4.41E-09 | 1.45645991 | 2.83E-07 |
| ANGPTL2 | signal transduction | NM_011923 | 1.64084049 | 2.31E-08 | 3.36741256 | 1.07E-15 | 3.62870614 | 1.76E-16 |
| HES6 | regulation of transcription from RNA polymerase II promoter | NM_019479 | 1.62914358 | 3.14E-08 | 1.55759132 | 1.26E-07 | 1.74304583 | 2.13E-09 |
| POFUT1 | fucosylation | NM_080463 | 1.62050504 | 1.05E-08 | 1.70715909 | 1.30E-09 | 1.76536807 | 3.63E-10 |
| NAGA | glycolipid catabolic process | NM_008669 | 1.61677676 | 1.64E-09 | 1.9635424 | 2.06E-12 | 2.95211972 | 1.43E-16 |
| FUT8 | integrin-mediated signaling pathway | NM_016893 | 1.58474009 | 4.42E-08 | 2.21375951 | 1.71E-12 | 3.60985965 | 1.04E-16 |
| NEU1 | metabolic process | NM_010893 | 1.57773264 | 9.13E-09 | 2.67651596 | 3.94E-15 | 3.26914925 | 6.71E-17 |
| HES6 | regulation of transcription from RNA polymerase II promoter | NM_019479 | 1.55229634 | 7.83E-07 | 1.47541392 | 3.93E-06 | 1.53019762 | 8.60E-07 |
Table 2: Genes that were downregulated between all time-points of differentiating ESC versus Day 0. The top 75 transcripts, excluding housekeeping genes, are shown.
In order to correlate the expression profiles occurring during ESC differentiation into biologically-relevant data, we visualized the GO molecular function related to the 180 overlapping transcripts using ClueGO in Cytoscape (Figure 2). Figure 2A shows the resulting annotation network showing significantGO groups that were upregulated between all time-points, as depicted by 5 major functional themes: (1) growth factor binding; (2) transferase activity-transferring glycosyl groups; (3) carbohydrate binding; (4) receptor binding and (5) growth factor activity. Transcripts identified as differentially expressed were those with adjusted p-value<0.1 and fold change >1.4. Top regulated transcripts (with fold changes >10 across at least one timepoint) included members of the fibroblast growth factor (FGF), platedderived growth factor (PDGF) and transforming growth factor families (TGF) families (Table 1).These transcripts have already been shown to play integral roles in promoting ESC differentiation [24,26,27]. As such, the top regulated transcript, FGF-8, has been implicated in priming mouse ESC towards neurogenesis [28]. Interestingly, several members of the insulin-like growth factor family (IGF) were highly upregulated in differentiating embryoid bodies, a finding previously demonstrated by our group [9,10]. These findings validate the accuracy of combining the Glycogene-chip and embryoid body models and justify their uses in this study. Although the Glycogene-chip focuses on glycomic genes, it also includes a large set of growth/developmental-related transcripts which serve as internal controls, thus explaining the high proportion of regulated growth factor/receptor genes herein obtained. In the realm of using the Glycogene-chip to uncover novel roles of the glycome during ESC differentiation, we focused on several glyco-modifying transcripts that were upregulated to a lesser extent, including sulfatases (SULFs), sulfotransferases (CHST-1 and -2) and the glycoprotein ANGPTL-2.
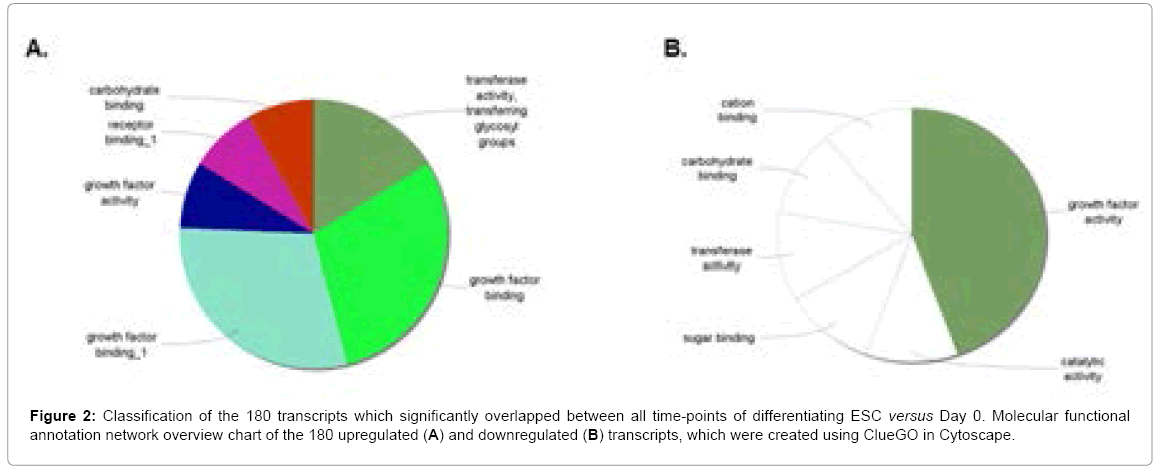
Figure 2: Classification of the 180 transcripts which significantly overlapped between all time-points of differentiating ESC versus Day 0. Molecular functional annotation network overview chart of the 180 upregulated (A) and downregulated (B) transcripts, which were created using ClueGO in Cytoscape.
The main GO theme that was downregulated was growth factor activity, with the top regulated transcript being fibroblast growth factor-4 (FGF-4, 14.29-fold) (Figure 2B and Table 2). FGF-4 expression was recently shown to positively correlate with the stemness transcription factor Nanog (Figure 3C) [29]. In addition, 5 themes that were not grouped involved catalytic activity, sugar binding, transferase activity, as well as carbohydrate and carbon binding. Altogether, these results indicate that a precise fine-tuning of growth factors is necessary to modulate ESC fate. Table 2 shows the downregulated overlapping transcripts. Besides FGF-4, main downregulated genes included members of the platelet endothelial cell adhesion molecule (PECAM) family, with up to 6.25-fold reduction at Day 10. It’s also interesting that carbohydrate-specific sulfotransferase (CHST) family members (CHST-6, -10 and 12) were downregulated. Along with Table 1, this indicates that the latter family is strongly implicated in all facets of ESC differentiation, and demonstrates the pleitropic functions imparted by various glyco-isoforms.
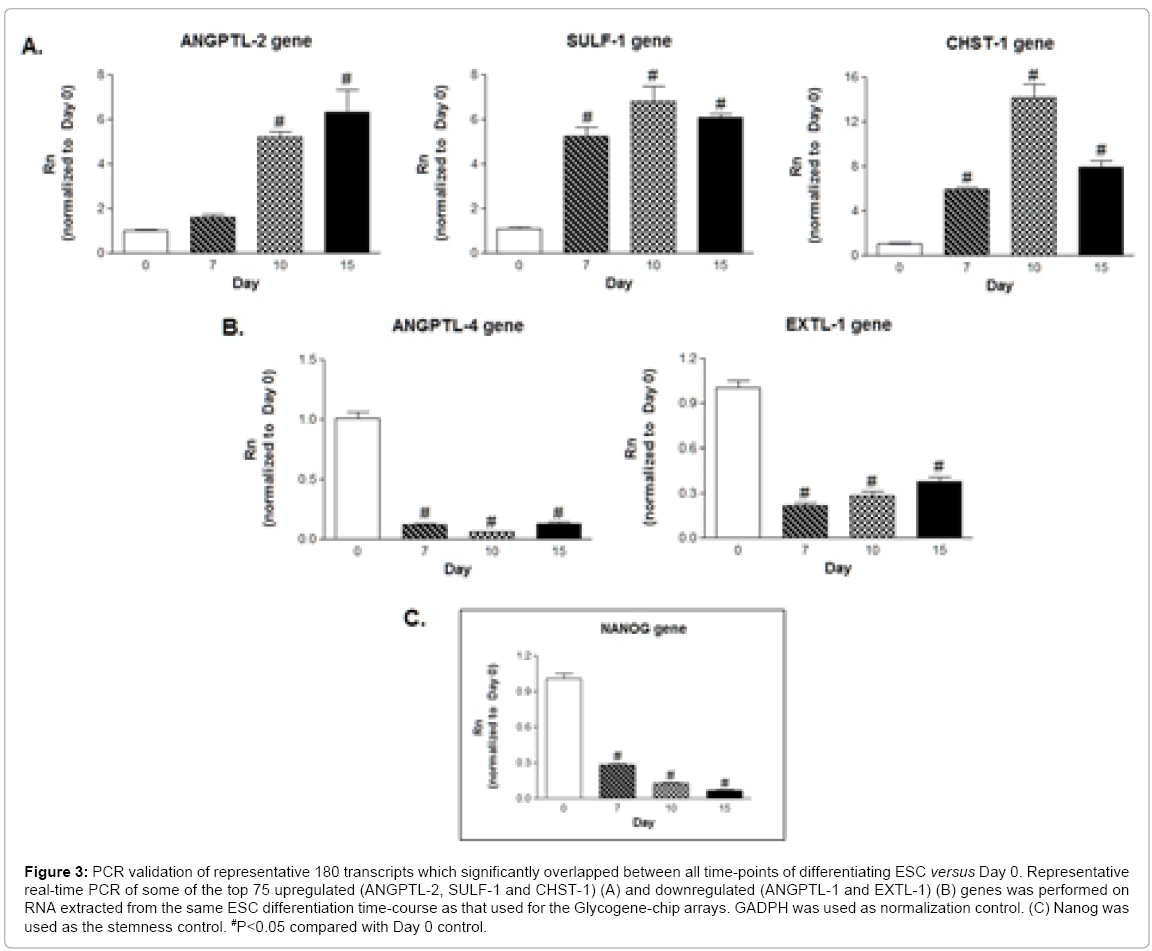
Figure 3: PCR validation of representative 180 transcripts which significantly overlapped between all time-points of differentiating ESC versus Day 0. Representative real-time PCR of some of the top 75 upregulated (ANGPTL-2, SULF-1 and CHST-1) (A) and downregulated (ANGPTL-1 and EXTL-1) (B) genes was performed on RNA extracted from the same ESC differentiation time-course as that used for the Glycogene-chip arrays. GADPH was used as normalization control. (C) Nanog was used as the stemness control. #P<0.05 compared with Day 0 control.
To validate some of the microarray results, 5 genes of interest were analyzed by real-time PCR, using the primer sequences depicted in Table 3. As such, we found that members of the Angiopoietin-like (ANGPTL) family, ANGPTL-2 and 4, were significantly regulated (Figure 3). ANGPTLs comprise a family of glycosylated cytokines (ANGPTL-1 to -6) whose mechanisms of action and functions remain largely uncharacterized [30]. They are mainly located at sites of energy metabolism (liver and adipose tissues), vascular remodeling (uterus and ovaries) and inflammation. Although their roles in ESC per say remain largely unknown, a secondary role has recently emerged for ANGPTL-2 in promoting hematopoietic stem cell expansion [31,32]. PCR validation (Figure 3A) shows that ANGPTL-2 was upregulated by 5.2-fold at Day 10, persisting by Day 15 (6.3 fold). In stark contrast, ANGPTL-4 expression was downregulated immediately following differentiation, to almost null levels (Figure 3B). To our knowledge, this is the first report linking ANGPTL-4 and stem cells. Based on ANGPTL-4’s proposed role as an angiogenic inhibitor, it’s tempting to speculate that the balance between ANGPTL-2 and -4 might act as a switch to mediate stemness versus mesodermal differentiation [33]. Furthermore, recent studies have implicated a synergistic effect of the ANGPTL and IGF axes in promoting hematopoietic stem cell explansion [34]. In order to uncover more novel glycogenes underlying ESC differentiation, we next focused on transcripts regulated to a lesser extent, but still having highly significant adjusted p values . We subjected the same ESC used for Glycogene-chip hybridization to PCR analysis, in order to eliminate any cell variability artefacts. As such, we found that the sulfatase, SULF-1, and the sulfotransferase, CHST-1, were highly upregulated as ESC differentiated, saturating at Day 10, whereas the glycosyltransferase exostoses (multiple)-like-1 (EXTL-1) was significantly downregulated (Figure 3A and 3B). Although the context of these transcripts in mediating ESC fate is unknown, studies using precursor stem cells have implicated a role for SULF-1 as a regulator of neural and hematopoietic differentiation [35,36]. Whereas there are no reports of CHST-1 expression in stem cells, in adult tissues, it is mainly expressed in neural and inflammatory tissues, where it modulates endothelium inflammation thourgh glycosaminoglycan biosynthesis [37]. As for EXTL-1, a promoter of heparin sulfate chain elongation, it’s preponderant role is as a tumor suppressor, which might explain its downregulation as ESC mature from the proliferating to the differentiating stage [38]. In order to confirm the stemness versus differentiation profile of our samples, we also subjected them to PCR analysis against the stemness marker, NANOG. As expected, NANOG transcripts decreased proportionally with time, achieving more than 70% downregulation at Day 7 and almost null expression after 10 and 15 days (87 and 93% decrease, respectively, Figure 3C).
| Gene | Forward Primer | Reverse Primer |
|---|---|---|
| ANG-1 | CGGATTTCTCTTCCCAGAAAC | TCCGACTTCATATTTTCCACAA |
| ANGPLT-2 | CACCGTGAGGCATGTGAA | GGTTGGTCTTTATGAACTGAAAGC |
| ANGPLT-4 | GGGACCTTAACTGTGCCAAG | GAATGGCTACAGGTACCAAACC |
| ANGPLT-6 | ATCTTCTCTGCTGCCCACA | CGTGAGCCTCTGCACAATC |
| CHST-1 | CCATCACAGGACCAGTTGAA | GCCTTCCAAGAACATTGCAT |
| EXTL-1 | CAGGAGGTGGCAGGTTCTC | GCAGCTTCTCACTGTTCCAGA |
| GALNS | CTCCTGGGAGGAGTTCACAC | TGTAACTCCTGAGACGTTCTGC |
| HS3ST-1 | AGTGTGAATTTGCTCCAAAGG | GTATCTCCAGTTGCCAATTACTGA |
| NANOG | TTCTTGCTTACAAGGGTCTGC | AGAGGAAGGGCGAGGAGA |
| SULF-1 | AAGAGTCACCTTCACCCCTTC | GCTH+GAAGTTTGCTATCCACCTC |
| SDC-4 | CCCTTCCCTGAAGTGATTGA | AGTTCCTTGGGCTCTGAGG |
| GADPH | CCCCAATGTGTCCGTCGTG | GCCTGCTTCACCACCTTCT |
Table 3: PCR primers used for real-time PCR experiments. GADPH represents the normalization gene. Nanog represents the stemness internal control gene.
A more detailed mechanistic analysis using the GeneGo Metacore software allowed us to identify possible biological networks modulated by these differentially expressed genes during all stages of ESC differentiation. The data was segregated into cellular compartments for added clarity.This type of analysis provides insight into physical connectivity and functional correlations between proteins. Although it would be interesting to validate these potential correlations in the future, it is not the scope of this study, but rather demonstrates that our methodology can be quickly analyzed in order to uncover not only potential glycome-related ESC signatures, but also underlying signaling mechanisms of action.
A top scoring network, using the transcripts from Table 1, revealed genes implicated in 5 main processes: (1) response to wounding (56.0%); (2) response to stress (72.0%); (3) nervous system development (60.0%); (4) neurogenesis (52.0%) and (5) generation of neurons (50.0%) (Figure 4A). Highly connected nodes of interest included ANGPTL-2 and the transcription factor signal transducer and activator of transcription-3 (STAT-3), as well as and IGF-binding protein-2 (IGFBP-2, represented as IBP2 in the pathway) and the membrane glycoprotein integrin alpha-5 (ITGA-5). Altough there is no documented record linking ANGPTL-2 and STAT-3, STAT-3 activation has been implicated in promoting neurogenesis [39], whereas the IGF-2/IBP-2/ITGA-5 axis promotes osteogenesis [40].The CHST sulotransferase family was found to be regulated in the cytoplasm, altough its exact underlying mechanisms remain unclear, transcriptional activation downstream of the core-binding factor-1 (CBF-1) has been proposed to mediate neurogenesis [41].
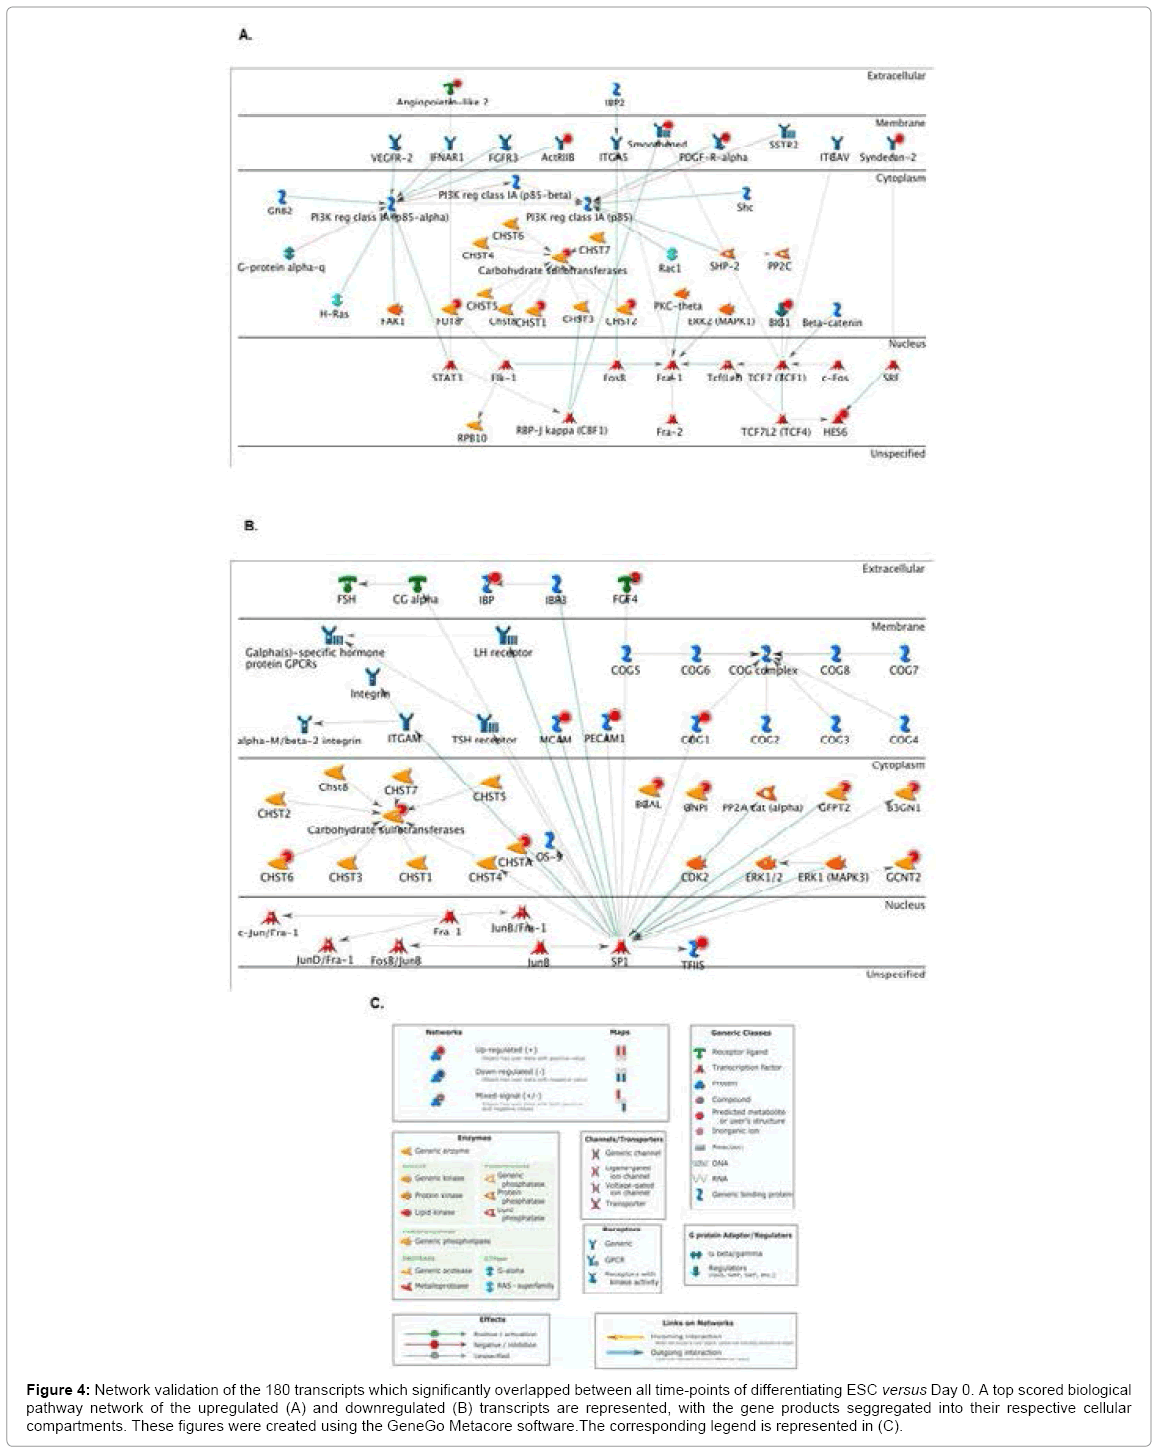
Figure 4: Network validation of the 180 transcripts which significantly overlapped between all time-points of differentiating ESC versus Day 0. A top scored biological pathway network of the upregulated (A) and downregulated (B) transcripts are represented, with the gene products seggregated into their respective cellular compartments. These figures were created using the GeneGo Metacore software.The corresponding legend is represented in (C).
A top scoring network, using the transcripts from Table 2, revealed genes implicated in 5 main processes: (1) carbohydrate metabolic process (40.0%); (2) N-acetylglucosamine metabolic process (16.0%); (3) glucosamine metabolic process (16.0%); (4) amino sugar metabolic process (16.0%) and (5) positive regulation of transcription during mitosis (12.0%) (Figure 4B). Highly connected nodes included FGF- 4, PECAM and the CHST family, all with the transcription factor specificity protein-1 (SP-1). Altough the link with CHST has not yet been demonstrated, transcriptional activation of FGF-4 or PECAM downstream of SP-1 has been shown to promote stemness [42] and vasculogenesis [43], repspectively.
Likewise, we performed similar analyses on the 181 genes which were upregulated after 15 days (inclusive of Day 10) of ESC differentiation, in order to uncover glycogenes implicated in the late differentiation stage. We focused on a lower scoring network in order to focus on non-developmentally conserved genes. In addition, the Venn diagram from Figure 1C indicated that this time-point has the largest number of differentially regulated transcripts, thus allowing us to unmask additional glycome-related signatures in differentiating ESC.
The underlying gene ontology analysis revealed 5 significantly grouped functional themes: (1) transferase activity; (2) transferase activity-transfering glycosyl groups; (3) cytokine binding; (4) receptor binding and (5) nucleic acid binding (Figure 5). As in the previous section, the IGF family was highly represented, with the most highly upregulated transcript being IGFBP-1 (191.80-fold, Table 4), underscoring the crucial role of this pathway in mediating all aspects of ESC fate. Interestingly, IGFBP-1 has been implicated in promoting liver regeneration [44]. The second and third most upregulated transcripts were proteoglycan family members, namely lumican (LUM, 45.43-fold) and decorin (DCN, 33.76-fold), which are both involved in promoting neurogenesis [45] and osteogenesis [46]. Investigating genes upregulated at this later differentiation time-point effectively allowed us to unmask novel glycogenes more readily than in the previous section. As such, top 10 regulated transcripts at Day 15 included heparan sulfate 3-O sulfotransferase HS3ST-1 (15.06-fold) and Angiopoietin-1 (ANGPT-1) (4.61-fold) (Table 4). We previously reported that another heparan sulfotransferase, NDST-1, is upregulated during the late stage of embryoid body differentiation, playing a preponderant role during vasculogenesis partly through the modulation of the IGF signaling axis [47]. Whether this is the case for HS3ST-1 remains to be determined, although knockout mice studies mainly suggest a role in clotting [48]. ANGPT-1, a glycosylated cytokine, is a potent promoter of both embryonic and adult angiogenesis, mainly through anti-apoptosic mechanisms downstream of its tyrosine kinase receptor, TIE-2 [49-51]. In stem cell settings, ANGPT-1 appears to promote survival of both endothelial and neural cells [52,53]. Interestingly, recent studies have implicated a synergistic effect between ANGPT and IGF family members during angiogenesis and neurogenesis [54,55].
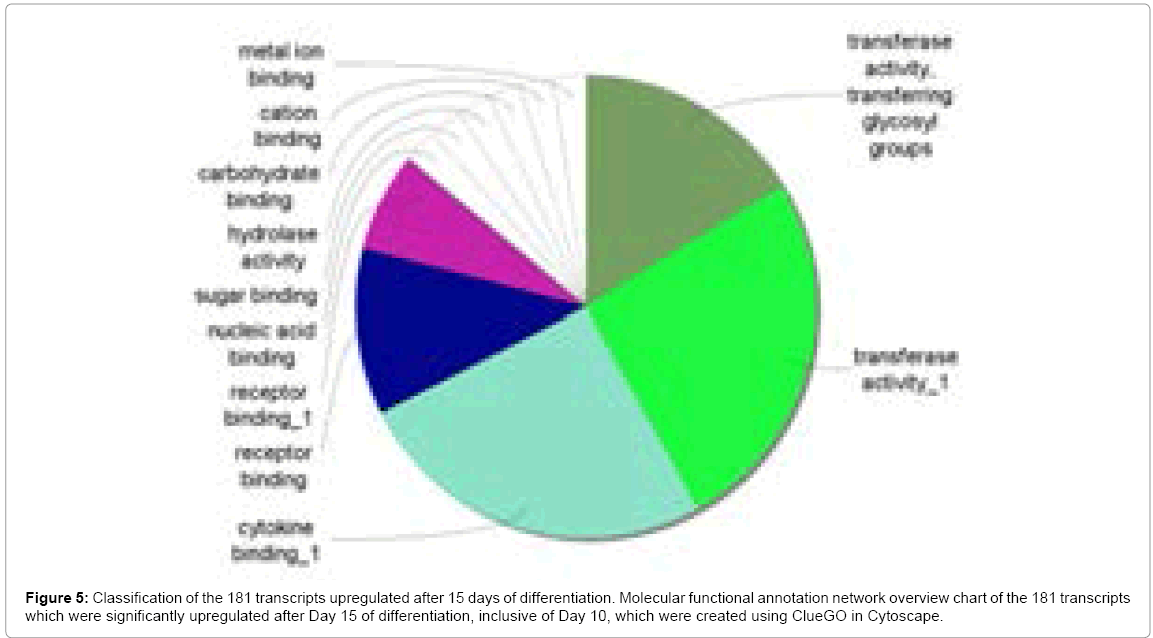
Figure 5: Classification of the 181 transcripts upregulated after 15 days of differentiation. Molecular functional annotation network overview chart of the 181 transcripts which were significantly upregulated after Day 15 of differentiation, inclusive of Day 10, which were created using ClueGO in Cytoscape.
| biological process | Gen Bank ID | Fold Induction | Adj.P.Val |
|---|---|---|---|
| Insulin Receptor Signalling pathway | NM_008341 | 191.8 | 1.79E-19 |
| response to growth factor stimulus | NM_008524 | 45.43 | 9.29E-17 |
| peptide cross-linking via condroitin4-sulfate glycosaminoglycan | NM_007833 | 33.76 | 3.22E-19 |
| death | NM_025622 | 17.01 | 1.24E-17 |
| metaboloic process | NM_010474 | 15.06 | 5.69E-18 |
| negative regulation of cell -substrate adhesion | NM_009262 | 11.98 | 5.75E-19 |
| protein glycosylation | NM_009177 | 5.52 | 3.87E-17 |
| memory gland morphogenesis | NM_009371 | 4.77 | 4.87E-18 |
| regulation of cell differentiation | NM_010544 | 4.73 | 2.31E-15 |
| negative regulation of apoptotic process | NM_009640 | 4.61 | 3.22E-19 |
| trans membrane transport | NM_028060 | 4.4 | 6.40E-16 |
| cell-cell adhesion | NM_016885 | 3.52 | 5.65E-16 |
| germ cell migration | NM_021704 | 3.51 | 2.33E-17 |
| negative regulation of mega karyocyte differentiation | NM_019932 | 3.14 | 1.58E-09 |
| oligosaccharide metabolic process | NM_009181 | 3.02 | 2.09E-13 |
| cell adhesion | NM_011693 | 2.97 | 3.86E-13 |
| cell adhesion | NM_181277 | 2.9 | 3.00E-13 |
| cell surface receptor linked signal transduction | NM_010550 | 2.84 | 1.85E-15 |
| negative regulation of androgen receptor signalling pathway | NM_010512 | 2.83 | 4.62E-14 |
| leukocyte tethering or rolling | NM_176973 | 2.82 | 3.00E-13 |
| dephosphorylation | NM_001081306 | 2.8 | 2.87E-09 |
| glial cell migration | NM_001081249 | 2.73 | 4.35E-14 |
| embryo development | NM_173422 | 2.57 | 1.53E-13 |
| apoptosis ans survival_Granzyme B signalling | NM_001017959 | 2.53 | 9.70E-14 |
| cell-cell adhesion | NM_010740 | 2.48 | 1.47E-02 |
| regulation of ERK1 and ERK2 cascade | NM_010207 | 2.44 | 2.59E-13 |
| microphage chemotaxis | NM_009987 | 2.43 | 3.90E-06 |
| glycolipid biosynthetic process | NM_011674 | 2.39 | 1.14E-10 |
| response to methyl mercury | NM_009712 | 2.36 | 2.71E-12 |
| cochlea development | NM_008010 | 2.3 | 8.01E-12 |
| lipid glycosylation | NM_026247 | 2.27 | 7.74E-12 |
| regualtion of cell growth | NM_018741 | 2.24 | 4.90E-08 |
| positive regualtiopn of transcription,DNA- dependent | NM_009368 | 2.23 | 2.37E-09 |
| cell proliferation | NM_001037859 | 2.19 | 1.41E-09 |
| positive regulation of CD4-positive,alpha-beta T cell differentiation | NM_009856 | 2.14 | 4.36E-13 |
| positive regulation of cell proliferation | NM_010419 | 2.09 | 2.50E-09 |
| canonical Wnt receptor signalling pathway | NM_001042659 | 2.06 | 2.02E-10 |
| Notch signalling pathway | NM_007865 | 2.05 | 4.19E-09 |
| positive regulation of macrophage activation | NM_133775 | 2.03 | 1.86E-12 |
| regulation of apoptotic process | NM_009370 | 2.01 | 2.86E-10 |
| metabolic process | NM_015737 | 2.01 | 4.61E-10 |
| lipid glycosylation | NM_008080 | 2 | 8.76E-11 |
| cytokine-mediated signalling pathway | NM_008349 | 1.99 | 1.61E-11 |
| defense response | NM_010739 | 1.98 | 4.06-10 |
| positive regulation of chemokine(C-X-C motif) ligand 2 production | NM_010545 | 1.94 | 2.99E-13 |
| sphingolipid biosynthetic process | NM_019737 | 1.92 | 3.86E-13 |
| positive regulation of cell proliferation | NM_013518 | 1.9 | 4.00E-10 |
| regulation of mRNA stability involved in response to stress | NM_009951 | 1.9 | 1.66E-13 |
| positive regualtion of T cell proliferation | NM_031252 | 1.86 | 2.27E-09 |
| cell surface receptor signalling pathway | NM_019985 | 1.84 | 1.94E-09 |
| germ cell programmed cell death | NM_021099 | 1.84 | 5.15E-10 |
| angiogenesis | NM_145154 | 1.84 | 2.29E-09 |
| organelle organization | NM_007693 | 1.83 | 7.02E-12 |
| protein glycosylation | NM_009180 | 1.83 | 4.52E-10 |
| glucose metabolic process | NM_175013 | 1.8 | 7.29E-09 |
| decidualization | NM_001077184 | 1.77 | 3.35E-13 |
| mannose metabolic process | NM_025837 | 1.71 | 9.91E-11 |
| regulation of developmental process | NM_010929 | 1.71 | 1.65E-08 |
| protein glycosylation | NM_011375 | 1.71 | 5.09E-13 |
| neuropeptide signalling pathway | NM_010130 | 1.71 | 7.66E-04 |
| galactose metabolic process | NM_016905 | 1.69 | 1.64E-10 |
| inflammatory response | NM_145837 | 1.69 | 4.82E-12 |
| positive regulation of transcription, DNA-dependent | NM_009612 | 1.68 | 5.67E-09 |
| nerve maturation | NM_010017 | 1.67 | 1.17E-11 |
| galactosylceramide catabolic process | NM_008079 | 1.67 | 2.13E-09 |
| defense response | NM_010511 | 1.66 | 1.61E-08 |
| skeletal system development | NM_007560 | 1.66 | 5.82E-08 |
| fucosylation | NM_019934 | 1.66 | 1.52E-10 |
| galactosylceramide biosynthetic process | NM_016922 | 1.65 | 1.17E-09 |
| protein transport | uc009nqy | 1.65 | 2.61E-11 |
| proteinO-linked glycosylation via thronine | NM_139272 | 1.64 | 3.45E-10 |
| metabolic process | NM_001033441 | 1.64 | 3.93E-09 |
| growth | NM_145741 | 1.64 | 2.37E-10 |
| metabolic process | NM_016722 | 1.64 | 6.15E-11 |
| trmination of signal transduction | NM_011421 | 1.64 | 7.33E-10 |
Table 4: Genes that were downregulated after 15 days of differentiation versus Day 0. The top 75 transcripts, excluding housekeeping genes, are shown.
PCR validation of selected transcripts upregulated at Day 15 is shown in Figure 6, with ANGPT-1 and HS3ST-1 upregulated by 15.27- and 68.54-fold at Day 15, respectively. The importance of the ANGPTL family (Figure 3A and 3B) during ESC differentiation is reiterated here, as ANGPTL-6 transcripts were modestly but significantly upregulated (1.84-fold, Table 4) and PCR-validated (Figure 6). Although ANGPTL-6 mainly has a role as a glycosphingolipidsmodulator, in stem cell settings, it has been associated with hematopoiesis [56]. Interestingly, glycosphingolipids were recently shown to be important regulators of ESC differentiation into the endodermal and ectodermal lineages, partly through the upregulation of the glycosyltransferases beta-galactoside alpha-2,3-sialyltransferase-1 and -5 (ST3GAL-1 and ST3GAL-5) [57], which were upregulated by 5.52- and 1.71-fold in our study (Table 4). Whether there is a mechanistic link between ANGPTLs and ST3GALs during ESC differentiation, however, remains to be investigated. Combined with the other upregulated genes from Table 1, an interesting pattern is emerging. We have previously reported, using the Affymetrix GeneChip human genome array, that ANGPT-1 upregulates transcripts for ANGPTL-4 and CHSTs, while downregulating SULF-1 expression in endothelial cells [47]. It will be interesting to elucidate whether these transcripts are part of a novel pathway mediating vasculogenesis in the context of stem cell biology. In order to unmask an additional glycogene of interest, we looked at another modestly but statistically regulated gene, galactosamine (N-acetyl)-6-sulfate sulfatase (GALNS), which is involved in glycosaminoglycan degradation. GALNS was upregualted by 1.64- fold (Table 4) and PCR validated (Figure 6). GALNS transcripts are upregulated in response to FGF-2 during osteogenesis [58].
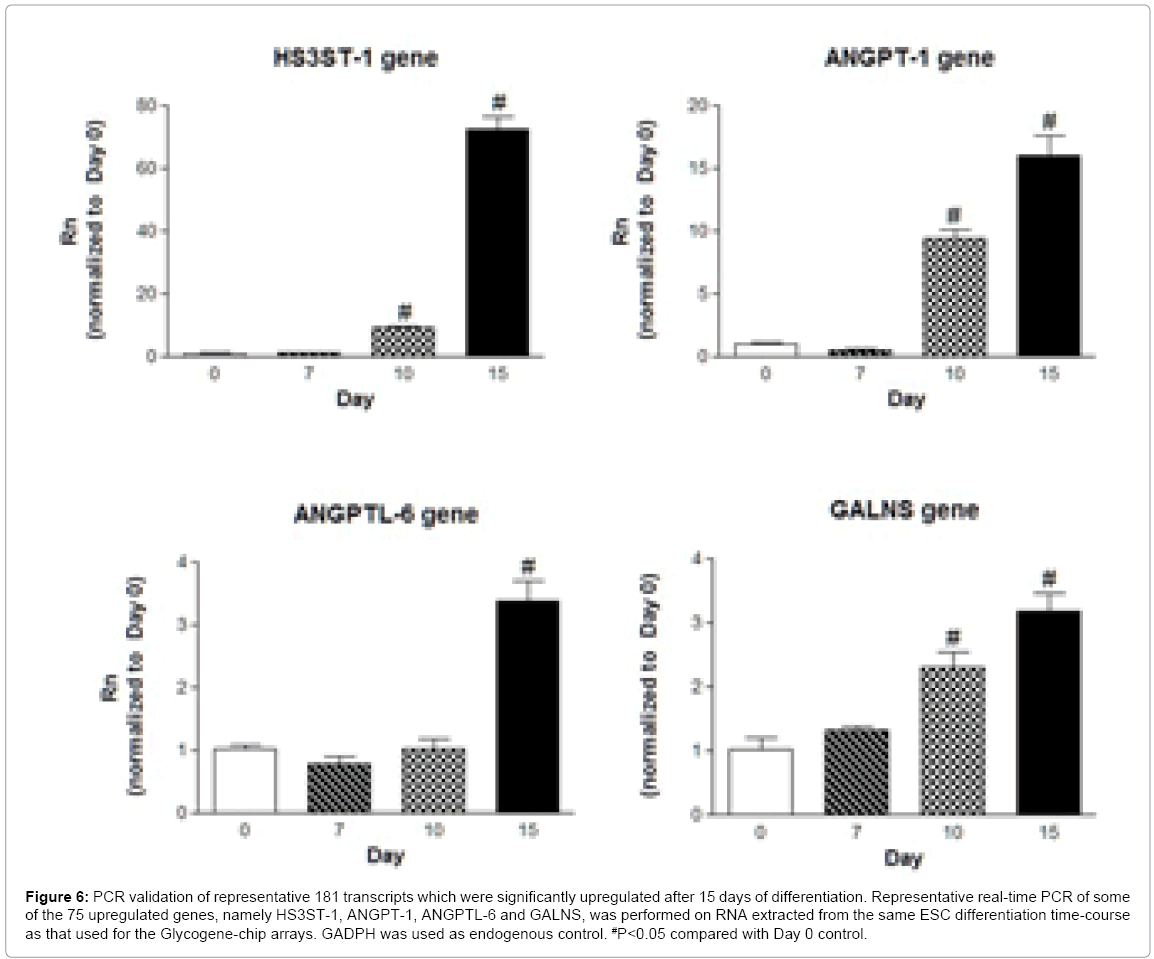
Figure 6: PCR validation of representative 181 transcripts which were significantly upregulated after 15 days of differentiation. Representative real-time PCR of some of the 75 upregulated genes, namely HS3ST-1, ANGPT-1, ANGPTL-6 and GALNS, was performed on RNA extracted from the same ESC differentiation time-course as that used for the Glycogene-chip arrays. GADPH was used as endogenous control. #P<0.05 compared with Day 0 control.
Metacore-generated biological pathway of these 181 genes revealed top scoring network implicated in 5 main processes: (1) regulation of sequence-specific DNA binding transcription factor activity (38.8%); (2) positive regulation of sequence-specific DNA binding transcription factor activity (32.7%); (3) positive regulation of cellular process (75.5%); (4) positive regulation of response to stimulus (53.1%) and (5) positive regulation of biological process (77.6%). A highly connected node of interest included ANGPT-1/TIE-2 receptor and A20 binding inhibitor of NF-kappaB-2 (ABIN-2) (Figure 7A). Altough the role of this axis in mediating ESC fate remains unclear, it’s been shown topromote endothelial survival [59]. There were also links between the transcription factors STAT-3 and activator protein-1 (AP-1) with ANGPT-1. Whereas no link is known between AP-1 and ANGPT-1, STAT-3 (which was also correlated with ANGPTL-2 expression, Figure 4) has been implicated in mediating endothelial cell survival through the ANGPT-1/TIE-2 axis [60]. Mechanistic validation of Tie-2 protein activation using immunoblotting showed significant receptor phosphorylation after 7 days of differentiation (Figure 7B). It woul be interesting in the future to investigate downstream mediators of the ANGPT-1/TIE2 aixs in mediating ESC fate using Glycogenechip hybridization in conjunction with Metacore analysis. Another interesting node included the forkhead transcription factor (FKHR) and vascular cell adhesion moelcule-1 (VCAM-1). Our previous work has implicated FKHR as a mediator of vascularization during ESC differentiation [9].
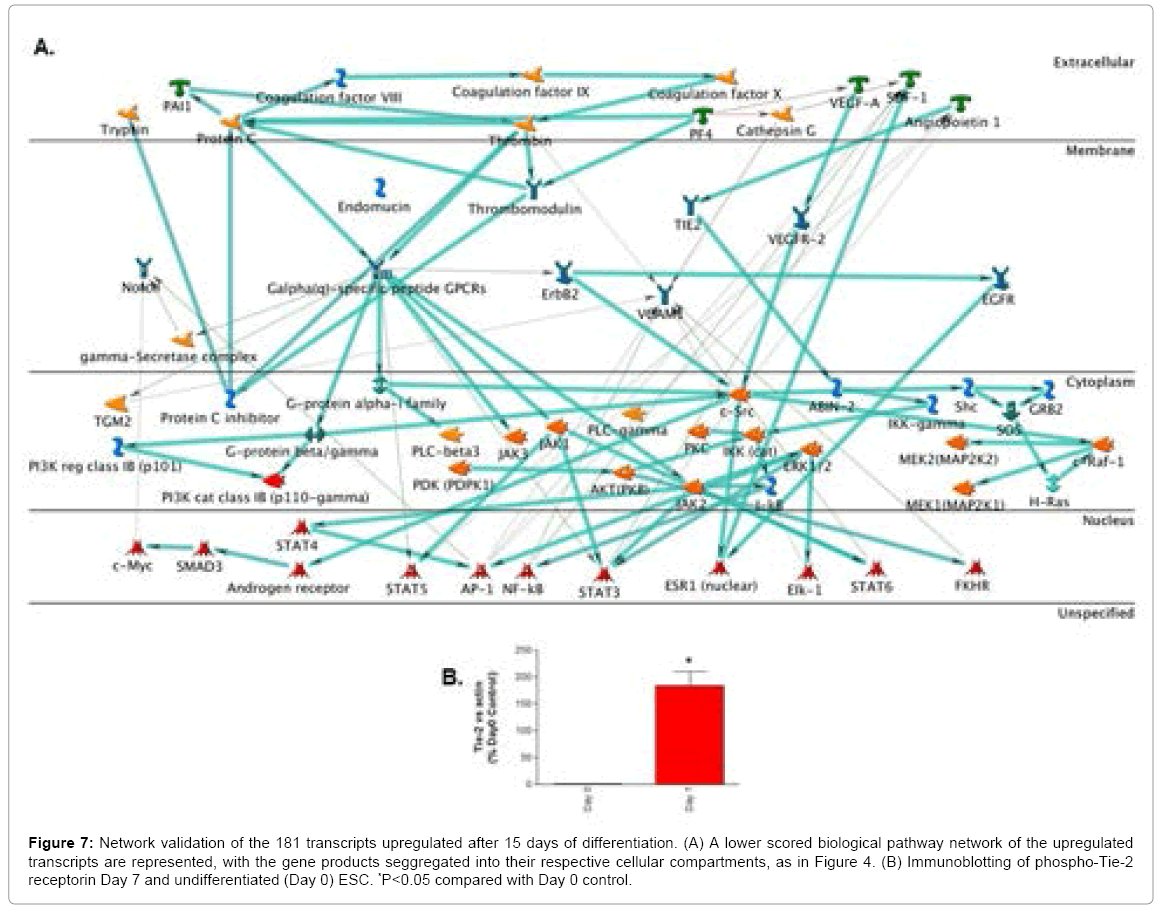
Figure 7: Network validation of the 181 transcripts upregulated after 15 days of differentiation. (A) A lower scored biological pathway network of the upregulated transcripts are represented, with the gene products seggregated into their respective cellular compartments, as in Figure 4. (B) Immunoblotting of phospho-Tie-2 receptorin Day 7 and undifferentiated (Day 0) ESC. *P<0.05 compared with Day 0 control.
Taken together, the combination of the Glycogene-chip microarray with bioinformatic analyses in the embryoid body model gave us a rapid and reliable method for uncovering potential novel signaling mechanisms which mediate ESC fate. In addition, this methodology allowed us to uncover modestly regulated, but novel, glycogenes which would be masked using other methods.
In conclusion, our study demonstrates that combining the Glycogene-chip with a standard ESC-derived embryoid body model is a powerful screening method to uncover novel glycogenes signatures in differentiatiing versus cycling ESC. Aside from confirming the importance of growth factors/receptors such as the IGF, PDGF, TGF and FGF families, the integration of this method along with bioinformatic analyses and molecular biology tools (real-time PCR and immunoblotting) allowed us to uncover the potential involvement of novel glycogenes belonging to the Angiopoietin (ANGPT) and Angiopetin-like (ANGPTL) families, as well as sulfotransferase, sulfatase and glycosyltransferase families. This study opens the door for future research to elucidate novel glycomic mechanisms which promote stemness versus differentiation. In turn, this would have profound implication for the regenerative medicine field.
The glycan analyses were performed by the Protein-Glycan Interaction Core (H) of the CFG, funded by NIGMS (GM62116). The authors wish to thank Mrs Lana Schaffer, Mrs Suzanne Papp and Mr Gilberto Hernandez at the Microarray Core of the CFG for their assistance with the microarray hybridization and ensuing analyses. We also thank Dr Zoltan Szabo and Dr Anne-Laure Papa for their editorial guidance. RH is supported by a CIHR postdoctoral fellowship. SS is supported by a National Institutes of Health Grant R01 (1R01CA135242-01A2) and a DOD grant (W81XWH-07-1-0482).