Journal of Geography & Natural Disasters
Open Access
ISSN: 2167-0587
ISSN: 2167-0587
Research Article - (2023)Volume 11, Issue 3
In this study, Geographic Information System based Multi-Criteria Decision Analysis (GIS MCDA) has been used for landslide hazard zonation. The Analytical Hierarchical Process (AHP) was applied for susceptibility assessment of landslides in Chimanimani district of eastern Zimbabwe. Six causal factors comprising slope, aspect, drainage, geomorphology, geology and land cover were analysed, evaluated and weighted. The susceptibility map was generated using the weighted overlay technique. The map validated by overlaying it with observed landslides during Cyclone Idai in March 2019. Area classified as highly susceptible covered 42.3%, moderately susceptible occupied 47.9% and lowly susceptible covered 9.6% of the district.
Geophysical hazards; GIS; Landslides; Multi criteria analysis
Extreme and unexpected hydro-meteorological and geological events such as floods, droughts, heat waves, cyclones, mudflows and landslides are increasing in frequency and magnitude. They are causing enormous damage to property, infrastructure, ecosystems, plants and animals ecosystems. Landslides occur where there is sudden downslope movement of water bearing soils, debris or rocks. Landslides can occur as topple, fall, spread or slide [1]. Vast resources are often channeled towards life search, recovery and rebuilding of infrastructure after landslide disasters. In the Himalayas, landslides cost more than US$1bn and cause 200 deaths every year. Although landslides have devastating effects their spatial distribution across arid and semi-arid landscapes, is not well understood [2]. This is due to shortage of real-time monitoring equipment and inaccessibility of some areas where landslides occur. Thus, it is critical to understand the distribution of landslide prone areas for objective land use planning, reliable monitoring, civil protection and disaster reduction in vulnerable communities. Zimbabwe’s Vision 2030 agenda regards reduction of disasters as one of the means to attain its middle income economy status by 2030.
Landslide susceptibility mapping
Landslide susceptibility mapping involves identifying and mapping areas that are prone to slope failure over space and time. This incorporates several geological, hydrological, meteorological and geomorphological factors, and weigh them against each other using spatial decision rules. Factors often combined include slope, aspect, soil type, distance from the rivers, geology, relief, drainage, precipitation, land use and land cover. Spatial decision rules typically involve a large set of feasible alternatives and multiple, conflicting and incommensurate evaluation criteria [3]. Accordingly, Geographic Information System based Multi-Criteria Decision Analysis (GIS MCDA) has procedures and techniques for decision making by evaluating the relative importance of various factors and criteria. On one hand, GIS is a decision support system involving techniques and procedures of storing, manipulating, analysing and visualising spatially referenced data. On the other hand, MCDA comprise techniques and procedures for structuring decision problems, and designing, evaluating and prioritizing alternative decisions [4].
Thus, GIS MCDA is a process that transforms and combines geographical data and value judgments or the decision‐maker's preferences to obtain information for decision making. Methods for data integration and analysis for landslides hazard zonation include; analysing the distribution of landslides in an area, statistical analyses for small areas with detailed field information and using weighting rating system of different predictors [5]. In this study, slope angle, soil type, rock type, aspect, distance from streams, Land Use and Land Cover (LULC) were used for landslide susceptibility mapping. The Analytical Hierarchical Process (AHP), a GIS-MCDA technique was applied for rating and weighting each decision criterion. Compared with other methods, the AHP is a simple and quick procedure to aggregate criteria weights and integrating different datasets in a spatial decision support system. Studies have shown that AHP performs best compared to other MCDA techniques such as the weighted linear combination and ordered weighted average methods. The AHP compares two criteria and determines which criterion is more important than the other using a scale with values from the set (1/9, 1/8, 1/7, 1/6, 1/5, /1/4, 1/3, 1/2, 1, 2, 3, 4, 5, 6, 7, 8, 9). The value 1/9 represents the least important, 1 represents equally important and 9 represents the most important [6].
Study area
Chimanimani district lies to the eastern border of Zimbabwe and Mozambique (Figure 1). The district covers an area of 30,283.36 km2 and its population was 134,940 during the 2012 national population census [7].

Figure 1: Location of Chimanimani district in Zimbabwe.
The rocks in district are primarily of the frontier series of the Umkondo group, dominated by limestone, shale, quartzite, dolerite and metasediments. Sediments over 1785 million years old dating from the later Precambrian period lie on the older Archaean Basement complex. The sediments deposited in a basin were folded and piled against younger rocks by tectonic movements to form fold mountains [8]. The relief comprises a mountain plateau of folded quartzite and metamorphosed sandstones to the east and a low-lying valley in the west. Of significance is the Chimanimani mountain range stretches from west to east with altitudes ranging between 1,000 m and 2,436 m. On top of the mountain range, the frost occurs above 1,500 m, and, intercepts moisture air from the Indian Ocean resulting in relief rainfall on windward slopes to the east. Soils are primarily determined by the underlying geology. The four main soil types are; red soils or ferralsols derived from schist, white sandy soils or leptosols derived from quartzite, alluvial soils or luvisols fringing larger streams and small rivers, and forest soils or lixisols which are humus-rich and underlie the moist forest [9].
Climate of Chimanimani varies from humid tropical in the eastern highlands to semi-arid in the north and west lowlands. The mean annual temperature varies from 22°C in the lowlands to 18°C in the mountains. The rainy season extends from November to April. On average, about 1,074 mm of rainfall is received annually with significant variation from the highland to the lowland. Low-lying semi-arid areas receive on average 484 mm/year of rainfall while the neighbouring highlands receive 1,300 mm/yr [10]. The average pan evaporation rate is 2,000 mm/year. The district is susceptible to landslides and floods because of high relief, torrential rainfall, cultivation and deforestation on steep slopes. Recently, it was severely affected by landslides triggered by heavy rainfall due to Cyclone Idai from 15 to 17 March 2019. About 150 people were killed, 200 people went missing and 50,000 people were affected by cyclone induced floods and landslides in the district. Thus, the event was declared a national disaster and the government of Zimbabwe declared 23rd and 24th March 2019 as national days of mourning of the flood and landslide victims [11].
Slope angle
Slope angle was estimated from the 30 m resolution Shuttle Radar Topography Mission (SRTM) Digital Elevation Model (DEM) obtained from the USGS website. The DEM was processed in ILWIS GIS to derive the slope angle by filling in sinks, calculating the height difference in the X and Y directions, calculating and converting slope in percentage to slope angle in degrees using built-in algorithms in ILWIS. The resultant slope map in degrees was categorised into five classes, namely: less than 1°, 1-9°, 9-18°, 18-26° and greater than 26°.
Slope aspect
To estimate slope aspect, the ILWIS built-in functions and formulae were used. Firstly, height difference in X and Y directions were estimated [12]. Then the slope aspect in radians was estimated and then converted to degrees. The slope aspect map was classified into 12 compass points using the slice operation to create a slope direction domain with the boundary of direction in degrees in ILWIS.
Rock and soil types
The geology map of Chimanimani district was clipped from the 1:250,000 geological map of Zimbabwe using the boundary of the study area in QGIS. The rock classes were categorised into sedimentary rocks comprising limestone, and shale, igneous rocks consisting of basalts, granite, dolerites and gabbros and, metamorphic rocks comprising metasediments , schists and quartzites [13]. The soil map of Zimbabwe was obtained from FAO database. From the Zimbabwe soil map, the soil map of Chimanimani district was clipped using the boundary of study area in QGIS. Soils of the study area were categorized into leptosols, lixisols, ferralsols and luvisols. The soil map was rasterized from vector to raster.
Land use and land cover
To obtain Land Use and Land Cover (LULC), Landsat 8 top of atmospheric corrected image was obtained from Google Earth Engine. The image was already corrected for atmospheric effects and we filtered for cloud cover to 10%. The image was then processed in ILWIS for classification. Bands 4, 3, 2 were used for true colour image visualization. The image was classified into water, forest, built-up area, bare area, cropped fields and grasslands [14].
Stream buffer classes
To delineate stream buffer distances, streams for the study area were clipped from the 1:250,000 hydrology map of Zimbabwe using the vector clipper in QGIS and overlaid with the boundary of the study area. The buffers were then constructed in ArcGIS using the multi buffer tool [15]. Eight buffer classes from the streams were produced, these are; 0 m-100 m, 100 m-200 m, 200 m-300 m, 300 m-400 m, 400 m-500 m, 500 m-600 m, 600 m-700 m, and 700 m-800 m.
Data integration and analysis
The Analytical Hierarchical Process (AHP) was used to select factors for landslide hazard mapping. Firstly, the factors were ranked according to their importance on the scale 1-9 using information from literature (Table 1).
| Factor | Rank | Explanation |
|---|---|---|
| Slope | 9 | Steep slopes are more prone to landslides than gentle slopes because shear stress increases as slope angle increases. |
| Soil type | 8 | Unconsolidated soils derived from weathered material such as till and clay are affected by shear forces. |
| Distance from rivers | 8 | Erosion of slopes from the bottom causes slope instability and shear stress increases from slope toes upwards. |
| Aspect | 7 | Indirectly influence landslides by controlling the intensity of climate variables such as rainfall. Climate triggers landslides and controls rate of weathering which results in unstable slopes. |
| Rock type | 4 | Rocks influence the landslides indirectly. Landslides are frequent on folded, faulted and sheared rocks. |
| LULC | 3 | Vegetation composed of woody, strong root system destabilise slopes while dense land cover reduce the risk of landslides |
Table 1: Ranked factors.
Secondly, the pairwise comparison matrix was computed by comparing one factor against the other and assigning the scores (Table 2).
| Factor | Slope | Aspect | LULC | Soil | Rock type | Buffer distance |
|---|---|---|---|---|---|---|
| Slope | 1 | 9 | 9 | 9 | 9 | 9 |
| Aspect | 45170 | 1 | 7 | 8 | 7 | 8 |
| LULC | 45170 | 45108 | 1 | 45139 | ¼ | 45139 |
| Soil | 45170 | 45139 | 8 | 1 | 8 | 8 |
| Rock type | 45170 | 45108 | ¼ | 45139 | 1 | 45139 |
| Buffer distance | 45170 | 8 | 8 | 8 | 8 | 1 |
Table 2: Pairwise comparison matrix.
Thirdly, the weight of each factor was determined by normalising the pairwise comparison matrix. Each cell value was divided by the column total and the criterion weight was obtained by adding values in each row for a specific factor and dividing the total by the total number of factors under consideration (Table 3).
| Factor | Slope | Aspect | LULC | Soil type | Rock type | Buffer distance | Criterion weight |
|---|---|---|---|---|---|---|---|
| Slope | 0.105 | 0.488 | 0.27 | 0.342 | 0.27 | 0.342 | 0.303 |
| Aspect | 0.011 | 0.054 | 0.27 | 0.304 | 0.21 | 0.342 | 0.199 |
| LULC | 0.011 | 0.007 | 0.03 | 0.004 | 0.007 | 0.004 | 0.011 |
| Soil type | 0.011 | 0.434 | 0.24 | 0.038 | 0.24 | 0.004 | 0.161 |
| Rock type | 0.011 | 0.007 | 0.12 | 0.004 | 0.03 | 0.004 | 0.029 |
| Buffer distance | 0.952 | 0.488 | 0.27 | 0.342 | 0.27 | 0.038 | 0.394 |
Table 3: Normalised factors and their criterion weights.
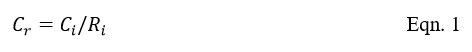
Finally, the consistency ratio was computed to check the consistency of the pairwise matrix because human judgement can violate the transitivity rule. The consistency ratio, Cr was calculated from consistency index Ci and random index, Ri using the formula [16].
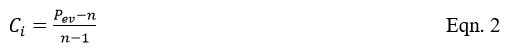
Whereas, the consistency index (Ci) was calculated from the principal eigen vaule Pev and number of factors, n using the formula.
A value of Cr<0.1 implies that the criterion weights can be reliably used and the pairwise comparison is consistent, acceptable and has been correctly normalized [17].
The factors with acceptable high weights (>0.1) were slope, buffer distance, aspect and soil (Table 3). Hence, they were weighted and used in landslide susceptibility mapping. The assigned factor weights ranged from 0 to 10 based on information from literature (Table 4).
| Factor and overall weight | Domain effect | Assigned weight with factor | Explanation |
|---|---|---|---|
| Soil type | Ferralsol | 10 | Composed of till and clay so highly susceptible to landslide |
| Till | 10 | Unconsolidated and derived formed from weathered materials | |
| Lixisol and luvisol | 7 | Clay in nature | |
| Leptosol | 3 | Comprise gravels which are less susceptible to landslides. | |
| Buffer distance (m) | <300 | 10 | Very close to the river and high risk of being eroded |
| 300-600 | 5 | They are at a medium distance and have low probability of being eroded | |
| >600 | 1 | Away from the river and low probability of landslides | |
| Slope angle (degrees) | 1-10 | 1 | They are nearly flat |
| 10-20 | 5 | Medium slopes are less affected by landslides | |
| >20 | 10 | Landslide are more active on steep slopes | |
| Aspect | East | 10 | Face windward direction |
| North east | 10 | Face windward direction | |
| South east | 10 | Face wind ward direction | |
| North | 5 | Face the leeward or rain shadow | |
| North west | 5 | Face the leeward direction or rain shadow | |
| West | 5 | Face the leeward direction or rain shadow | |
| South west | 5 | Face the leeward direction or rain shadow | |
| South | 5 | Face the leeward direction or rain shadow |
Table 4: Weights assigned on factors.
Landslide susceptibility map
The landslide susceptibility map was generated through weighted overlay of four causal factors that were determined from AHP. The factors are soil, stream buffer distance, slope and aspect. The process of weighted overlaying was performed in ILWIS. The accuracy of the landslide susceptibility map has been determined by validating it using 30 known landslides events (observed on google maps) that were triggered by Cyclone Idai in March 2019. This was achieved by overlaying the landslide susceptibility map with a point map of the 30 landslides.
Figure 2 shows the spatial variations of landslide susceptibility factors.

Figure 2: Variation of a) slope angle; b) slope aspect; c) geology; d) soil types; e) LULC; f) stream buffer distance.
Gentle slopes are less 1° are dominant to the west of the district. These are low land areas in river valleys. In the south, most slopes are 9-28° while steep slopes (26°-53°) are common in high elevations to the north and south east. Very steep slopes (>53°) are present on mountain summits and escarpments (Figure 2a). Ferralsols occupy 70% of the district and are dominant in the northeast, east, south east, south, and south west. The remaining 30% of the district is occupied by lixisols, leptosols and the luvisols. Leptosols are dominant from the north towards the south-west (Figure 2d). There is variation of land use and land cover in the district. Bare area and built up area stretch from the north to south parts of the district. Water bodies are dominant to the west and south. Forests and grass lands occupy the central and southern parts (Figure 2e). Figure 3 shows the classified landslide susceptibility map generated after weighted overlay of slope angle, slope aspect, buffer distance and soil type. The area classified as high susceptible cover 42.3% of the district and moderate susceptible cover 47.9%. Whereas 9.6% is lowly susceptible to landslide hazards.

Figure 3: Landslide susceptibility map.
Validation of the landslide susceptibility map
Figure 4 shows the validated landslide susceptibility map using Cyclone Idai landslides. Almost 67% of the observed landslides lie within the medium susceptibility category and 33% lie within the high susceptibility category. No observed landslides lie in the low susceptibility category (Figure 4).

Figure 4: Overlaid landslides during Cyclone Idai on landslide susceptibility map.
In this study, the landslide susceptibility map of Chimanimani district was produced from an overlay of four thematic maps of slope, aspect, soil and buffer distance from streams. From the assessment of areas which are susceptible to landslides, it was found that most of the areas (47.9%) in the district are moderately susceptible. Areas that are highly susceptible to landslides cover 42.3% of the district. Whereas, only 9.6% of the district was found to be lowly susceptible to landslides. Areas that are highly vulnerable to landslides are in the east and south side of the district. The areas comprise steep mountain slopes. Thus, as slope angle increases towards the east and south, so does shear forces. Increase in shearing forces makes the slopes unstable and prone to sliding. East facing windward slopes are more vulnerable to landslides because they receive high orographic rainfall which trigger landslides in the district. The presence of ferralsols and luvisols lead to high landslide risk. The soils are highly affected by shear forces because they are unconsolidated. It was also observed that the western side of the district is less vulnerable to landslides. Western slope angles are less than 1° implying the area has gentle slopes on low-lying plains and valleys.
The slopes have leptosols which comprise gravel hence are less affected by shear forces. Also, west facing leeward slopes are on the rain shadow of the Chimanimani mountain range. Thus, receive less rainfall as compared to east facing slopes. Validation of the landslide susceptibility map shows that the mapping was accurate as almost 90% of observed landslide fall within high and moderate susceptible areas. Accordingly, Feizizadeh and Blaschke (2013) validated the landslide hazard map produced by AHP and showed that 21.2% of the known landslides lied within the high susceptibility category, 75.7% of known landslides fell into the moderate susceptibility category while 3.1% were within the low susceptible areas. Nevertheless, a useful piece of further research would be to include faults or lineaments, distance from roads and precipitation as factors in landslide susceptibility mapping. This is potentially useful as the district has experienced tectonic movements which formed the Chimanimani fold mountains. Also, highly variable precipitation across the district often results spatial variations of landslide occurrence. Inclusion of these factors helps to improve landslide modeling.
The objective of this study was to determine the spatial variation of areas which are susceptible to landslides in Chimanimani district in Zimbabwe. By using the capability of GIS MCDA in producing a landslide map of the district, it was observed that most slopes are susceptible to landslides because they are unstable. Based on the research findings, landslide susceptibility maps are potentially useful in improving land use planning, research and rescue operations. Therefore, it implies that various geophysical and socio-economic factors need to be integrated to come up with a sound landslide hazard reduction model.
The authors are thankful to anonymous reviewers for the valuable comments and suggestions.
On behalf of all authors, the corresponding author states that there is no conflict of interest.
[Crossref] [Googlescholar] [Indexed]
[Crossref] [Googlescholar] [Indexed]
[Crossref] [Googlescholar] [Indexed]
[Crossref] [Googlescholar] [Indexed]
[Crossref] [Googlescholar] [Indexed]
[Crossref] [Googlescholar] [Indexed]
[Crossref] [Googlescholar] [Indexed]
[Crossref] [Googlescholar] [Indexed]
[Crossref] [Googlescholar] [Indexed]
[Crossref] [Googlescholar] [Indexed]
[Crossref] [Googlescholar] [Indexed]
[Crossref] [Googlescholar] [Indexed]
Citation: Mujere N (2023) GIS Based Multi-Criteria Decision Analysis for Landslide Susceptibility Mapping in Chimanimani District, Zimbabwe. J Geogr Nat Disasters. 13:259.
Received: 10-Sep-2020, Manuscript No. JGND-23-6443; Editor assigned: 15-Sep-2020, Pre QC No. JGND-23-6443(PQ); Reviewed: 29-Sep-2020, QC No. JGND-23-6443; Revised: 02-Jan-2023, Manuscript No. JGND-23-6443(R); Published: 30-Jan-2023 , DOI: 10.35841/2167-0587.22.12.259
Copyright: © 2023 Mujere N, et al. This is an open-access article distributed under the terms of the Creative Commons Attribution License, which permits unrestricted use, distribution, and reproduction in any medium, provided the original author and source are credited.