Journal of Geography & Natural Disasters
Open Access
ISSN: 2167-0587
ISSN: 2167-0587
Research Article - (2023)Volume 13, Issue 4
Ouagadougou is highly exposed to the risk of natural disasters such as flooding as a result of poor urban planning, the physical environment and climate change. The aim of this study is to use remote sensing and Geographic Information System (GIS) tools combined with multi-criteria analysis using Saaty's AHP method to map flood-prone areas in the municipality of Ouagadougou.
The methodological approach adopted is a combination of GIS and Saaty's AHP analysis method. Seven decision criteria considered to be risk factors were selected. These are the hydrographic network, altitude, slope, rainfall, soil types, land use and soil moisture index. These various factors were mapped and classified using the open source software QGIS; standardised, prioritised and aggregated in a GIS environment and analysed using the AHP method.
The results obtained show the map of different flood susceptibility zones in the Ouagadougou municipality. These flood vulnerability zones were classified into five classes of flood susceptibility zones. These are zones of very low vulnerability to flooding (24.48%), low vulnerability (27.93%), medium vulnerability (23.01%), high vulnerability (17.11%) and very high vulnerability (7.47%).
Since data is the foundation of GIS application studies, we suggest collecting and regularly updating satellite images, making high-resolution and precise drone images available for the Ouagadougou commune, creating a free-access data geoportal and training and raising awareness among professionals and disaster managers about the effective use of data. It will also enhance their technical skills in risk mapping and spatial analysis.
This work is a real decision-making tool for the management, prevention and mitigation of flood disaster risks in the Ouagadougou municipality.
Geographic information system; Multi-criteria analysis; Analytic hierarchy process; Flood mapping; Ouagadougou (Burkina Faso)
Of all natural disasters, flooding has the greatest impact on highly urbanized areas in terms of the economy and loss of life [1]. Floods occur in many parts of the world and cause the loss of life, economic damage and damage to infrastructure, etc. [2]. Flooding in urban areas is common worldwide and is associated with significant mortality and economic losses [3]. This is why flood risk assessment, management, response and preparedness are crucial [4].
Every year, the Sahelian countries face major floods, with diverse human and environmental repercussions (proliferation of epidemics, deaths, destruction of livelihoods, etc.). These disasters of hydrological origin cause inestimable economic losses at a time when the Sahel region is already heavily impacted by poverty [5]. Floods are one of nature's most destructive phenomena. In the West African sub-region, vulnerability to flooding may increase due to a multitude of factors such as high levels of poverty, demographic trends and insufficient public investment to strengthen resilience, environmental fragility, conflicts and climate change [6].
Like many countries around the world, Burkina Faso is faced with risks and disasters of both climatic and man-made origin [7]. On 10 September 2020 in Burkina Faso, damage linked to flooding and violent winds was recorded. The continuing increase in the number of people affected and the foreseeable scale of the situation has led the government to declare a state of natural disaster (Council of Ministers meeting of 08 September, 2020). In human terms, there were 13 deaths, 50 injured and 563 homeless. Material damage included homes destroyed (3,347), homes damaged (1,656) and emergency shelters for IDPs destroyed or damaged (1,790). There were also losses of animals (cattle, goats, sheep, donkeys, poultry) and more than 250 tonnes of foodstuffs destroyed or washed away [8]. More often than not, floods are multidimensional, so it is necessary to understand their causal factors, which are distinguished by several varieties of type, source, resolution and scale [9]. In view of the above, governments, political decision-makers, relief organizations, etc. must take measures to prevent and manage flood risks.
In the municipality of Ouagadougou, economic difficulties in accessing land are leading people to occupy informal settlements that are comparable to shanty towns (also known as "undeveloped" areas), with no public facilities [10]. Flooding has become a recurring problem in Ouagadougou since 2000. Flooding has become a recurring problem in Ouagadougou since 2000. According to documentary research carried out in two print media, Ouagadougou experienced eight floods between 2002 and 2012. The rainfall associated with the floods ranged from 43.8 mm to 261.3 mm [11]. These floods resulted in the loss of human lives, people being injured, houses collapsing, and other major damage to economic infrastructure [12].
The 2009 floods damaged 351 schools out of a total of 4,988 nationwide, a rate of 7.03%. The floods caused a high drop-out rate during the 2009-2010 school year due to the displacement of households, with some families returning to their villages. It also caused a delay in the implementation of school programmes. Although the floods occurred during the school holidays, the occupation of classrooms by flood victims prevented the effective start of classes on Friday 2 October 2009 in all schools across the country. This was due to disinfection and restoration work in some schools [13]. There are differences in the perception of the risk of flooding between districts in the Ouagadougou commune; 82.5% of the population in the arrondissements of Pissy and Yabtenga (Ouagadougou district) consider flooding to be dangerous or very dangerous, while 50% in the arrondissement of Karpala consider flooding to be less dangerous [10].
Nowadays, no territory is immune to disasters dominated by floods, which are particularly disastrous in urban areas. It is therefore essential to improve our understanding of people's vulnerability to flooding in order to provide decision-makers and the general public with useful information that will enable them to take adaptive measures by improving their ability to anticipate flooding [14].
It is therefore becoming essential to improve our understanding of people's vulnerability to flooding in order to provide decision-makers and the general public with useful information that will enable them to take adaptation measures by improving their ability to anticipate.
Presentation and location of the study area
The municipality of Ouagadougou as shown in Figure 1 is located in the province of Kadiogo, itself in the Centre region. Ouagadougou has twelve (12) arrondissements and fifty-five (55) sectors. It is the capital of Burkina Faso and the country's largest city. It covers an area of 518 km², or 0.2% of the national territory. It is bordered to the north by the rural communes of Pabré and Loumbila, to the east by Saaba, to the south by Koubri and Komsilga and to the west by the rural commune of Tanghin-Dassouri. It is located at 12°21′56″ North latitude and 1°32′01″ West longitude.

Figure 1: Location of the municipality of Ouagadougou. 
 Arrondissement; Numbers: Arrondissement number.
Data and tools
Data: There is no standard model that defines the exact number and type of criteria to be used in flood susceptibility mapping. In this study, we used multi-source and multi-format data as shown in Table 1.
| Data | Sources | Scale or resolution | Date of acquisition | Applications |
|---|---|---|---|---|
| Administrative boundaries of Burkina Faso, study area | IGB, BNDT | Shapefile vector | 2012 | Location map |
| Image Asterdem | USGS/NASA | 30 m | 2021 | Map of slope, altitude, drainage network density, topographical humidity index |
| Image landsat 8 OLI | SP/CNDD | 30 m | 2021 | Land use map |
| Soil type | BUNASOLS | Shapefile vector | 2012 | Soil type map |
| Precipitation | GEE(CHIPRS) | Excel | 2021 | Precipitation map |
Table 1: Data and characteristics of the data used.
| Authors | Factors | ||||||
|---|---|---|---|---|---|---|---|
| Dd | A | S | P | Lu | TWI | Ts |
|
| Aydin et al. [15] | ✓ | ✓ | ✓ | ✓ | ✓ | ✓ | ✓ |
| Penki et al. [16] | ✓ | ✓ | ✓ | ✓ | ✓ | ✓ | ✓ |
| Amaya et al. [17] | ✓ | ✓ | ✓ | ✓ | ✓ | ✓ | ✓ |
| Faye [18] | ✓ | ✓ | ✓ | ✓ | ✓ | ✓ | ✓ |
| Eba et al. [19] | ✓ | ✓ | ✓ | ✓ | ✓ | ✓ | ✓ |
| Amaya et al. [17] | ✓ | ✓ | ✓ | ✓ | ✓ | ✓ | ✓ |
| Kan et al. [20] | ✓ | ✓ | ✓ | ✓ | ✓ | ✓ | ✓ |
| Akindele et al. [21] | ✓ | ✓ | ✓ | ✓ | ✓ | ✓ | ✓ |
| Swain et al. [22] | ✓ | ✓ | ✓ | ✓ | ✓ | ✓ | ✓ |
Note: TWI: Topographical Wetness Index; A: Altitude; S: Slope; P: Precipitation; Lu: Land use; Dd: Drainage density; Ts: Type of soil.
Table 2: Authors who used at least the 7 criteria we used in this study.
| Criteria or decision factors | Units | Sub-criteria | Qualifier/ Justification of the criteria | Rang | Weight | Calcul AHP |
|---|---|---|---|---|---|---|
| Land use/Land cover | Level | Galleri forest | Very low | 1 | 0,072 | λ max=7,476 IC=0,079 RC=0,060 |
| Savannah | Low | 2 | ||||
| Bare ground | Moderate | 3 | ||||
| Growing area | Strong | 4 | ||||
| Wetland | Very strong | 5 | ||||
| Type of soil | Level | Sesquioxide soils | Low | 2 | 0,058 | |
| Lesser Evolved Soils | Moderate | 3 | ||||
| Raw Mineral Soils | High | 4 | ||||
| Hydromorphic Soils | Very Strong | 5 | ||||
| Drainage density | m2 | 0–22 | Very low | 1 | 0,21 | |
| 22-47 | Low | 2 | ||||
| 47-72 | Moderate | 3 | ||||
| 72-102 | Strong | 4 | ||||
| 102-167 | Very strong | 5 | ||||
| Precipitation | mm | 208–218 | Very low | 5 | 0,175 | |
| 218-225 | Low | 4 | ||||
| 225-235 | Moderate | 3 | ||||
| 235-248 | Strong | 2 | ||||
| 248-263 | Very strong | 1 | ||||
| Topographical Wetness Index (TWI) | -7,700 - -4,841 | Very low | 1 | 0,115 | ||
| -4,841 - -3,307 | Low | 2 | ||||
| -3,307 - -1,285 | Moderate | 3 | ||||
| -1,285 - 1,434 | Strong | 4 | ||||
| 1,434 - 10,081 | Very strong | 5 | ||||
| Slope | Degree (°) | 0 - 0,68° | Very Strong | 5 | 0,217 | |
| 0,68-1,25 | Strong | 4 | ||||
| 1,25-1,88 | Moderate | 3 | ||||
| 1,88-2,75 | Low | 2 | ||||
| 2,75-15,99 | Very low | 1 | ||||
| Altitude | m | 205 m–262 | Very Strong | 5 | 0,153 | |
| 262 m-273 | Strong | 4 | ||||
| 273 m-285 | Moderate | 3 | ||||
| 285 m–299 | Low | 2 | ||||
| 299 m-339 | Very low | 1 |
Table 3: Classification, evaluation and standardisation of decision criteria.
Tools: Data processing and analysis were carried out using the following tools: Office word for writing texts, Office Excel for calculations, graphs and analyses, QGIS for cartography and spatial analysis, ENVI for processing satellite images, Expert-GPS for transferring data from the GPS to the computer and from the computer to the GPS.
Methods
As part of this study, the Geographic Information System/Multi-Criteria Analysis (GIS-MCA) combination was used as a method for determining areas at risk of flooding.
Identification and choice of decision criteria: The criteria were selected on the basis of expert advice and a review of the literature. For this study, we identified and selected seven (7) criteria that we considered relevant for mapping flood-prone areas. Below is a Table 2 of authors who have used at least the factors mentioned and obtained satisfactory results.
Decision criteria mapping: Seven (7) decision criteria were identified for this study. These are the hydrographic network, altitude, slope, rainfall, soil type, land use and soil moisture index.
Mapping the density of the hydrographic network: Drainage density depends on geology (structure and lithology) and topographical features. However, it is linked to the hydrographic network. The denser the hydrographic network, the more intense the run-off phenomenon, and therefore the less infiltration, leading to the possibility of flooding [19].
The municipality of Ouagadougou is located in the Massili catchment area and is drained by a moderately dense hydrographic network as shown in Figure 2. It is crossed by four watercourses, some of which have been converted into canals, which flow into the upper Massili on its right bank. These are the central (or Paspanga) stream, the Zogona stream, the Mogho Naaba stream and the Wemtenga or Dassasgho stream.

Figure 2: Map of the density of the hydrographic network in the municipality of Ouagadougou.

Mapping altitude: Flooding is generally concentrated at lower altitudes because rainfall at higher altitudes accumulates downstream due to gravitational forces [17].
The urban district of Ouagadougou is characterised by its flat terrain and lack of high points as shown Figure 3. It forms part of the vast peneplain of the Centre region, with altitudes varying between 300 m and 350 m.

Figure 3: Altitude map of the municipality of Ouagadougou.

Slope mapping: Slope is one of the most important factors in flood risk mapping. All previous studies have taken this into account [21]. On steep slopes, the flow of water is accelerated, resulting in an increase in the flow of water in watercourses, which can increase the risk of flooding downstream.
The slope map is obtained by processing images with the free software QGIS and expressed in degrees, as shown in Figure 4.

Figure 4: Slope map of the Ouagadougou municipality. 
Soil type mapping: The texture and structure of each type of soil can have a significant influence on its permeability and, consequently, its water storage capacity [16]. Non-permeable soil allows water to run off, leading to flooding.
The soils in Ouagadougou are shallow. They are leached and hydromorphic tropical ferruginous soils developed on sandy, sandy-clay or clayey materials as shown in Figure 5. These soils are characterized by a fragile structure that is highly susceptible to erosion.

Figure 5: Map of soil types in the municipality of Ouagadougou.  evolved soils.
Precipitation intensity mapping: Precipitation is one of the main causes of flooding. When daily rainfall is intense and prolonged, the ground becomes saturated with water, leading to excessive run-off and an accumulation of water on the surface, resulting in flooding with unpredictable consequences.
An analysis of rainfall over the last 30 years in Ouagadougou shows that rainfall and the number of rainy days vary greatly from one year to the next. The flooding observed in Ouagadougou is therefore partly linked to the poor infiltration of water and the blocking of gutters and so on [23].
The mapping was carried out using CHIRPS data extracted from the Google Earth Engine (GEE) cloud and interpolated in QGIS using the Inverse Distance Weighting (IDW) method. The map shows average annual rainfall of between 800 and 900 mm/year as shown in Figure 6.

Figure 6: Precipitation map of the Ouagadougou municipality.

Land use mapping: Land use is a criterion of vulnerability to flooding. It is important in determining whether a location is at risk of flooding. Forests and plants, for example, help water to infiltrate, while run-off is increased in urban areas, which are largely made up of impermeable surfaces and infertile land [16].
The original plant cover of the urban district of Ouagadougou has almost disappeared as a result of heavy urbanisation and peri-urban agriculture as shown in Figure 7. The classified forest of the Ouagadougou dam (or Bangr-weogo) and that of Gonsé are now the only major forest reserves in the municipality of Ouagadougou.

Figure 7: Land use in the municipality of Ouagadougou. 

Topographic wetness index mapping: The Topographic Wetness Index (TWI) is an assessment of the state of a soil's water reserves in relation to its optimum reserves. When the soil wetness index is close to 1, the soil is wet (above 1, the TWI indicates that the soil is tending towards saturation). Conversely, when it approaches 0, the soil is in a state of water stress (below 0, it indicates that the soil is very dry). The soil moisture index is a key factor in flooding, as it determines the infiltration potential of soils and their water saturation. Heavy rainfall on soil that is already saturated makes it difficult for water to be absorbed and accumulates on the soil surface, increasing the likelihood of flooding.
The soil moisture index is mapped by processing the SRTM satellite image using the formula:
TWI=ln(a/tanb)
• b is the local slope.
• a is the area drained by each pixel.
Analysis of the soil moisture index map as shown in Figure 8 for the municipality of Ouagadougou shows that the soil is saturated with water, as the values calculated are all below zero.

Figure 8: Soil moisture index map of the Ouagadougou municipality.

Classification, standardisation and normalisation of decision criteria: Each criterion identified is subdivided into classes representing either a particular environment or a range of values. Five classes, classified as very low, low, medium, high and very high, were created for each criterion in order to better interpret the results as shown in Table 3 [24].
Saaty 1984 rating scale: A Saaty rating scale ranging from 1 to 9 was used. A rating of 9 is assigned to the class of criterion qualified as "Very strong". Otherwise, the class is assigned a rating of 1 as shown in Table 4.
| Degree of importance | Meaning | Explantations |
| 1 | Equal importance of both elements | Two characteristics contribute equally to the objective |
| 3 | One element is slightly more important than the other | Experience and personal appreciation slightly favour one characteristic over another |
| 5 | One element is more important than the other | Experience and appreciation strongly favour one characteristic over another |
| 7 | One element is much more important than the other | One characteristic is strongly favoured and its dominance is demonstrated in practice |
| 9 | One element is absolutely more important than the other | Evidence favouring one characteristic over another is as convincing as possible |
| 2, 4, 6, 8 | Intermediate values between two judgements, used to refine the judgement | When a compromise is necessary |
Table 4: Saaty 1984 value scale [25].
| Dd | Dd | A | S | P | Lu | TWI | Ts |
|---|---|---|---|---|---|---|---|
| 1 | 1.0 | 1.0 | 1.0 | 3.0 | 3.0 | 5.0 | |
| A | 1.0 | 1 | 1.0 | 1.0 | 5.0 | 3.0 | 3.0 |
| S | 1.0 | 1.0 | 1 | 1.0 | 1.0 | 1.0 | 3.0 |
| P | 1.0 | 1.0 | 1.0 | 1 | 2.0 | 3.0 | 2.0 |
| Lu | 0.333 | 0.2 | 1.0 | 0.5 | 1 | 3.0 | 3.0 |
| TWI | 0.333 | 0.333 | 1.0 | 0.333 | 0.333 | 1 | 1.0 |
| Ts | 0.2 | 0.333 | 0.333 | 0.5 | 0.333 | 1.0 | 1 |
Note: TWI: Topographical Wetness Index; A: Altitude, S: Slope; P: Precipitation; Lu: Land use/land cover; Dd: Drainage density; Ts: Type of soil.
Table 5: Pairwise comparisons of the criteria matrix (AHP).
| Factors of decision | Weight |
|---|---|
| Drainage density | 21% |
| Altitude | 15,3% |
| Slope | 21,7% |
| Precipitation | 17,5% |
| Land use/Land cover | 7,2% |
| Topographical wetness index | 11,5% |
| Type of soil | 5,8% |
Table 6: Weight percentage of the factors matrix.
| n | 1 | 2 | 3 | 4 | 5 | 6 | 7 | 8 | 9 | 10 | 11 |
| CA | 0 | 0 | 0,58 | 0,90 | 1,12 | 1.24 | 1,32 | 1,41 | 1,45 | 1,49 | 1,51 |
Table 7: Random Coherence (RC).
Pairwise comparison matrix of decision criteria
The pairwise comparison matrix for this study is presented in Table 5 using a 7 x 7 matrix. The values in each row are compared with each column to define the relative importance of each factor. The technique for assigning weights to each criterion is based on the AHP multi-criteria hierarchy method developed by Saaty in 1984 as shown in Table 4. The rule is that the weight assigned to each criterion must vary between 0 and 1 and their sum is equal to 1.
Normalized weight percentage of each influencing decision criteria
The standardized weight of each decision factor determines the relative importance of each factor in terms of its role in flooding in the municipality of Ouagadougou.
In many studies, rainfall is the most important factor in flooding, as heavy rainfall reduces the amount of water infiltrated [4]. As a result, if the water does not flow into the river quickly, there is a greater chance of flooding. In Ouagadougou, on the other hand, it is not the amount of water that falls that is primarily responsible for flooding, but rather the slope, followed by drainage before the rainfall, as studies have shown [25,26]. In our literature reviews, we did not come across any document mentioning rainfall as the primary factor in flooding in Ouagadougou Table 6.
Calculation of eigenvalue, coherence index (IC), coherence ratio (RC), random coherence index (CA)
To test the consistency of the response, which indicates whether the data are logically related, Saaty 1984 suggests the following procedure Table 7 [25]:
Calculation of the eigenvalue: The matrix A is multiplied by the elements of the priority vector (x), x is the eigenvalue of the priority vector (n), and the average of the values found is calculated. The result is called the max value; Saaty 1990 suggested that the largest max eigenvalue is:
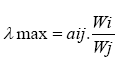
The eigenvalue calculated using the above formula gives a result equal to 7.476.
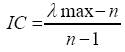
Calculation of the coherence index IC: During the judgement explanation stage, redundant comparisons are made to improve the validity of responses, given that decision-makers may be uncertain or may make poor judgements when comparing a few elements [27]. The coherence index is the ratio of the difference between the max eigenvalue minus the number of comparisons on it minus one. The formula for the coherence index is:
IC=Average consistency-number of elements/(number of elements-1)
Calculation of the coherence ratio CR: The Coherence Ratio (CR) is the ratio of the coherence index calculated on the matrix corresponding to the decision-maker's judgements and the random index IA of a matrix of the same dimension. If RC ≤ 0.1 or RC ≤ 10%, the matrix is considered to be sufficiently coherent. If this value exceeds 10%, the assessments may need to be revised [27].
RC=Consistency index/Random consistency

The calculated consistency ratio equal to 0.060.
Calculation of the random coherence index (CA): Saaty developed a scale in which the random consistency indices CA were established by making random judgements for a large number of replications. This CA number represents the average of the indices calculated at each replication for different square matrix sizes (n). The value of CA is shown in Table 5 of the random index: n=number of criteria.
If n=5, the corresponding value is equal to 1.12, so CA=1.12.
Aggregation of decision criteria in a GIS
Knowing the weights and standardized values of each criterion enables us to calculate the flood susceptibility index, given by equation:
The equation: 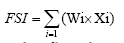 below is the application of the formula to obtain the flood susceptibility map for the municipality of Ouagadougou.
The final mapping result is obtained using the formula: (river system criteria × 0.21) + (altitude × 0.153) + (slope × 0.217) + (rainfall × 0.175) + (soil types × 0.058) + (land use × 0.072) + (soil moisture index × 0.115).
Where, FSI: Flood Susceptibility Index, Wi: The Weight of criterion i and Xi: The standardized value of criterion i. This aptitude index is on a scale of 0 to 10, as the sum of the weighting coefficients developed by Saaty's method is 1.
The thematic map consists of plotting the different index values, subdivided into intervals, and matching these index ranges with flood susceptibility classes.
Five classes of susceptibility very low, low, medium, high and very high -have been defined to make the resulting map easier to read and interpret.
Flood susceptibility map
The flood susceptibility map obtained shows five (5) distinct classes of flood susceptibility zones. These are areas classified as very low flood risk, low flood risk, medium flood risk, high flood risk and very high flood risk. The map shows that potentially flood-prone areas represent 7.47% of the study area as shown in Figure 9.

Figure 9: Flood susceptibility map.

Validation of flood susceptibility map
The AHP multi-criteria analysis method coupled with GIS produced sufficiently satisfactory results. Superimposing the high-flooding areas on a satellite image background gave us a clear picture of the flood-prone areas and enabled us to validate the flood susceptibility map for the Ouagadougou municipality as shown in Figure 10.

Figure 10: Areas potentially at risk of flooding 
In this study, the use of a method combining GIS and multi-criteria analysis by Saaty AHP to map flood-prone areas in the municipality of Ouagadougou provides a more complete understanding of the flooding phenomenon. However, the method presents a number of challenges. According to AHP is a simple and workable weighting technique, although it relies on the opinions and judgements of experts in the initial stages to assign weights to the different criteria, which can be time-consuming [22]. The weighting of the different criteria chosen and the scores assigned to the different classes of these criteria are all difficulties of the method [19].
Despite certain challenges, multi-criteria analysis and GIS ensure a perfect reconstruction of the various factors used to map flood susceptibility zones, such as elevation, slope, rainfall, land use, topographical moisture index and soil types. This approach of multi-criteria analysis combined with GIS has been used by several researchers in previous studies on the same subject as ours [16,20,21,28].
In fact, the results of this study show flood susceptibility map shows that boroughs 3, 4, 6, 7, 8, 9, 11 and 12 are areas at high risk of flooding. In other words, the arrondissements of Baskuy, Nongr-Maassoum, Boulmiougou, Bogodogo and Sig-Nonghin. Numerous studies on flooding in the Ouagadougou area have identified these same areas as being highly prone to flooding [11,26,29-31]. Which means we can validate the flood susceptibility map of Ouagadougou municipality.
Flood susceptibility zones in the Ouagadougou commune were mapped using Saaty's AHP analysis method coupled with GIS. In this study, seven (7) factors were selected, standardized and aggregated in a GIS using the AHP method (QGIS Easy AHP extension).
In prioritizing the selected factors, the greatest weight was given to the drainage density factor, followed by elevation, slope, rainfall, land use, topographical moisture index and soil types. The sum of the weighted factors in the GIS produced a map of flood zones classified into five 5 flood susceptibility zones. There are zones of very low vulnerability to flooding, low vulnerability, medium vulnerability, high vulnerability and very high vulnerability.
The information generated, the database produced and the maps produced as part of this work could help decision-makers to develop strategies for managing, preventing and mitigating the impact of flooding.
Floods have devastating consequences for people, property and the environment. To this end, it is essential to take preventive measures and adopt safe behaviors to minimize the risks associated with flooding. To this end, we recommend:
• Educate and raise awareness among all social classes in the Ouagadougou commune about the risks and consequences of flooding.
• Carry out communication campaigns on TV, radio, the media and social networks on the phenomenon of flooding before, during and after each winter season.
• Inform the population of weather forecasts and flood warnings.
By implementing these recommendations, we can hope to reduce the destructive impact of flooding and improve the resilience of the population of Ouagadougou to these increasingly frequent and severe climatic events.
The German Federal Ministry of Education and Research (BMBF), through the West African Scientific Service Centre on Climate Change and Adapted Land Use (WASCAL). Also, the University of The Gambia through its Department of Agriculture and Environmental Sciences which hosted us for our PhD training.
Conflicts of interest
The authors of this article declare no conflicts of interest.
Data availability statement
The data cannot be made available to the public; readers should contact the corresponding author for further details.
Citation: KAFANDO H, OUEDRAOGO B, OJEH VN, MILLOGO AMD, SOW AA (2023) Flood Susceptibility Mapping Using the Geographic Information System and Analytic Hierarchy Process Technique: Case of Ouagadougou Municipality in Burkina Faso. J Geogr Nat Disasters. 13: 286.
Received: 25-Oct-2023, Manuscript No. JGND-23-27784; Editor assigned: 30-Oct-2023, Pre QC No. JGND-23-27784 (PQ); Reviewed: 14-Nov-2023, QC No. JGND-23-27784; Revised: 21-Nov-2023, Manuscript No. JGND-23-27784 (R); Published: 28-Nov-2023 , DOI: 10.35841/2167-0587.23.13.286
Copyright: © 2023 KAFANDO H, et al. This is an open-access article distributed under the terms of the Creative Commons Attribution License, which permits unrestricted use, distribution, and reproduction in any medium, provided the original author and source are credited.