Journal of Pollution Effects & Control
Open Access
ISSN: 2375-4397
ISSN: 2375-4397
Research Article - (2016) Volume 4, Issue 2
Fish products may be important vectors of human exposure to heavy metals. However the understanding of how heavy metals bioconcentrate in different fish species (sp.) through contaminated environments such as wastewater treatment lagoons is very limited. In this study bioconcentration and Interspecies Uptake of Heavy Metals by three fish species (Oreochromis niloticus, Clarius gariespinus and Protopterus aethiopicus) receiving naturally contaminated wastewater was investigated. Tissue bioconcentration factors (BCFs) were estimated within a typical municipal wastewater lagoon, in Kenya. It was assumed that the three fish species were able to reach steady state with their dietary intake of heavy metals and through aqueous contact. Heavy metals concentration of up to 11.72, 11.27, 5.29, 4.12 and 4.74 mg/kg for, muscle, skin, liver, scales and gills respectively were obtained through analysis using ICP-MS instrumentation. The results showed variation in the estimated BCFs obtained for O.niloticus as compared to those obtained for P.aethopicus and C.gariespinus. The tissue BCFs ranged from 0.20 for Cd in scales of C. gariespinus to 11.27 for Zn in muscles of P.aethipicus. Results suggest that heavy metals uptake by the fish sp. and their transfer to various tissue organs do not exclusively depend on concentration levels by aqueous exposure alone but largely depends on their feeding mode, diet and biochemical needs of individual fish sp. Elevated concentrations of Pb and Cd in scales and skin were more than those obtained in muscles and liver which suggested depuration process, considering that Pb and Cd are non-essential metal ions to these fish sp. Fish need to be carefully screened to ensure that unnecessary high level of some toxic trace metals are not transferred to man. The bio concentration and interspecies uptake data estimated here provide a useful tool for predicting human exposure to Heavy metals via fish under different contamination scenarios.
Keywords: Bio-concentration; Heavy metals; Waste water lagoons; Interspecies uptake; Aquatic pollution; Risk assessment
Bioconcentration is a situation in which the levels of a toxin in an organism exceed the levels of that toxin in the surrounding environment. This term is often used specifically in reference to aquatic environments and aquatic organisms. Bioconcentration factors (BCFs) are used to express bioconcentration levels in a numeric way. Arithmetically, BCFs are obtained by dividing the levels of a toxin in an organism by the levels in the surrounding water to find a ratio. The higher the ratio, the more severe the bio concentration of toxins, in this study, the heavy metals level in fish. Bioconcentration factor (BCF) information is a requirement for risk assessment of chemicals and is used by regulatory regimes such as the Registration, Evaluation, Authorization and Restriction of Chemicals (REACH), which regulates chemicals in the European Union (EU) [1]. In several regulatory regimes, including REACH in the EU, the criteria for a chemical being categorised as bioaccumulative or very bioaccumulative is based on BCF and not biomagnification (BMF). In addition, risk assessment requires a BCF to estimate concentrations in prey for the investigation of risks from secondary poisoning. Unlike BMF which involves exposing organisms to the test chemical via the diet (in a dietary study) BCF is derived from the aqueous exposure method [1].
African aquatic systems are experiencing increasingly heavy metal pollution as a result of industrial growth and development [2]. Urbanization and industrialization cause increase in release of industrial and domestic effluents which constitute the largest sources of heavy metal pollution and therefore contribute to a steady increase of metallic contaminant in aquatic and terrestrial environment in most parts of the world [3]. Over 60% of industries are located in the three cities namely; Nairobi, Mombasa and Kisumu in Kenya. This results to industrial discharge of effluents containing heavy metals into the terrestrial and aquatic ecosystems within the cities. Typically, Kisumu city has one lagoon system (Nyalenda wastewater) which acts as a sink or reservoir receiving effluents of over 11,000 M3 daily. Figure 1 shows the location of the study site (Nyalenda Waste Stabilization lagoons).
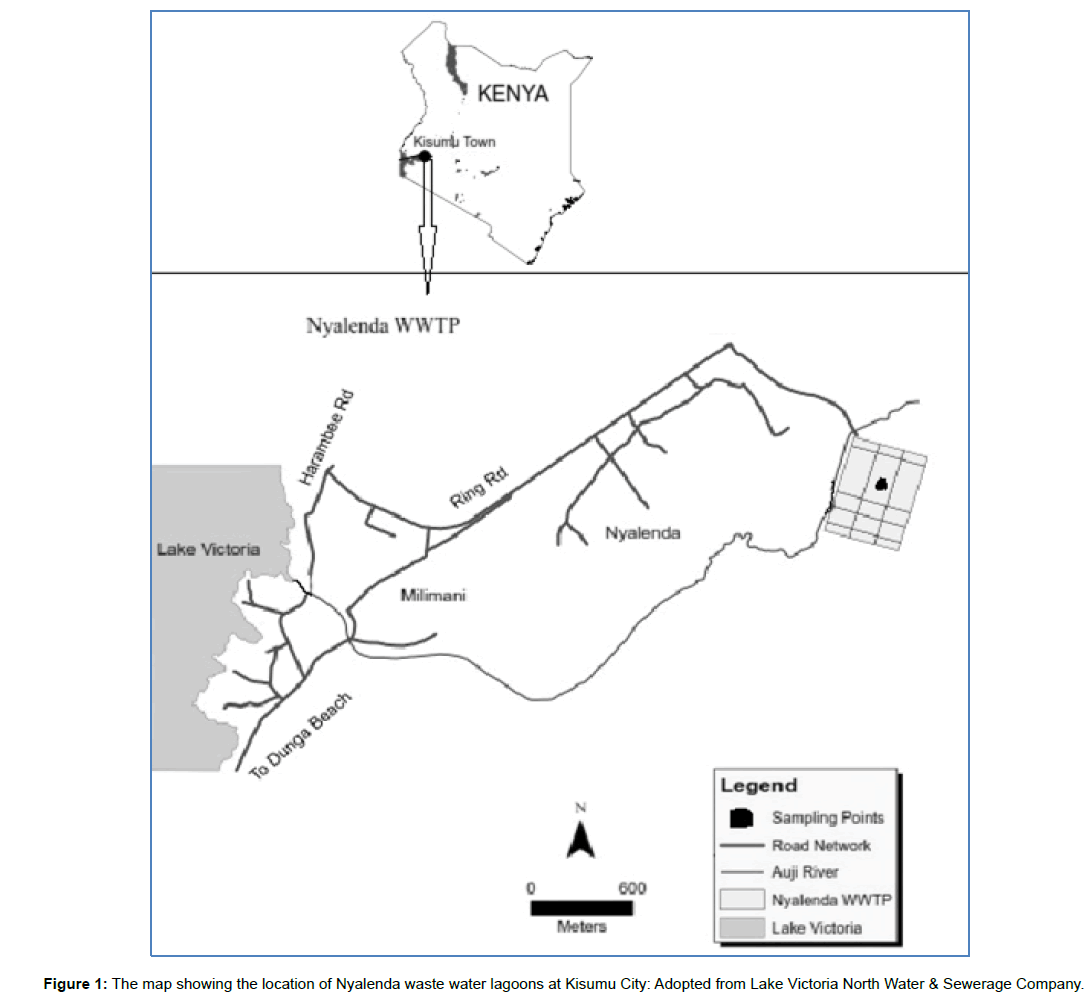
Figure 1: The map showing the location of Nyalenda waste water lagoons at Kisumu City: Adopted from Lake Victoria North Water & Sewerage Company.
With contamination of aquatic ecosystems, aquatic animals are constantly exposed to heavy metals, hence results in bio transference and biomagnification of hazardous heavy metals to humans, as a result of consumption of fish [4]. Because of their chemical stability, heavy metals tend to accumulate into the different tissues of aquatic organisms [5]. Studies have shown that sediments form a major sink of heavy metals [6]. Therefore the sediments contamination is also an exposure route for heavy metals in human, through the consumption of the Benthoic organisms and bottom feeder fish such as Clarius sp. and Protopterus sp.
Both essential and non-essential elements are persistent and bioaccumulative and therefore they are potentially significant in ecotoxicology [7]. Contamination by heavy metals causes a long lasting effect on ecological balance of the environment and destroys the diversity of different aquatic species living in it [8,9]. Tissue accumulation of heavy metals via polluted waters depends on concentration, time of exposure, way of metal uptake, environmental conditions (water temperature, pH, hardness, salinity), and intrinsic factors (fish age, feeding habits) [10]. Various metals show different affinity to fish tissues. Most of them accumulate mainly in liver, kidney and gills. Fish muscles, comparing to the other tissues, usually contain the lowest levels of metals [10]. Fish liver is one of organs which is most susceptible to storage of heavy metals and therefore commonly used in analysis [11]. The results of many field studies of metal accumulation in fish living in polluted waters show that considerable amounts of various metals may be deposited in fish tissues without causing mortality [10]. Biomonitoring of trace elements is essesntial to access ecosystem health [12].
Nyalenda Waste Stabilization lagoons (NWSL) treat wastewater before discharge into Winam Gulf (Lake Victoria). During and before the time of study, there lacked information on their efficiency of the lagoons in waste water treatment [13]. Sewage effluent and surface runoffs supply the water bodies and sediment with huge quantities of inorganic anions and heavy metals [14]. The NWSL is a source of Fishery especially the Oreochromis niloticus, Clarius gariespinus and Protopterus aethiopicus. Fish from NWSL are commercially available and is part of the diet of the local population in the Lake Victoria region of East Africa. Therefore there is need to monitor the levels of heavy metals in fish, sediments and water with a view of assessing the current status of pollution in waste water lagoons. In addition, Surface water is the main source of drinking water in riparian states of East Africa that share Lake Victoria water. Going by the limited number of study publications on environmental pollutant indicators such as heavy metals BCFs for fish within the region, there is need for more studies and data report for global readership.
Sample collection
Samples of fish, water and sediments were collected in Nyalenda Wastewater Lagoons which is located 4 kilometers north of Kisumu. Sediments sampling was restricted to the lagoons and up to a depth of 100 cm below the water surface. Sediments were collected using stainless steel spoons which were previously washed at intervals with water in sediment environment. Water sample was collected within the ponds where fish was obtained in 1 L polypropylene bottle. Fish Sampling was done at the same site where sediments were collected and samples put in clearly labeled plastic bags. The fish were then placed in an ice box and transported to the laboratory and stored in a deep freezer prior for analysis.
Fish identification, maturity, diet and mode of feeding
The identification of the fish species were carried out at the Biological department of Masinde Muliro University of Science and technology. The species of the fish collected were identified as; Oreochromis niloticus, Clarias gariepinus and Proptopterus Aethipicus. In addition, all the fish were confirmed as mature. The maturity length of O. niloticus (Nile tilapia) is 20 cm [15]. Nile tilapia are known to feed on phytoplankton, periphyton, aquatic plants, invertebrates, benthic fauna, detritus, bacterial films [16] and even other fish and fish eggs. Depending on the food source, they feed either via suspension filtering or surface grazing, trapping plankton in plankton rich bolus using mucus excreted from their gills [17]. O. niloticus have been observed to exhibit trophic plasticity according to the environment and the other species they coexist with [18]. C. gariespinus reaches maturity towards the end of the second year (350 mm Total length (TL), rarely towards the end of the first year, 240 mm TL). Clarius gariespinus and Protopterus aethiopicus respectively reaches maturity at around 24 cm TL and 70 - 76 cm TL [9,19] towards the end of the second year (350 mm TL, rarely towards the end of the first year, 240 mm TL).
Laboratory apparatus and chemicals
The laboratory apparatus comprised the following: glass wool, propylene bottles, 50 ml volumetric flask (Pyrex borosilicate glass, Germany) stainless steel raddle with elongated handle, samples drying papers, pestle and motors, dissection kit, unit sieve, weighing balance, digestion block, electric hot block. All the chemicals were purchased from Sigma-Aldrich through Kobian limited, Kenya. Reagents used were all of analytic grade, concentrated nitric acid, hydrochloric acid, sulphuric acid and hydrogen peroxide purchased from Sigma-Aldrich through Kobian limited, Kenya.
Pretreatment and digestion of fish tissues
Upon identification weight and length of the fish were measured, and recorded as follows; 1650 g and 70 cm, 1762 g and 72 cm, 152.9 g and 25.2 cm) for C. gariespinus, P.aethopicus and O. niloticus respectively. Samples were allowed to thaw for at least 6 hours, and then rinsed with deionized water. Fish muscles were dissected from dorsal lateral part ventrally to the dorsal fin. Liver, gills, scales (from O. niloticus) and skin (from C. gariespinus and P.aethopicus) were then separated from respective fish sp. An aliquot of 5 g of weighed fish tissues and whole liver and gills for O. niloticus samples were put in digestion tubes and placed on aluminum digestion block. 4.0 ml of nitric acid (14N), a drop of (30%) silicon antifoaming reagent, and 4 ml of concentrated sulphuric acid (18.3) were then added to the samples tubes. The resultant mixture was heated at 60°C for 25 minutes. Further 12 ml concentrated nitric acids were added and digested as follows: 90 - 100°C for one hour, 100 -110°C for one hour, 110 -120°C for one hour. The digest were cooled to 80C then 2.0 ml of 30% (V/V) hydrogen peroxide was added to oxidize the organic matter present. The digests were then returned to hot block and heating continued at 130°C for 30 minutes. This was then followed by filtration through small piece of glass wool (soaked in (10% V/V)) nitric acid and rinsed with dionized water). The digests were transferred into 50 ml volumetric flask and made to the mark using deionized water and stored in propylene bottles ready for ICP analysis. The O. niloticus scales obtained were placed on a clean petri dish and oven dried to a constant weight at 100°C. An aliquot of 2 grams of dry scale were weighed into digestion tubes and 5 ml of concentrated nitric acid (14 N) added. The resultant mixture was digested at 100°C for 3 hours (until brown fumes ceased). After cooling to 80°C, 1 ml of 30% w/v H2O2 was added. The digests were further returned to the hot plate and further heated at 100°C for one hour. The digests were finally cooled and filtered through glass wool and made to the mark with deionized water. The digest were finally transferred to 50 ml flask added to the mark and stored in polypropylene bottles ready for analysis.
Sediment and water analysis
The sediments were oven dried at 10°C for 10 hours, ground and sieved through 60 μm sieve size. Coarse particles were discarded. For analysis 2.0 g of sediments were weighed and put in digestion tubes and 20 ml mixture of concentrated hydrochloric (36%) and nitric acid (1:4) were added and digested at 70°C for 25 minutes, 100°C for 3 hours, followed by addition of 1 ml hydrogen peroxide and further heated for 30 minutes at 100°C on aluminum heating block. The digest were then allowed to cool and filtered into 50 ml volumetric flask, through a piece of cotton that was previously soaked in acid (10% nitric acid) and rinsed with deionized water. Water sample were collected using 500 ml polypropylene bottles that had been previously rinsed with deionized water and further rinsed with the sample water and acidified with 10% nitric acid. Water samples were then digested using procedure highlighted [20].
Instrumental analysis
Determination of the elements in all samples was carried out by inductively coupled plasma mass spectrophotometer ICP-MS SPECTRO ACROS (Germany) with ICP-OES analyzer. The detection wavelengths of the analytes were set at 228.8 nm, 324.8 nm, 213.8 nm, 267.72 nm and 283.3 nm respectively for Cd, Cu, Zn, Cr and Pb respectively. The quantification limits for individual analytes were as follows; Zn 0.01 mg/kg, Cu 0.14 mg/kg, Pb 0.02 mg/kg, Cd 0.1 mg/kg, and Cr 0.1 mg/kg.
Bioconcentration factors (BCFs) estimations
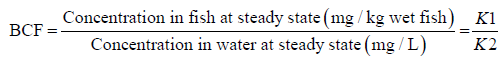
The calculated estimates of BCF in this study were as reported by Gobas, et al. [21] where bioconcentration factors (BCF) are defined as the ratio of the steady-state metal ions concentrations in the three fish sp. vs the concentration in water/sediments. Using the same equation 1, BCFs were tested based on sediment concentration for P.aethiopicus and C. gariespinus which are bottom feeders.
The assumption made in this estimation was (i) that the surrounding conditions, feeding, excretion by fish and chemical concentrations in the lagoon had attained steady-state; (ii) that the ratio of k1/k2 which is known as the kinetic BCF is equal to the steady state, and (iii), that BCF obtained by the ratio of the steady-state concentration in fish to that in water followed the First-order kinetics.
This assumption is shown by the following mathematical expressions;
Rate of uptake = K1 × [Cwater ] Expression 1
Rate of depuration = K2 × [Cfish ] Expression 2
Where K1 = First-order rate constant for uptake into fish (day-1).
K2 = First-order rate constant for depuration/elimination from fish (day-1).
[Cwater] = Concentration in water (mg /L).
[Cfish] = Concentration in fish (mg kg-1 wet weight).
At steady state the rate of uptake = the rate of depuration and so combining the two expressions gives the following relationship (expression 3) which is:
 Expression 3
The BCFs were calculated using the following equation;
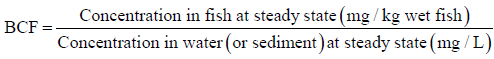 Equation 1
Concentration of heavy metals in fish tissue
All metals analyzed in this study were present in all the three fish sp. Zn was found to be the most abundant metal ion in all the tissue organs of the fish analyzed and it ranged from 0.68-10.2 mg/kg as shown in Figure 2. The highest concentration of Zn was in P.aethiopicus muscles 10.2 mg/kg, followed by the gills, skin and liver with respective concentrations of 3.44, 2.78 and 1.92 mg/kg. for P. gariepinus, the Zn concentration in organ tissues was in the following order; muscles, liver, gills and skin. In contrast to P.aethiopicus and C. gariespinus, Zn concentration in O. niloticus had higher Zn levels (4.12 mg/kg) in the scales, followed by the gills, muscles, and then liver. Cd was only detected in P.aethiopicus skin and gills with concentrations of 6.20 mg/kg and 1.60 mg/kg respectively. Cd is a non-essential heavy metal in the biochemical role in the life processes of fish and its obtained concentration in skin was of interest. The Cd present in the skin could indicate Cd ions depuration process through the skin. Cu was higher in muscles of C. gariespinus and P.aethiopicus compared to the other tissue organs but higher in scales of O. niloticus. The highest concentration of Cu was in P.aethiopicus muscles (4.63 mg/kg). Pb was detected in all fish sp tissue organs. Scales and skin were observed to contain more Pb than muscles and liver, in both fish sp. (Figure 2). Cr was detected in all the fish species tissue organs.
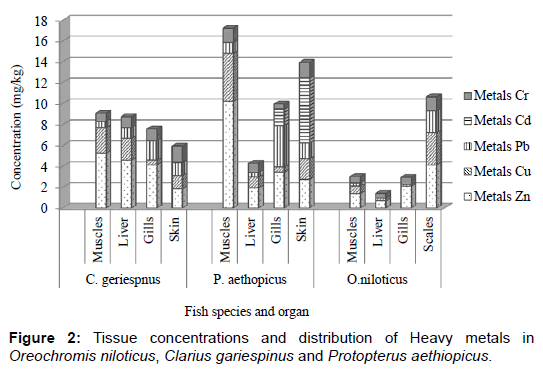
Figure 2: Tissue concentrations and distribution of Heavy metals in Oreochromis niloticus, Clarius gariespinus and Protopterus aethiopicus.
There was no positive correlation of metal ions concentration for the various organ tissues studied. Previous studies indicated that the variability observed in the metal levels of different species depended on ecological needs, metabolism [22], age, size and length of the fish [23] feeding habits [24] and their habitats [25].
Concentration in water and sediments
Table 1 above shows results of the heavy metals concentration in wastewater collected from several sampling points in Nyalenda lagoons. The mean concentration range of Heavy metals in the wastewater were from 0.51 ± 0.2 mg/kg (Cu) to 1.02 ± 0.5 mg/kg (Pb) as shown in Table 1. Sediments had higher heavy metals concentration in orders of magnitude of more than 4 to about 30 more than the concentrations in wastewater except for Cr. This study recommends Cr speciation study as it is of interest to know the form (oxidation state) of Cr ion in fish organ tissues, wastewater and sediments.
| Sample | Zn | Cu | Pb | Cd | Cr |
|---|---|---|---|---|---|
| Wastewater | 0.87 ± 3.0 | 0.51 ± 0.2 | 1.02 ± 0.5 | 0.55 ± 0.20 | 1.10 ± 0.4 |
| Sediments | 28.38 ± 3.7 | 4.19 ± 0.8 | 13.15 ± 2.0 | 32.88 ± 2.5 | 1.38 ± 0.3 |
Table 1: Concentration of Heavy metals in wastewater (mg/L) and sediments (mg/kg).
Bioconcentration factors
The BCFs were calculated using equation 1 above and results shown in Table 2. Zn had the highest BCF for all the fish sp. and ranged from 0.78 for O.niloticus liver to 11.72 for P.aethiopicus muscles. The BCFs for Cd were only calculated for the gills and skin of P.aethiopicus where the concentrations were above the levels of detection. Estimation of BCFs for Zn, Cu, Pb, Cd, and Cr in C. gariespinus and P.aethiopicus tissues based on sediments concentration are tabulated in Table 3. The two fish sp. is bottom feeders and ingests heavy metals that are adsorbed on sediment materials. The concentrations of heavy metals in sediments were several orders of magnitude higher than the concentrations in wastewater, for Zn, Cu, Cd, and Pb. Cr had highest concentration in sediments than in wastewater (Table 1). Therefore it was necessary to compare the BCFs that were based on sediment heavy metals concentration and those based on aqueous contact (wastewater concentration). Based on sediment concentration, the BCFs indicated bioaccumulation of heavy metals in Liver and Muscles of C.gariespinus for Zn and Cu which had factors>1.0. For P. aethopicus, bioaccumulation was observed in Muscles for Zn and Cu and Skin for Cu.
| Fish sp. | Metal | Fish Tissue BCF | |||
|---|---|---|---|---|---|
| Orechromis niloticus | Liver | Muscle | Gills | Scales | |
| Zn | 0.78 | 1.61 | 2.39 | 4.74 | |
| Cu | 0.55 | 1.39 | 0.35 | 6.06 | |
| Pb | 0.24 | 0.3 | ND | 2.03 | |
| Cd | ND | ND | ND | ND | |
| Cr | 0.41 | 0.54 | 0.62 | 1.23 | |
| Clarius gariespinus | Liver | Muscle | Gills | Skin | |
| Zn | 5.29 | 6.02 | 4.74 | 2.11 | |
| Cu | 4.1 | 4.84 | 0.96 | 2.49 | |
| Pb | 1.01 | 0.57 | 1.8 | 1.19 | |
| Cd | ND | ND | ND | 0.2 | |
| Cr | 0.93 | 0.71 | 1.02 | 1.39 | |
| Protopteru aethipicus | Liver | Muscle | Gills | Skin | |
| Zn | 2.21 | 11.72 | 3.95 | 3.2 | |
| Cu | 2.06 | 9.08 | 0.96 | 3.88 | |
| Pb | 0.44 | 1.01 | 3.88 | 1.47 | |
| Cd | ND | ND | 2.91 | 11.27 | |
| Cr | 0.93 | 0.71 | 1.02 | 1.36 | |
ND: Below detection limit.
Table 2: BCFs in L/kg for Zn, Cu, Pb, Cd, Cr in Fish sp. tissues based on aqueous contact.
| Fish sp. | Metal | Fish Tissue BCF | |||
|---|---|---|---|---|---|
| Liver | Muscle | Gills | Scales | ||
| Clarius gariespinus | Zn | 1.1 | 1.25 | 0.98 | 0.44 |
| Cu | 1.51 | 1.79 | 0.36 | 0.92 | |
| Pb | 0.04 | 0.02 | 0.06 | 0.04 | |
| Cd | ND | ND | ND | 0.01 | |
| Cr | 0.03 | 0.02 | 0.03 | 0.05 | |
| Protopterus aethiopicus | Liver | Muscle | Gills | Skin | |
| Zn | 0.46 | 2.43 | 0.82 | 0.66 | |
| Cu | 0.76 | 3.36 | 0.36 | 1.43 | |
| Pb | 0.02 | 0.04 | 0.14 | 0.05 | |
| Cd | ND | ND | 0.12 | 0.47 | |
| Cr | 0.03 | 0.02 | 0.03 | 0.05 | |
ND: Below detection limit.
Table 3: BCFs for Zn, Cu, Pb, Cd, Cr in Clarius gariespinus and Protopterus aethiopicus tissues based on sediments concentration.
Bioconcentration of Heavy metals in O.niloticus were observed as follows, Zn in muscles (BCF 1.61), gills (BCF, 2.39) and scales (BCF, 4.74). Cu bioconcentration was observed in muscles and scales with BCFs of 1.39 and 6.06 respectively, Pb and Cr bio concentration were observed in scales with BCFs of 2.03 and 1.23 respectively. Bioconcentration in C. gariespinus was observed for Zn in the entire organ tissues analyzed, Cu in liver, muscles and skin, Pb in gills and Cr in skin and the values were tabulated (Table 2). For P.aethiopicus, bioconcentration was observed as follows; Zn with BCFs of 2.21, 11.72, 3.95, and 3.20 for liver, muscles gills and skin respectively. Cu for liver, muscles and skin, Pb in gills and skin, Cd in gills and skin and Cr in skin (Figure 3). This variability in BCFs results show that bioconcentration of heavy metals in the fish sp. studied does not exclusively dependent on the concentration levels by aqueous exposure alone. As observed in Figure 3, the concentration of heavy metals in wastewater sample was lower than the concentrations obtained in various fish organs. These observations were an indication of bio-concentration in some of the fish organs analyzed. The bioconcentration observed in fish in this study as be explained as follows; C. gariespinus and P.aethiopicus are bottom feeders and a close similarly in the observed bioconcentration pattern of Zn, Cu, Pb and Cr points to the mode of feeding and diet as a major factor that determine heavy metals accumulation in these two fish sp. The difference in the amounts of various metal ions accumulation in fish body result from different affinity of metals to fish tissues, different uptake, deposition, and excretion rates [10]. Generally, metal levels in live fish usually follow the ranking: Fe > Zn > Pb > Cu > Cd > Hg. The levels of Zn may be very high, up to over 300 μg/g d. w., while the maximum concentrations of lead and copper are lower and usually do not exceed 10 μg/g d. w. Cadmium is accumulated by the fish in very low amounts, below 1 μg/g d.w. [10]. Previous studies in both, field and laboratory established a relationship between metal concentrations in fish and in the water [26,27]. It should however, be emphasized that body metal level is related to its waterborne concentration only if metal is taken up by the fish from water. If diet and feeding mode is the main source of metal, such a relationship does not necessarily occur.
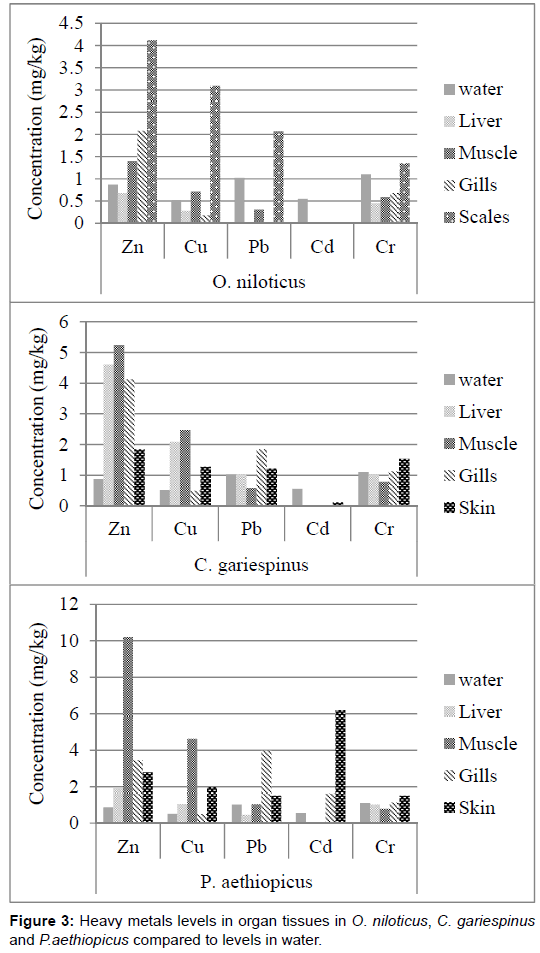
Figure 3: Heavy metals levels in organ tissues in O. niloticus, C. gariespinus and P.aethiopicus compared to levels in water.
Bioaoncentration transfer factors (BCFs) were estimated for heavy metals uptake in O. niloticus, C. gariespinus and P.aethiopicus for all the metals analysed except Cd. The BCFs ranged from 0.20 for Cd in scales of C. gariespinus to 11.72 for Zn in muscles of P.aethiopicus. The BCFs obtained based on wastewater heavy metals concentration and those obtained based on sediment concentration showed variations and therefore no organ tissue metal ions concentrations correlation among the fish species studied. The results suggested that heavy metals uptake by the fish in Nyalenda lagoons and their BCFs were largely depended on their feeding mode and diet. Scales and skin were observed to contain more Pb than muscles and liver, in the three fish sp. Cd present in the skin (BCF of 11.27 for P.aethiopicus) could indicate Cd ions depuration process through the skin, considering that Pb and Cd are non-essential metal ions to these fish sp. Furthermore, results from this study discourage consumption of fish catch from Nyalenda lagoons under the present levels of heavy metals.
We also thank the Lake Victoria North Water Services Board and Lake Victoria South Water Services Board for making sampling exercise possible. We also acknowledge the Department of Biological Sciences, Masinde Muliro University of Science and Technology for Fish taxonomy Studies.