Journal of Plant Biochemistry & Physiology
Open Access
ISSN: 2329-9029
ISSN: 2329-9029
Research Article - (2014) Volume 2, Issue 2
Numerous transparent testa (tt) or tannin deficient seed (tds) mutants have been isolated in the model plant Arabidopsis thaliana. These mutants are characterized by a reduction or lack of proanthocyanidins in the testa, resulting in pale brown or yellow seeds. Among the tt mutants, all the corresponding genes have been cloned except for tt9 and 13. As a first step towards determining the identity of the tt9 locus, fine scale genetic mapping was carried out using a mapping population resulting from a cross between tt9 plants in the Landsberg erecta (Ler) ecotype background with wild-type Columbia (Col) plants. Several simple sequence length polymorphism markers were developed, and a large population of plants was analyzed. Extensive analysis of this mapping population suggests the tt9 locus is found in a 140,000 base pair region on chromosome three. According to the TAIR 10 genome release for Arabidopsis, there are thirty-four genes in this region. Several approaches were utilized in an effort to identify which of these genes is the TT9 locus, including sequencing of candidate genes, comparison of steady-state mRNA levels of candidate genes in the parental line and the tt9 mutant, and analysis of T-DNA tagged lines. However, the TT9 locus has not yet been identified based on any of these analyses. This suggests that the mutation of interest may lie in a non-coding region of a candidate gene, in a micro-RNA, or other as-yet-unannotated gene in the mapping interval. The fine-scale mapping described here will facilitate future efforts to identify a definitive causative mutation in this elusive locus, for example, by whole genome sequencing.
Keywords: Transparent Testa (tt); Proanthocyanidins (PA); Flavonoids
Flavonoids are an important class of plant secondary metabolites derived from phenylalanine via the general phenylpropanoid pathway and from malonyl-coenzyme A (CoA), a product of the fatty acid pathway. There are several different subclasses of flavonoids playing varied roles in plant physiology, including protection from UV light, serving as feeding deterrents, acting as antimicrobials, and playing roles in seed coat physiology (reviewed in [1-3]).
Flavonoids, in particular the proanthocyanidins (PAs) or condensed tannins (CTs), have been shown to harden the seed coat, thus acting as a mechanical barrier against imbibition damage and radicle protrusion, both of which protect against premature germination [4]. Investigation of mutants lacking PAs in the seed coat has offered further confirmation for the role of these compounds in contributing to seed-coat imposed dormancy as well as of their important role in maintaining seed viability during storage [4]. While many genes involved in PA synthesis have been identified and much has been learned about their transport, there remain ambiguities about the precise mechanisms involved in their polymerization and transport into the plant vacuole (reviewed in [5]).
Numerous mutants defective in the synthesis and/or accumulation of PAs within the seed coat, which give wild type seeds their brown color, have been isolated in Arabidopsis thaliana (overview in [2]). The transparent testa(tt) mutants, named for their characteristic lack of, or diminished, pigmentation in the seed coat, make up one of the major classes of mutations affecting PA synthesis in Arabidopsis. Among the genes identified by the tt loci are several structural genes encoding enzymes necessary for flavonoid synthesis or accumulation, as well as genes involved in signal transduction, regulation of transcription, or transport into the vacuole. Of the seventeen distinct tt mutants that have been described, the genes corresponding to two of these loci (tt9 and tt13) remain to be identified. The goal of the present study was to characterize the Arabidopsis TT9 locus. To date only one allele has been described, which was generated by EMS mutagenesis in the Ler background [6,7]. tt9 bears similarity to tt6, tt7, and tt10, in that it has pale brown seeds, indicating reduced levels of PAs in the testa. However, tt9 seeds are unique in having a grayish-brown, rather than pale brown color, and among the tt mutants exhibit the most extensive reduction in size and weight relative to wild type [4]. The tt9 mutation does not affect the accumulation of flavonols and the phenotype is largely limited to seeds, although tt9 seedlings and leaves also have somewhat reduced levels of anthocyanins. Unlike many other tt mutants, however, tt9 seeds do not exhibit reduced dormancy compared to wild-type, but tend to germinate less efficiently [4]. This suggests that TT9 has a role in later steps of flavonoid metabolism, either in proanthocyanidin synthesis or polymerization, or in the transport and/or deposition of these compounds. It is also possible that TT9 is a regulator of one or more of these processes. We report here the fine-scale genetic mapping of the TT9 locus, as well as a detailed analysis of candidate genes within the mapping interval.
Plant Materials and Growth Conditions
Unless otherwise noted, seeds were suspended in 0.1% agarose without prior sterilization and stratified in the dark at 4°C for 2-4 d in order to break dormancy and synchronize germination. Seeds were sown in moistened potting media (Scotts Metro Mix 360) in individual baskets (AraSystem, Lehle Seeds) and cultivated under controlled conditions in a growth chamber set to 20°C and 70% relative humidity under continuous white light. Seeds harvested in this lab were placed, unless otherwise noted, at 4°C for long-term storage.
Genetic Mapping of the TT9 Locus
A mapping population was previously generated in this lab by crossing a tt9 plant in the Landsberg erecta (Ler) ecotype background with a wild type plant in the Columbia (Col) background. Plants from the F1 generation were allowed to self-fertilize and the resulting seeds were routinely stratified and sown as described above. Tissue was collected from rosette leaves of all plants approximately four to five weeks after germination and stored at -70°C.
DNA was isolated from tissue harvested from all the plants which were scored tt9 (based on lighter seed color). The tissue was ground in a cetyltrimethylammonium bromide (CTAB) buffer [2% (w/v), 1.4 M NaCl, 0.2 % (v/v) 2-mercaptoethanol, 20 mM EDTA and 100 mM Tris, pH 8.0] and incubated at 65°C for 30 min, followed by extraction with chloroform:isoamyl alcohol (24:1), and precipitation of nucleic acids with isopropanol [8]. Precipitated DNA was washed with 70 percent ethanol and re-suspended in Tris-EDTA buffer (10 mM Tris, 1 mM EDTA) to stabilize the DNA for long term storage, generally at -20°C. An alternative DNA isolation procedure was employed to facilitate rapid analysis of all F2 progeny (phenotypically wild type and tt9). In this case, DNA was isolated from fresh leaf tissue by grinding in 0.5 M NaOH (approximately 1 μl per 1 mg leaf tissue), boiling for 30 sec and neutralizing the base by adding Tris-EDTA buffer (20 mM Tris, 1.2 mM EDTA) in a 10:1 ratio of buffer to NaOH.
Mapping lines were scored Col, Ler, or heterozygous (het) at 8.62, 10.52, 10.58, 10.64, 10.67, 10.72, 10.78 and 11.1 Mb on chromosome three using PCR-based molecular markers. PCR was carried out using primers designed to amplify regions containing polymorphic loci (Table 1). All reactions involving simple sequence length polymorphism (SSLP)-based markers were carried out with an initial denaturing step at 94°C for 30 sec followed by 35 cycles of 30 sec at 94°C, 30 sec at the appropriate annealing temperature (Table 2) and 60 sec per 1000 bp product length at 72°C. The conditions for derived cleaved amplified polymorphic sequence (dCAPS)-based markers differed only in that the first ten cycles were carried out at a lower (2-4°C) annealing temperature to account for the mismatched nucleotide(s) in one of the primers. The products of the PCR were separated according to size by electrophoresis in 3-3.5% (w/v) agarose/TBE (0.09 M boric acid, 0.09 M Tris, and 0.1 M EDTA) gels stained with ethidium bromide (0.5 μg/ ml) and scored against Col, Ler, and heterozygous controls. In the case of the dCAPS markers, prior to separation by electrophoresis, PCR products were also digested with the appropriate restriction enzyme (Table 2) using 1-5 units enzyme per 20 μl PCR reaction with additional enzyme buffer at a 1X concentration (Table 2) in a 40 μl total volume and incubating at 37°C for a minimum of 4 h.
| MarkerName | Type | Nucleotide Sequence1 | ProductSize2 | ||
|---|---|---|---|---|---|
| ForwardPrimer | ReversePrimer | Col | Ler | ||
| MKP8.62 | SSLP | GATACACTCCTTTGTACGC | CAACATTGGCGGCATTGC | 234 | 222 |
| 10.12NdeI | dCAPS | AATTTTATTTATTCCTGACATA | CTACTTACTATTCAACGTC | 179 | 199 |
| 10.52EcoRV | dCAPS | ACCGACTCCATCATGTT | TTAATTTTTAATAACCAGATAT | 181 | 198 |
| 10.58Seq | Seq/SSLP3 | TGCAAACTGTGGATGATGC | TTTGAACCAAGCACTAATGC | 528 | 572 |
| 10.64DdeI | dCAPS | AAGGTTCTCTCCTCTTG | GTAAAGTGAATAAACACTTA | 221 | 204 |
| 10.67DpnI | dCAPS | AGCTATGGGAGCTTCGTGAT | AGAATTGGAGGTCGACATCC | 220 | 201 |
| 10.72Seq | Seq | TTTGATACCTAGATTATGACG | GATCAATCCGAACACATGC | 439 | 439 |
| 10.78DdeI | dCAPS | ATTCACTGTTTATGTCGC | TTCGATTTCTCATATTCTAA | 225 | 209 |
| MKP11.1 | SSLP | CTTCCAAACATCAAAGCCG | TGCAGCAGGATAGGTTGG | 247 | 184 |
1Underlined nucleotides in the dCAPS primer sequences indicate mismatched nucleotides designed to incorporate a restriction endonuclease recognition sequence into the amplicon derived from either the Ler or the Col allele, depending on the particular primer set.
2Expected size in bp following digestion with the appropriate endonuclease (indicated in the primer name).
3The 10.58Seq marker was originally defined as a sequence-based marker; however, a large insertion/deletion was detected that was not published in the Monsanto Polymorphism Collection, which allowed this marker to be used as an SSLP marker. Abbreviations: SSLP = Simple Sequence Length Polymorphism; dCAPS = derived Cleave Amplified Polymorphic Sequence; Seq = Sequencing.
Table1: Primer Sequences and Product Sizes for Molecular Markers Developed for Mapping TT9.
| Marker | TA1 | TA1 # Cycles | TA2 | TA2 # Cycles | Restriction Enzyme (Allele Cut) | Restriction Enzyme Buffer |
|---|---|---|---|---|---|---|
| MKP8.62 | 56 | 35 | NA | NA | NA | NA |
| 10.12NdeI | 50 | 10 | 52 | 25 | NdeI(Col) | D |
| 10.52EcoRV | 48 | 10 | 50 | 25 | EcoRV(Col) | D |
| 10.58Seq | 56 | 35 | NA | NA | NA | NA |
| 10.64DdeI | 48 | 10 | 50 | 25 | DdeI(Ler) | D |
| 10.67DpnI | 56 | 10 | 60 | 25 | MboI(Ler) | C |
| 10.72Seq | 56 | 40 | NA | NA | NA | NA |
| 10.78DdeI | 48 | 10 | 50 | 25 | DdeI(Ler) | D |
| MKP11.1 | 56 | 35 | NA | NA | NA | NA |
TA = annealing temperature
NA= not applicable
Table 2: Reaction Conditions for Mapping.
RNA Expression Analysis of Candidate Genes
Siliques were harvested from wild-type Ler or tt9 plants into liquid nitrogen and stored at -70°C until analyzed. RNA was extracted from 30-60 mg of silique tissue using the SV Total RNA Isolation System (Promega) according to the manufacturer’s recommendations, and quantified spectrophotometrically. RNA expression was assayed for nine genes located within the region containing tt9 as well as for CHS, ANR/BAN and LAC15 (TT10), using real time PCR. Ler and tt9 cDNA was synthesized using a Bio-Rad iScript™ cDNA synthesis kit (Bio-Rad) which includes oligo (dT) and random hexamer primers. The reactions were carried out according to the manufacturer’s recommendations using 500 ng Ler or tt9 RNA as template. real-time PCR was carried out in a Bio-Rad MiniOpticon Thermal Cycler using iQ™ SYBR® Green Supermix (Bio-Rad) according to the manufacturer’s recommendations. The reactions were assembled in replicates of three using gene-specific primers (Table 3). The RT-PCR program consisted of an initial denaturing step at 94°C for 3 min followed by 40 cycles of 30 sec at 94°C, 30 sec at 56°C and 1 min 15 sec at 72°C. The fluorescence signal was measured after each annealing step and each extension step. The resulting data were analyzed with the Opticon Monitor 3 Software to determine average threshold cycle. Relative expression was determined using the ΔΔCt method using CHS expression as a reference. Reaction specificity was determined by melting curve analysis and by separating the reaction products by electrophoresis in 1% agarose/TBE gels stained with ethidium bromide.
| GeneName | Primer1(For) | Primer2(Rev) | ProductSize(bp) | |
|---|---|---|---|---|
| cDNA | Geno-mic | |||
| AT3G28345 | GTATGGTTGCATAAGCGC | TAAACGTCTCGAACAAAGC | 797 | 870 |
| AT3G28360 | CGGATGGTTATGAACTATG | TCGGTGATTTGATTAACGC | 731 | 883 |
| AT3G28380 | TGCATCACATATGGAGGC | TTGGTGACTTGATTATCGC | 640 | 816 |
| AT3G28390 | GGATGGTTATGAACCATG | CACAATAGTTGTACGACC | 797 | 966 |
| AT3G28415 | TTGAAGGCTCAGTGAAGC | TGTACGACCAATAGTGGC | 850 | 1003 |
| At3g28420 | ATTTCGTATAAGAATCGATCG | AAACGAAGCCAAAGAACGAA | 790 | 790 |
| At3g28450 | TTGACGAGGATTTCGATGC | AAGTAGTACAAGATGATATAG | 582 | 582 |
| At3g28460 | TCCTGGAACGTGCTGATA | AGCTCTTCAGTCACAGTCT | 358 | 617 |
| AT3G28470 | CCTTGTTGTGACAAGTCC | TGACATGTTCCCGAGGC | 830 | 1020 |
Table 3: RT-PCR Primers.
T-DNA Tagged Lines
T-DNA insertion lines for the genes within the mapped interval were found using the Salk Institute Genomic Analysis Laboratory (SIGnAL) T-DNA Express database. All T-DNA tagged lines were obtained from the Arabidopsis Biological Resource Center (ABRC, Columbus, OH). Salk lines belong to the SIGnAL Salk insertion collection and were generated by vacuum infiltration of Col plants using Agrobacterium containing the pROK2 vector [9]. SAIL lines belong to the SAIL insertion collection and were generated by vacuum infiltration of Col plants using Agrobacterium containing either pCSA110 or pDAP101 [10]. Seeds for 21 T-DNA tagged lines harboring insertions in one of 34 candidate genes within the mapping interval were obtained from the Arabidopsis Biological Resource Center (ABRC, Columbus, OH). Approximately 20 seeds from each line were cultivated as described above. Plants were scored on the basis of seed-coat color by comparison with wild-type and tt9.
Fine-Scale Mapping of the TT9 Locus
The tt9 locus was previously mapped by linkage analysis to the vicinity of gl1 on chromosome III [7]. In order to carry out fine-scale mapping, a cross was carried out between the tt9 line (Ler background) and the Columbia wild-type. The mapping population from this cross (the F2 plants) exhibited a 3:1 ratio of plants producing brown seeds versus those exhibiting the tt9 phenotype, as expected for a phenotype caused by a single recessive allele. The initial analysis showed sixty-one wild-type plants and twenty-two tt9 plants, a ratio that does not deviate significantly from 3:1.
Several simple sequence length polymorphism (SSLP) and derivedcleaved amplified polymorphism (dCAP) markers were designed based on differences between the Col sequence available at TAIR and the available Monsanto Ind/Del database [11,12] (see Materials and Methods). Genetic mapping was carried out in this experiment in two phases. The locus was first narrowed to a region of approximately 580 kb, between 10.52 Mb and 11.1 Mb on chromosome III. This was accomplished by analysis of approximately 150 tt9 lines from approximately 500 F2 progeny of the tt9, Col cross. Rapid screening was then carried out of more than 700 additional F2 plants, both wild-type and mutant, by identifying lines heterozygous for the marker at either 10.52 Mb or 11.1 Mb. These plants were grown to maturity and scored for seed coat color. F2 plants producing brown seeds were carried out to the F3 generation to determine whether they were heterozygous or homozygous wild type at the TT9 locus.
All of the recombinant lines were then further analyzed using five additional markers between 10.52 and 11.1. Based on the analysis of approximately 1200 plants, the TT9 locus was located to the interval between 10.58 Mb and 10.72 Mb on chromosome three (Table 4). Given the number of plants analysed at the molecular level, and that two recombinants were identified at the two markers located at 10.58 and 10.72 Mb, our data strongly suggests the TT9 locus lies within this interval.
| Marker | 10.52 | 10.58 | 10.64 | 10.67 | 10.72 | 10.78 | 11.1 |
|---|---|---|---|---|---|---|---|
| Recombinants betweenmarkerandTT9 | 13 | 2 | 0 | 1 | 2 | 7 | 41 |
| TotalMappingPlantsAnalyzed | 797 | 794 | 797 | 797 | 785 | 787 | 797 |
1The total number of plants analyzed is based on the number of plants that were either physically scored at the given marker, or for which the genotype could be reasonably deduced based on the genotype at adjacent markers. The variation in the number of plants analyzed is due to some plants dying without setting seed or before subsequent analysis could be undertaken.
Table 4: Fine-Scale Mapping of the tt9 Mutation1.
Analysis of Candidate Genes within the Mapping Interval
The mapping data presented above strongly suggest that TT9 is located on chromosome three between genes At3g28315 (TEPseudogene) and At3g28590 (Unknown Protein). The interval defined by these two markers contains 34 putative genes; including a cluster of genes annotated as encoding P-glycoprotein ABC transporters and a second cluster of AAA-type ATPase family proteins. The interval also contains a number of predicted enzyme-encoding genes, including a methyltransferase and two oxoglutarate-dependent oxygenases, and several potential transcriptional regulators (Table 5).
| Gene | Annotation | Expression1 | Line# | tDNAsite | Confirmation | |
|---|---|---|---|---|---|---|
| Hom2 | Seq3 | |||||
| At3g28315 | TEPseudogene | NA | None | NA | NA | No |
| At3g28320 | Expressedprotein | 23.13 | SAIL_674_D06 | Exon1/1 | Yes | Yes |
| At3g28321 | UnknownEndomembraneSystemProtein | NA | None | NA | NA | No |
| At3g28330 | F-boxfamilyprotein | 24.35 | SAIL_562_E07 | Exon2/2 | Yes | No |
| At3g28340 | Galactinolsynthase | 82.06 | SALK_072808 | 5’UTR | Yes | No |
| At3g28345 | ABCTransporter | 39.1 | SAIL_177_A01 | Exon7/7 | Yes | Yes |
| At3g28350 | UnknownProtein | NA | Salk_046193 | Exon8/9 | Yes | No |
| At3g28360 | PGP16InvolvedinMembrane Transport | 106.26 | SALK_148699 | Exon5/7 | Yes | Yes |
| At3g28370 | Hypotheticalprotein | NA | SALK_127144 | Exon2/11 | Yes | No |
| At3g28380 | PGP17InvolvedinMembrane Transport | --- | Salk_002801 | Exon6/7 | Yes | No |
| At3g28390 | PGP18InvolvedinMembrane Transport | --- | Salk_013774 | Exon5/7 | Yes | No |
| At3g28400 | hAT-like transposase | --- | NA | NA | No | No |
| At3g28410 | F-boxfamilyprotein | --- | SAIL_905_D05 | Exon3/3 | Yes | No |
| At3g28412 | TransposableElementGene | NA | None | NA | NA | No |
| At3g28415 | ABCTransporter | NA | SAIL_875_C09 | 3’UTR | Yes | Yes |
| At3g28420 | PutativeMembraneLipoprotein | 29.8 | SALK_064362 | Promoter | Yes | No |
| At3g28430 | Expressedprotein | 70.25 | SAIL_289_G06 | Exon1/21 | No | No |
| At3g28440 | UnknownEndomembraneProtein~30aa | NA | None | NA | NA | No |
| At3g28450 | Leucine-rich repeat,tmproteinkinase | 108.36 | SALK_111477 | Exon1/1 | No | No |
| At3g28455 | Clavata-3Homologue | --- | None | NA | NA | No |
| At3g28460 | MethylTransferase | 112.61 | Salk_012168 | Exon2/8 | Yes | No |
| At3g28470 | R2R3familyTF | --- | None | NA | NA | Yes |
| At3g28480 | OxoglutarateandIronDependentOxygenase | 172.55 | SALK_004421 | Exon2/8 | No | Yes |
| At3g28490 | OxoglutarateandIronDependentOxygenase | --- | none | NA | NA | Yes |
| At3g28500 | 60Sacidicribosomalprotein | 1857* | none | NA | NA | No |
| At3g28510 | P-LoopNucleosideTriphosphateHydrolaseSuperfamily | --- | Salk_145575 | Exon1/1 | Yes | No |
| At3g28520 | P-LoopNucleosideTriphosphateHydrolaseSuperfamily | 24.2 | Salk_097795 | Exon1/1 | Yes | No |
| At3g28530 | UDPGlucose-4-Epimerase | 50.36 | None | NA | NA | Yes |
| At3g28540 | P-LoopNucleosideTriphosphateHydrolaseSuperfamily | --- | None | NA | NA | Yes |
| At3g28550 | Prolinerichextension-like family | --- | None | NA | NA | No |
| At3g28560 | AAA-typeATPase | --- | SAIL_805_E02 | Exon1/1 | No | No |
| At3g28570 | P-LoopNucleosideTriphosphateHydrolaseSuperfamily | NA | SALK_007203 andSALK_076105 |
Exon1/1 | Yes | No |
| At3g28580 | P-LoopNucleosideTriphosphateHydrolaseSuperfamily | --- | Salk_031517 | Exon1/1 | Yes | No |
| At3g28590 | UnknownProtein | --- | None | NA | NA | No |
1The values listed represent the highest value found in seeds with or without siliques at various developmental stages. Samples listed as not available (NA) were not found in the database, while those listed as “—“ had levels of expression below what is considered background (20 expression units).
2Indicates whether lines were confirmed homozygous for the tDNA insertion
3Indicates whether the coding region was sequenced
Table 5: Summary of Candidate Genes.
In Silico Wild-type RNA Expression Analysis
Because the primary defect in the tt9 mutant is a deficiency in PA synthesis and/or transport in the seed, our initial hypothesis was that the gene would be expressed in flowers, seeds and/or siliques. Wildtype RNA expression levels for the 34 genes found within the mapped interval containing TT9 were assessed in silico by using the eFP tool [13]. In analyzing the data in this manner, the software compares the expression of the input gene in a given tissue versus the average expression in all tissues. Of the 26 genes within the mapping interval for which these data were available, 13 were expressed above background levels in flowers, dry seed, stage 3, 4, or 5 seeds with siliques, or stages 6-10 seeds without siliques; (Table 5).
Co-expression of these candidates with genes known to be involved in PA synthesis was then assessed using ATTEDII [14-16] (Table 6). Using this approach, only one gene within the mapping interval (AT3G28360, encoding a predicted p glycoprotein, PGP16 involved in membrane transport) was found to exhibit a high degree of correlation with expression of other flavonoid genes, specifically those encoding the bHLH42 regulator, TT8, the laccase-like polyphenol oxidase, LAC15 (TT10), and anthocyanidin reductase (ANR/BAN), as well as lower correlation with expression of dihydroflavonol reductase (TT3), flavonoid 3’-hydroxylase (TT7), and the regulators, TTG2 and TT2. However, as described below, a homozygous T-DNA insertion in the 5th exon had no effect on seed coat color and sequencing revealed no differences in the coding region of this gene between tt9 and wild-type Ler.
| Gene | At5g35550R2R3MYB, MYB123, TT22 | At4g09820bHLH42 regulator, TT82 | At5g48100 laccase-like polyphenoloxidase, TT10 | At2g37260 AtWRKY44 transcription factor 2TTG2 | At1g61720 ANR/BAN | At5g42800 DFR/TT3 | At5g07990 F3'H/TT7 | At5g66220, CHI2 | At5g08640, FLS1 | At5g63580, FLS2 | At5g63600,FLS5 | At5g 23260 MADS box protein, PAbiosynthininner most cell layer of seed coat, TT16 | At1g17260 H+-APTase gene family,involved in PAbiosynthesis, AHA10 | At3g59030 PA-specific MATE transporter, TT12 | At5g17220GSTF12,PA- specific, TT19 |
|---|---|---|---|---|---|---|---|---|---|---|---|---|---|---|---|
| At3g28320 | * | * | * | * | * | * | * | * | * | * | * | * | * | * | * |
| At3g28330 | * | * | * | * | * | * | * | 259.5 | * | * | * | * | * | * | * |
| At3g28340 | * | * | * | * | * | * | * | * | * | * | * | * | * | * | * |
| At3g28345 | * | * | * | * | * | * | * | * | * | * | 999.1 | * | * | * | * |
| At3g28360 | 431.2 | 80.6 | 38.5 | 283.8 | 134.5 | 424.8 | 986 | * | * | * | * | * | * | * | * |
| At3g28420 | * | * | * | * | * | * | * | * | * | * | * | * | * | * | * |
| At3g28430 | * | * | * | * | * | * | * | * | * | * | * | * | * | * | * |
| At3g28450 | * | * | * | * | * | * | * | * | * | * | * | * | * | * | * |
| At3g28460 | * | * | * | * | * | * | * | * | * | * | * | * | * | * | * |
| At3g28480 | * | * | * | * | * | * | * | * | * | * | * | * | * | * | * |
| At3g28500 | * | * | * | * | * | * | 338.1 | * | 775 | 120.2 | * | 660.9 | 956.1 | * | * |
| At3g28520 | * | * | * | * | * | * | * | * | * | * | * | * | * | * | * |
1 analysis was performed using ATTED II and include those genes ranging from At3g28315 and At3g28590 for which microarray data are available; flavonoid genes specific for proanthocyanidin biosynthesis that are co-regulated with at least one gene in the mapping interval are included in the table
2A ternary complex composed of TT2, TT8, and TTG1 has been proposed to regulate BAN expression in the seed endothelium; TTG1 is not tissue-specific and was therefore not included in this analysis. *MR not significant; PA, proanthocyanidin
Table 6: Co-expression of genes annotated in the TT9 mapping interval with known flavonoid regulatory or structural genes.
Co-expression was also analysed using GeneMANIA [17]. None of the genes in the interval were among the top 100 hits obtained when searching against all 144 co-expression networks using the proanthocyanidin-specific TT2, TT10, TT12, TT16, TT19, and AHA10 genes (encoding a R2R3 Myb regulator, laccase-like polyphenol oxidase, MATE transporter, MADS box protein, glutathione S-transferase, and H+ ATPase, respectively). In searches with individual genes from the mapping interval, only At3g28480 appeared to be co-expressed with any known flavonoid genes. Specifically, expression of this gene was associated with that of anthocyanidinsynthase and the pseudogenes, FLS2, FLS4, and FLS6 in the GeneMANIA analyses, albeit with very low scores (0.02-0.03). No homozygous knockouts could be recovered for this gene, however, so this remains a possible, although not strong, candidate for TT9.
T-DNA Insertion Lines
In a complementary approach in assessing candidate genes within the mapping interval, we performed phenotypic analysis of mutations in the 13 candidate genes, as well as eight others within the mapping interval, for which T-DNA insertion lines were available. These tagged lines were identified using the T-DNA Express Arabidopsis Gene Mapping Tool [9]. It was expected that any line homozygous for a T-DNA insertion in an exon of a candidate gene would knock out the function of that gene. Therefore, any lines confirmed as homozygous for the T-DNA that also produced pale brown seeds would indicate TT9 function had been abolished. T-DNA tagged lines were obtained from the Arabidopsis Biological Resource Center (ABRC, Columbus, OH). Individual plants from the pooled lines were genotyped with regard to the T-DNA insertion. Although seventeen lines homozygous for T-DNA insertions were identified, all produced wild-type brown seeds indicating that none of these genes correspond to TT9 (Table 5).
Real-Time Reverse Transcription PCR
Real-time reverse-transcription PCR was carried out on several genes within the mapping interval, as well as three established flavonoid genes, encoding chalcone synthase (CHS), anthocyanidinreductase (ANR/BAN), and the laccase-like polyphenol oxidase, LAC15 (TT10), to assess whether steady-state RNA levels were altered in the tt9 mutant as compared to Ler in siliques. While it was hoped that this analysis might reveal one or a few candidate genes within the mapping interval that was under-expressed in the tt9 mutant as compared to wild type, this was not the case. We did, however, detect an increase in At3g28480 expression and a decrease in ANR/BAN expression in two independent RNA samples from siliques (Figure 1).
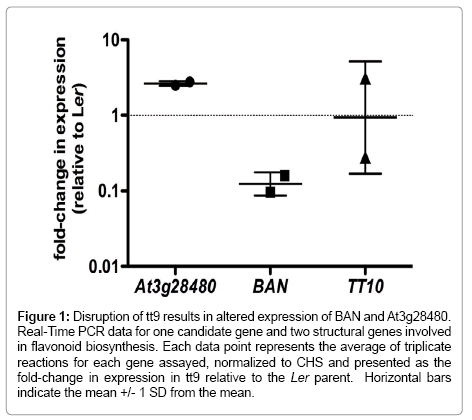
Figure 1: Disruption of tt9 results in altered expression of BAN and At3g28480. Real-Time PCR data for one candidate gene and two structural genes involved in flavonoid biosynthesis. Each data point represents the average of triplicate reactions for each gene assayed, normalized to CHS and presented as the fold-change in expression in tt9 relative to the Ler parent. Horizontal bars indicate the mean +/- 1 SD from the mean.
Sequencing of Candidate Genes
Prior to or concurrent with the experiments described above, the coding regions of ten candidate genes were sequenced in order to determine if there were differences between the tt9 sequence as compared to wild-type (Table 5). These included six candidates for which a homozygous knock-out line could not be obtained (At3g28470, 480, 490, 500. 530.540). Sequences were also obtained for four genes for which homozygous insertions did not appear to affect seed color, but the genes were potential candidates based on expression patterns or other criteria (At3g28320, 345, 360, 415, 500). The entire coding region of each gene was amplified from genomic DNA and the resulting PCR products were sequenced directly on both strands. In cases where there was a difference between the sequence of a candidate gene amplified from tt9 plants versus the published sequence for Col, this was confirmed by amplifying and sequencing the relevant portion of the Ler genome and/or comparing with the Ler-1 sequence available at http://1001genomes.org/. No differences were found between tt9 and the parental Ler-1 sequence in any of the nine candidate genes
In the past few decades, genetic analysis in Arabidopsis has resulted in a much deeper understanding of flavonoid metabolism (reviewed in [3,7,18]). Despite our current understanding, there remain ambiguous points for which further characterization of mutants in this pathway may potentially offer significant insight. One of the few Arabidopsis mutants not yet characterized at the molecular level is the tt9 locus. In the current study, this locus was mapped to a 140 kb region on chromosome three. This represents the first new progress in the effort to identify the gene corresponding to the TT9 locus since low-resolution mapping was described 19 years ago [7].
Several methods were employed to assess the likelihood of a particular gene in this interval being the TT9 locus. Seventeen of the thirty-four genes in the mapping interval can be tentatively ruled out since homozygous exon-tagged lines have wild-type seed color (Table 2). While it is possible that insertion of T-DNA into non-coding regions such as promoters, UTRs or introns will not affect the phenotype of the resulting plants, we have observed other situations in which insertions in non-coding regions resulted in a transparent testaphenotype [19]. Another nine candidate genes within the mapping interval are considered unlikely to correspond to the TT9 locus based on either analysis of the DNA sequences from the tt9 mutant or based on in silico expression data suggesting the gene is not expressed in flowers, siliques, or seeds. Neither of these methods provides as strong a filter for the candidate genes as do the T-DNA tagged lines, as mutations in non-coding regions would not have been detected by our sequencing. Furthermore, it is possible that a transcript expressed at low levels could be responsible for TT9 function, or that the TT9 mRNA is produced and translated prior to seed development.
Only five annotated genes within the mapping interval could not be ruled out as candidates for TT9 based on analysis of tagged lines, sequence data, or expression patterns. These genes are At3g28315 (TE pseudogene), At3g28321 (unknown endomembrane protein of 48 amino acids), At3g28412 (transposable element), At3g28440 (unknown endomembrane protein of 43 amino acids), and At3g28550 (proline rich extensin-like family).
It is interesting to note that based on the coexpression data obtained at ATTED-II [14], only At3g28360 was co-expressed with other flavonoid genes (TT8, TT10, and ANR). Since this gene is co-expressed with other genes known to be involved in the pathway, is annotated as an ATP-powered pump that couples ATP hydrolysis to the trans membrane transport of substances, and has the appropriate expression pattern for TT9, in many ways, it is an ideal candidate. However, we analyzed five independent homozygous exon-tagged lines, and all were found to have seeds with normal color. Furthermore, we sequenced the entire coding region of this gene as well as about 800 bp of 5’ sequence, and found it to be identical to the Ler parent.
It is also noteworthy that the tt9 plant consistently accumulated lower steady-state levels of ANR/BAN mRNA in siliques (Figure 1). This might suggest that TT9 encodes a transcription factor that impacts ANR expression. While there is a transcription factor present in the mapping interval (At3g28470), we have sequenced the coding region of this gene from tt9 and found it to be identical to the parental line. In addition, real-time RT-PCR using RNA isolated from siliques indicated no difference in steady-state mRNA levels between Ler and tt9 (data not shown). Taken together, these data suggest this locus is an unlikely candidate for TT9. While we had hoped that expression analysis of genes within the mapping interval would lead to a single, clear candidate gene, it is well known that some mutations in flavonoid pathway genes have no impact on steady-state mRNA levels (e.g., [19])
It is also intriguing that At3g28480 is overexpressed in tt9 as compared to Ler (Figure 1). This gene encodes a putative oxidoreductase, a class of enzymes that functions in diverse metabolic pathways including flavonoid metabolism. One possibility is that a mutation in At3g28480 results in overexpression and diversion of flux away from PA biosynthesis. It also is possible that the adjacent putative oxidoreductase gene, At3g28490, is TT9, and that disruption of its function leads to a compensatory increase in At3g28480.
Progress has been made toward identifying the gene corresponding to the TT9 locus by gene mapping, analysis of T-DNA tagged lines, sequencing of coding regions, and analysis of steady-state RNA levels. It was previously shown that levels of flavonols and anthocyanins in tt9 are at or near wild type levels, suggesting that tt9 functions primarily in proanthocyanidinbiosynthesis [7]. However, none of the thirty-four candidate genes in the mapping interval could be identified with the tt9 phenotype, although several still merit further investigation. It is also quite possible that microRNA or other extragenic element may be responsible for the phenotype. Whole-genome sequencing, with bioinformatics analysis guided by our mapping data, is therefore now being undertaken in an effort to identify a definitive causative mutation, which will then be confirmed via complementation of the tt9 mutant.
The authors would like to acknowledge the many Houghton College undergraduate students who worked on this project. These include, in alphabetical order, Heather Anderson, Sarah Bliss, Grace Essley, Tim Haffey, Susan Kelly, Blair MacDonald, Lucas Prime, Keisha Shaut, and Emily Smithers. Houghton College provided financial support for this research, in particular through the Moreland Research Professor Endowment. We also thank Peter Bowerman of Virginia Tech for contributions to this work.