Journal of Ergonomics
Open Access
ISSN: 2165-7556
ISSN: 2165-7556
Research Article - (2013) Volume 3, Issue 3
Keywords: Driver fatigue; Smartphone; Computer vision; Fatigue detection; Driving simulation
Driver fatigue is one of the main causes of traffic crashes. Each year, 100,000 police-reported crashes were directly caused by driver fatigue, which resulted in about 1,550 deaths, 71,000 injuries, and $12.5 billion financial losses, according to estimation of the National Highway Traffic Safety Administration (NHTSA, 2005). Driver fatigue was involved in 1.2% to 1.6% of all police-reported crashes and 3.2% of the fatal crashes in the United States (Knipling & Wang, 1995; NHTSA, 1996). The National Sleep Foundation estimated in 2002 that 51% of adult drivers had driven a vehicle while drowsy and 17% had fallen asleep behind the wheel.
These traffic-related deaths and financial losses have encouraged the development of technologies to mitigate the risks of driver fatigue. Researchers often used vehicle-mounted cameras and laptop computers to detect and monitor driver fatigue. Indicators of fatigue include the movement of driver’s face, eye blink rate, head nod, and yawn of mouth etc. [1,2]. Another approach is to use electrophysiological signals to detect driver fatigue [3]. The relative powers of EEG signals, for example, (α+β)/θ, α/ β, (θ+ α)/ (α+β) and θ/ β, are indicative of driver fatigue [4]. However, both the camera-based and EEG-based solutions require drivers to purchase special equipment, which limits the popularity of these fatigue detection technologies. A more technically feasible and financially practical solution is to build the fatigue detection technology using smartphones. As of 2012, as many as 45% of American adults owned a smartphone [5]. The computational powers of smartphones keep increasing, which allows the computer vision algorithms to run reasonably fast in smartphones. A smartphone-based fatigue detection technology would be more portable and affordable than many alternative fatigue detection systems, which use devoted invehicle cameras or EEG sensors [6].
The proposed system in this paper uses a smartphone (either an Android smartphone or an iPhone) as a driver fatigue detection system. The front camera of a smartphone captures images of the driver, and then feeds the images to the CPU of the smartphone for image processing. Intel’s open-source computer vision framework, the OpenCV 2.3 for the Android and iOS operating system, is used to develop the computer vision algorithms for face detection and eye detection.
A simulated driving study was also carried out to describe the visual indicators of drowsy driving. In the rest of the paper, section 4 describes the algorithms for fatigue detection; section 5 describes the battery performance of smartphones; section 6 describes a simulated driving study, reporting visual indicators of drowsy driving. Discussions about the potential application and future studies are described in section 7.
Equipment and platform
The algorithms were developed for both the Android and iPhone. A Samsung Galaxy Note and an iPhone 4s were used in the development. The Samsung Galaxy Note Android smartphone was first released in late October 2011 and was available in North America in February 2012. The smartphone runs the Android 2.3.6 operating system with the kernel 2.6.35.11. The smartphone has a CPU of 1.4 GHz dualcore ARM Cortex-A9 (GT-N7000), with 1 GB RAM memory. The battery is Li-ion 2500 mAh. The front camera has 2M pixel resolution.
The iPhone 4s was released in October 2011. The iPhone 4s has an 800MHz dual-core ARM Cortex-A9 CPU with 512 MB memory. The iPhonehad a non-removable Li-Po 1432 mAh battery. The camera of the iPhone was 8 million pixels with a resolution of 3264x2448 pixels.
The computer vision algorithms were implemented using the Java programming language and the OpenCV 2.3 computer vision framework for the Android. The OpenCV framework was developed and released under a BSD license by Intel and freely available for both academic and commercial applications.
System setup
Figure 1 shows the setup of the proposed driver fatigue detection system in real-world driving. The smartphone can be mounted on the dashboard of a vehicle. The smartphone is placed horizontally with the front camera aimed towards the driver’s face.

Figure 1: The system setup of the driver fatigue detection system using a smartphone.
Algorithm framework
The fatigue detection algorithms are carried out in five steps. The first step is image preprocessing. Figure 2 depicts the algorithm framework for the driver fatigue detection system. Computer vision performance depends heavily on the image size, which is a great concern for smartphone applications considering the limited computational resources of smartphones. The second step is face detection. A face is located using Haar-like feature detectors. The third step is eye detection within the upper half of the detected face. The fourth step is blink detection by estimating the changes in black pixels within the eye regions. The fifth step is fatigue judgment.

Figure 2: The algorithm framework for the driver fatigue detection system.
Image preprocessing
The camera of the smartphone captures images at the resolution of 720×1280. The raw image is first reduced to a resolution of 180 × 320, a quarter of its original resolution. Then, the resized color image is converted to a grey image. Resized images and grey/color conversion can greatly reduce the amount of data that need to be processed, which makes the smartphone application run much faster.
Haar-like feature detector
A Haar-like feature detector is used for face detection and eye detection. The Haar-like feature detector using the AdaBoost algorithm is commonly used in face detections because it is fast and accurate [7,8].
A Haar-like feature detector considers adjacent rectangles at a specific region in a moving detection window. An image area can be described as the combination of different Haar-like features. The number and type of Haar-like features can be used to represent different objects. We define an accumulated sum of intensity from the origin as:
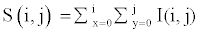
where I(i,j) is the intensity at the location (i,j), S(i,j) is the accumulated sum of intensity from origin at the location (i,j).
The sum of intensity of a rectangle in the image, defined as two points at (xleft, yup) and (xright, ydown), can be easily calculated as the following equation, which greatly speeds up the computation:
Sacc (xright,ydown) - Sacc (xleft,ydown)- Sacc (xright,yup)+ Sacc (xleft,yup)
Face detection
The face is detected using the Haar-like feature detector for faces [7,8]. The centroid of the face is then calculated and used to determine head nod and head rotation. A head nod is defined as a large velocity of the head centroid, with vertical velocity larger than horizontal velocity. A head rotation is defined as a large velocity change of the head centroid, with the horizontal velocity larger than the vertical velocity. An empirical value of 100 pixels per second is set as the velocitythreshold for the horizontal and vertical head movement.
Eye detection
The commonly used algorithms for eye detection include Hough transform, template matching, Principle Component Analysis (PCA), and the Adaboost algorithm. In this paper, the eye is detected with the Adaboost algorithm, using the Haar-like feature detector for eyes [7,8]. To improve computational efficiency, the search area for eyes is limited to the upper portion of the detected face. Figure 3 depicts the areas of interest for eye detection within a face.

Figure 3: Interest area for eye detection within a face. Wface is the width of the face area; Hface is height of the face area; Waoi is the width of the area of interest for eye detection; Haoi is the height of the area of interest for eye detection.
Horizontally, the eye area is between 1/6 to 5/6 of the face; vertically, the eye area is within 1/4 to 1/2 of the face. The width and height of the areas of interest for eye detection is determined by the following criterions:
Waoi = Wface × 1/4
Haoi = Hface × 1/3
Blink detection
An eye blink is detected using the change of black pixels in the eye region. An open eye will have a larger visible pupil than a blinking eye. The pupil is often darker than the color of the rest of the eye. Thus, an open eye should have more black pixels.
In the detected eye region, the eye image is converted to a binary image using image thresholding. Then, the ratio of black pixels in the binary image of the eye is calculated. The ratio of black pixels is used as the criterion for eye blinks. Figure 4 shows an example of an open eye and a closed eye, and their binary images after thresholding.

Figure 4: Demo for blink detection. (a) an open eye region; (b) binary image after thresholding of the image in (a); (c) closed eye region; (d) binary image after thresholding of the image in (c).
Fatigue detection
Three criteria are used to determine the state of driver fatigue, that is, the frequency of head nods and head rotationsand PERCLOS (Percent Eye Closed). A drowsy driver may exhibit frequent head nodsand eye blinks.
PERCLOS is another important and frequently used indicator of fatigue. PERCLOS is defined as the percent of time when the eyes are closed in a short time window (often 30s). An eye is treated as closed if the height of the visible pupil is smaller than 30% of its maximum opening.
In this paper, PERCLOS is calculated using the following equation:

where Nblink is the number of eye blinks in the recent 30 second time window. S is the sampling rate.
Figure 5 shows a screenshot of the Fatigue Sensing application in detection mode. It shows the development version of the application running in an iPhone 4s. Faces of drivers were not shown in order minimize potential visual distractions. The spinning ring in the center indicates the application is running. Users can set the parameters such as alert sound and volume in the Setting tab. Their frequencies of drowsiness report by time or by drives can be viewed in the Report tab.

Figure 5: Screenshot for the Fatigue Sensing application in detection mode.
Smartphone has limited battery. Thus, how long the smartphone can support the fatigue detection application is critical for fatigue monitoring while driving. Both Android and iPhone smartphones are tested for its battery performance when running thefatigue detection algorithm.
The Samsung Galaxy Note Android smartphone was tested with WiFi and 3G data enabled. The Task Manager application is used to log the battery consumption data. As shown in Figure 6, the Fatigue Sensing app in Android consumes about 23.76% of battery for one hour’s continuous use. The battery of a typical Android smartphone can last about 4.2 hours without charging.

Figure 6: Battery consumption of the Fatigue Sensing app in Samsung Galaxy Note-I running Android 2.3 operating system.
The iPhone 4s smartphone was tested with WiFi and 3G data enabled. The Battery Monitor was used to log the battery consumption data. As shown in Figure 7, the Fatigue Sensing app in iPhone consumes about 24.84% of battery for one hour’s continuous use. The battery of iPhone 4s can last about 4.02 hours without charging.

Figure 7: Battery consumption of the Fatigue Sensing app in iPhone 4s.
To evaluate the effectiveness of smartphone-based driver fatigue detection, a simulated driving experiment was carried out to explore the visual indicators of driver fatigue.
Participants
Twenty experienced drivers (8 females and 12 males) were recruited from the local community of Wichita, KS by online advertisements and posters.The average age of the participants was 24.95 years with a standard deviation of 3.72 years. All participants had a valid driver’s license for at least two years at the time of the experiment. They have held a driver license for 6.22 years on average with a standard deviation of 3.98 years. Their yearly mileage was 11605.88 miles with a standard deviation of 9129.11miles. All participants were well informed about the experiment and signed a consent form to participate in the experiment. Participants were thanked and reimbursed with 10$/hour for a two hour experiment.
Equipment and materials
The driving task was simulated using a desktop driving simulator. The driving simulator was consisted of a 39-inch Insignia LCD TV monitor, a Dell desktop computer, and anMC2 steering wheel and pedal. The TORCS driving simulator software running inthe Windows 8 operating system was used to create and simulate the driving task.
An iPhone 4s smartphone running the latest version of Fatigue Sensing application was mounted on the desktop of the driving simulator. The smartphone used computer vision algorithms to detect visual indicators of driver fatigue, including head nods, head rotations and eye blinks.
The Stanford Sleepiness Scale (SSS) and Karolinska Sleepiness Scale (KSS) were used to measure subjects’ self-perceived drowsiness at the beginning and ending of each drive session. The Stanford Sleepiness Scale is a 1-item measure of sleepiness in a given moment [9]. The Karolinska Sleepiness Scale [10] is a 1-item scale developed by the Karolinska Institute is a quick measure of “state” sleepiness. It measures how sleepy a person is in a given moment. Please refer to Appendix for the detailed information of the scales.
Driving task
A monotonous driving task with few road stimuli and lasted ninety minutes was designed to induce driver fatigue. The road was a twolane rural road. The driving task was a classic car following task [11-13]. Drivers were instructed to drive in the right lane, following a lead vehicle (Figure 8). The lead vehicle broke at random time intervals. Subject drivers were instructed to maintain a safe drive distance from the lead vehicle and brake when necessary.

Figure 8: The car following task.
Procedure
Participants were screened before the driving task. To qualify for the study, participants should have at least two years driving experience, with normal or corrected to normal vision ability, no medical contraindications, such as motion sickness, alcoholism, drug abuse, and psychological or intellectual problems likely to limit compliance. Participants were asked not to have caffeine and tea for 4 hours and alcohol for 24 hours before the study.
Upon arrival at the lab, participants were informed about the experiment, signed the consent form, and filled out a demographical information survey. Then participants practiced driving in the simulator for 10 minutes to get familiar with the hardware and operations. They were allowed to ask any questions during the practice drive. When participants were comfortable to drive in the driving simulator, they first self-evaluated their drowsy state using the Karolinska Sleepiness Scale (KSS) [10] and Stanford Sleepiness Scale (SSS) [9], then drove in three drive sessions continuously, each lasting 30 minutes. At the end of the drive session, they evaluated their drowsy state again using the KSS and SSS scale. Visual behaviors (including head nods, head rotations, and eye blinks) and vehicle dynamics were automatically saved by the iPhoneand the TORCS simulation software.
At the end of the experiment, participants were thanked and rewarded with $ 20 in total for a two hour experiments. Participants were allowed to stay in the lab until they felt comfortable to leave.
Self-reported drowsiness
At the beginning and ending of each session, subjects self-reported their drowsiness in two scales, the Stanford Sleepiness Scale (SSS) and Karolinska Sleepiness Scale (KSS). As shown in Figure 9, the selfreported drowsiness steadily increases across drive sessions in both scales.

Figure 9: Self-reported drowsiness across drive sessions.
The self-reported drowsiness score in SSS produces a main effect of drive sessions, F(3, 57) =60.17, p<.001, η2= 0.76. Pair-wise comparisons show that all the session-pairs are significantly different from each other, all ps <0.01. The data of self-reported drowsiness score in the KSS produces similar results. Self-reported drowsiness data thus confirm the successful manipulation of the driving study to incur drowsiness.
Head movements
The head nodding frequency produces a main effect of drive sessions, F (2, 38) =9.74, p<0.001, η2= 0.34. As shown in Figure 10, the frequency of head nodding gradually increases as drive duration increases. Pair-wise comparisons show that the frequency of head nodding in session 1 (M = 0.16Hz, SD =0.17Hz) and session 2 (M = 0.21Hz, SD =0.19Hz) are significantly lower than that of session 3 (M = 0.28Hz, SD =0.25Hz), t (19) =3.66, p =.002 and t (19) =2.76, p =0.01 respectively. The frequency of head nodding in session 2is also significantly larger than session 1, t (19) =2.16, p =0.04.

Figure 10: The frequency of head nodding.
The frequency of head rotation is also significantly different across drive sessions, F(2,38) =11.93, p<.001, η2 = 0.39. As shown in Figure 11, the frequency of head rotation gradually increases as driving duration increases. The frequency of head rotation in session 1 (M = 0.24Hz, SD =0.22Hz) and session 2 (M = 0.40Hz, SD =0.35Hz) is significantly smaller than that in session 3(M = 0.53Hz, SD =0.43Hz), t (19) =3.85, p =0.001 and t (19) =3.42, p =0.003 respectively. The frequency of head rotation in session 2 is also significantly smaller than session 3, t (19) =2.49, p =0.02.

Figure 11: The frequency of head rotation.
The increasing frequency of head rotations as driving duration increased may be a combination of the specific driving scenario in this study and the drivers’ strategy. The driving scenario in this study had only one route, without road side vehicle, traffic lights and pedestrians. Thus, drivers did not have to scan the environment by rotating their heads, resulting in a low baseline for head rotations. Drivers in session 2 and 3 increased their frequency of head rotations, which was a possible strategy to keep them awake when they were still aware of their drowsiness states, according to their self-report at the end of the experiment.
Eye movements
When the eye blinks, the percentage of black pixels in the eye area decreases. Thus, the standard deviation of percent of black pixels reflects the frequency of eye blinks. As shown in Figure12, the standard deviation of percent of black pixels in the eye area increases gradually as driving duration increases, producing a marginally significant main effect of drive sessions, F (2, 38) =3.06, p =0.058, η2 = 0.14. Pair-wise comparisons show that the percent of black pixels in session 1 (M = 0.09, SD =0.04) is significantly smaller than that of session 3(M = 0.10, SD =0.04), t (19) =2.14, p =0.046. The percent of black pixels in the eye area does not differ between session 1 and session 2 (M = 0.08, SD =0.04), or session 2 and session 3, t (19) =0.95, p =0.35 and t (19) =1.57, p =0.13 respectively.
Figure 12: The standard deviation of the percent black pixels in the eye area.
The frequency of eye blinks is shown in Figure13. The blink frequency gradually increases as driving duration increases, producing a marginally significant main effect of drive sessions, F (2, 38) =3.02, p =0.06, η2 = 0.14. Pair-wise comparisons show that the blink frequency in session 1 (M = 0.08, SD =0.24) is significantly smaller than that of session 2 (M = 0.11, SD =0.24) and session 3 (M = 0.18, SD =0.42), t (19) =2.28, p =0.034 and t (19) =2.12, p =0.047 respectively. The blink frequency does not differ between session 2 and session 3, t (19) = 1.29, p =0.21.

Figure 13: The mean of blink frequency.
The average PERCLOS is shown in Figure14. The average PERCLOS increases numerically, but does not reach statistical significance, F (2, 38) =2.24, p =0.12, η2 =0.11. Pair-wise comparisons show that the average PERCLOS in session 3 (M = 0.24, SD =0.01) is significantly larger than that of session 2 (M = 0.23, SD =0.01), t (19) =2.40, p =0.03. The average PERCLOS does not differ between session 1(M = 0.23, SD =0.01) and session 2, or session 1 and session 3, t (19) =0.61, p =0.55 and t (19) = 1.74, p =0.10 respectively.

Figure 14: The average PERCLOS (Percent Eye Closed).
The increases in the standard deviation of percent black pixels in the eye area, the blink frequency and the average PERCLOS indicate that the eye movement behaviors change systematically as a result of long driving duration.
To reduce the risks of driver fatigue, we developed a smartphonebased technology to monitor visual indicators of driver fatigue, including head nods, head rotations, and eye blinks. This smartphonebased fatigue detection technology provides a portable and affordable alternative to existing fatigue detection systems.
Computer vision technology has a wide application in improving driving safety. Many safety technologies (such as fatigue detection system, forward collision warning system and lane departure warning system) rely on computer vision algorithms. However, most of the computer vision-based technologies need devoted cameras and computer processors, thus, making the price of the technologies too high to be affordable for average drivers. The invention of smartphones makes the processors and cameras much smaller in its size and more portable. Smartphone-based computer vision technologies for driving safety does not require additional equipment than the smartphones drivers already have. Thus, smartphone-based technologies are more likely to be commonly adopted by average drivers and gain a wide popularity. For example, researchers have developed lane departure warning systems using iPhone [14,15] and a vehicle detection system using an Android smartphone [16]. To our best knowledge, the fatigue detection algorithms described in this paper are the first time implemented in smartphones. Fatigue detection using smartphones has the potentials to be more widely adopted than traditional camera based or EEG based fatigue detection technology.
With the limited computational resources of smartphones, our algorithms still achieve a high sampling rate of about 7Hz, which is fast enough for practical applications. We strive to obtain this high sampling rate by grey color conversion, image resizing, and localization of the areas of interest. The rapid development of smartphone technology and its hardware will allow even better computational performance of the fatigue detection algorithm.
Future study should include research to improve the quality of face and eye detection under low-lighting conditions, for example, during nighttime driving on the highway. Infrared illuminator may be able to improve the quality of face and eye detection and enhance the algorithm performance [17]. Besides eye blinks and head movements, other indicators of driver fatigue, such as yawn detection and vehicle dynamics, should also be considered and incorporated for driver fatigue detection [1].
This smartphone-based fatigue detection is not without limitations. For example, the computer vision algorithms use battery quickly. Drivers are expected to use this technology with a car charger to powerthe smartphone. Future breakthroughs in battery technology may reduce this limitation. Another limitation is that eye detection is difficult for drivers wearing sunglasses. When eye detection is not possible, head nods and rotations can still be used to detect fatigue. In these scenarios, yawn detection and vehicle dynamics should be considered to compensate for the reduction of fatigue detection performance when eye blink information is not available.
This research contributes to the effort to detect driver fatigue by providing a working prototype for real-time fatigue detection using an Android smartphone or an iPhone. This technology has important applications for improving driving safety.
Scales to measure driver fatigue
Stanford sleepiness scale
Please circle the item which best describes your current sleepiness level.
1 = Feeling active, vital, alert, or wide awake
2 = Functioning at high levels, but not at peak; able to concentrate
3 = Awake, but relaxed; responsive but not fully alert
4 = Somewhat foggy, let down
5 = Foggy; losing interest in remaining awake; slowed down
6 = Sleepy, woozy, fighting sleep; prefer to lie down
7 = No longer fighting sleep, sleep onset soon; having dream= like thoughts
Karolinska sleepiness scale
Please circle the item which best describes your current sleepiness level.
1= Extremely alert
2= Very alert
3= Alert
4= Rather alert
5= Neither alert nor sleepy
6= Some signs of sleepiness
7= Sleepy, but no effort to keep alert
8= Sleepy, some effort to keep alert
9= Very sleepy, great effort to keep alert, fighting sleep.