Journal of Oceanography and Marine Research
Open Access
ISSN: 2572-3103
ISSN: 2572-3103
Research Article - (2015) Volume 3, Issue 1
The existence of Giffen behaviour (i.e. the opposite situation to the Law of Demand in which consumers respond to a rising price of a certain good by demanding more of it) associated with poor consumers is one of the major controversies in economics. However, economists rarely consider that nothing makes sense except in light of evolution. In this paper, we prove the existence of Giffen behaviour in animals that exhibit no intelligent reasoning. Sardines feed on phytoplankton, and zooplankton. If the amount of phytoplankton is greater than zooplankton, then Sardines fit the Law of Demand, but if the amount of phytoplankton is smaller, the Sardines apparently show Giffen behaviour. Evolutionary population genetics models show that Giffen behaviour has more adaptive value than follow the Law of Demand under resource scarcity. Since overwhelming animal species live in poverty, Giffen behaviour may be the common economic strategy on the Earth.
<Keywords: Giffen goods; Law of demand; Adaptive behaviour; Sardines; Phytoplankton; Zooplankton
The great geneticist Theodosius Dobzhansky said one of the most influential phrases on modern scientific thought: nothing makes sense except in light of evolution [1]. Although most of economic theory has been developed independently of evolutionary thought, a study area of great interest is to apply tenets of evolution to understand the progress of certain economic phenomena in time. There is no doubt that this interdisciplinary approach could be very fertile, but many give rise to disagreements due to the interpretation of some economy process from an evolutionary approach, or certain evolutionary developments from an economic point of view.
In this paper, we seek a first stage to apply an experimental evolutionary approach to an economic problem. For this purpose, we have chosen the problem of the Giffen goods. A fundamental principle of microeconomics is the Law of Demand, which assures that as the price of a good increase, consumers demand for that good should decrease. On the contrary, a situation in which consumers respond to an increase in the price of a certain good by demanding more of it, thisis known as Giffen behaviour [2].
Since Marshall’s time, the Giffen behaviour is one of the major controversies in economics [3-6], and the existence of Giffen goods are extensively discussed in most of economics courses. Many economists assume that the Giffen behaviour has never existed. For example, Stigler [7] said that if an economist were trying to demonstrate the failure of Law of Demand in a particular market at a particular time, ‘he would be assured of immortality, professionally speaking’. However, several economists have performed theoretical approaches to the Giffen phenomenon and provide empirical evidence of the existence of Giffen behaviour [8-12].
Giffen behaviour is closely associated with poor consumers, which need to maintain subsistence consumption after the increase in the price of staple goods of which they only have access to a low number of them, the supply is limited [6,13-15]. Sustained by heterogeneity among the consumers, this wonder appears in a given market structure with a set of individual preferences and some range of prices and income, hence instead of globally Giffen phenomenon take place locally [16]. For example, Jensen and Miller [11,12] describes Giffen behaviour among extremely poor people with respect to rice in Hunan province (China).
Under a complementary approach, it has been attempts to find Giffen behaviour in animals. Battalio et al. [17] reports an example of Giffen behaviour in rats with a positive sloping demand curve. Previously, Battaglio et al. [18,19] and Kagel [20] demonstrated that there are significant parallels between several animal and human “economic” behaviour.
Based on this approach, the occurrence of Giffen behaviours within non-rational animals (e.g. fishes) could be explained like an effect of natural selection based on its adaptive value. Extending this logic further, if this behaviour has been maintained by the selection pressure in animals, it may represent and important strategy for surviving and therefor it appearance in human society not necessary is an isolated event of the consumer’s society. Thus, Giffen behaviour in human societies may also have been originated based on its adaptive value, though it may seem strange that Giffen goods exist in the light of the law of supply and demand.
This paper provides an experimental evidence of the existence of Giffen behaviour in fishes. These animals provide an excellent model for the search of Giffen behaviour: fishes accomplish the characteristics of subsistence consumers, heavily dependence of the staple good and limited substitution possibilities, their feeding habits and the abundance of available preys can be measured meticulously. Finally, their behaviour will be more influenced by the pressure of natural selection, the principal evolutionary force, than by historical or educational causes.
Specifically, we search a Giffen behaviour in SardinapilchardusWalbaum from the Cantabric and Galician continental shelf. In this area diet of Sardinapilchardus is composed of phytoplankton (mainly diatoms and dinoflagellates) and zooplankton (copepods, nauplius copepods and tintinids) (reviewed in Varela et al. [21]. The abundance of phytoplankton and zooplankton in the water column of Cantabria and Galician continental shelf varies rapidly following patterns linked to upwelling [21-26], endogenous circannual rhythms [27-31], genetic variability in growth rates [32-36], anthropogenic influence [37-40] and others [41,42]. Consequently, all possible combinations (phytoplankton abundance with scarcity of zooplankton, phytoplankton scarcity and abundance of zooplankton, either abundance or scarcity of both groups) are given during the annual cycle. In economic terms, this variability could be interpreted as the modification of “market” conditions from wealth (food abundance) to poverty (food shortage), which make this experimental model very suitable to study Giffen goods.
Usually, the stomach content of Sardinapilchardusshows a clear relation with the plankton composition of the water column, but some exceptions to this scheme can be found [21]. Often, these exceptions occur when in the water column there is few phytoplankton and much zooplankton. Apparently, in these cases, the stomach contents of the Sardines shows a higher abundance of phytoplankton and less zooplankton than those one might expect, which suggest a possible Giffen behaviour of Sardinapilchardus.
Experimental approach
We use a robust experimental approach to detect Giffen behaviour in populations of Sardinapilchardus from the Cantabric and Galician continental shelf. Sardinesmainly feed on phytoplankton (diatoms and dinoflagellates) and zooplankton (copepods and tintinids).
We analysed the stomach content of Sardines as well as the phytoplankton composition of the water column from seven different sampling stations in Cantabria and Galician continental shelf (Vigo, Muros, La Coruña, Vivero, Avilés, Gijón and Santander), as described in Varela et al. [21]. In short: from each station Sardines of more than 20 cm length were caught and the stomachs were removed and preserved in 4% buffered formalin and stored in darkness at 4ºC until laboratory analysis. Plankton was collected from water column using specific plankton nets and sampling bottles and preserved in 4% formalin and stored in darkness at 4ºC until laboratory analysis.
Upon arriving at the laboratory, the stomachs of Sardineswere opened and their contents examined. Stomach content and plankton samples from water column were microscopically examined using inverted- and stereo- microscopes (Nikon) for phytoplankton and zooplankton respectively. Abundance of phytoplankton and zooplankton was estimated as total bio-volume, which was calculated by image analysis (stereology) as described in previous works [43-45].
Data analysis
We used two different approaches to detect Giffen behaviour in Sardines:
Biological approach: We employed an intuitive biological model using a semi-quantitative approach. Certainly, this is an oversimplified model of reality that ignores the energetic contribution of phytoplankton and zooplankton, and their market prices or demand. Yet it has the advantage of not needing price estimations nor food resources demands of sardines (e.g. how much would pay a Sardine to eat phytoplankton?).
In the study area, sardines feed on both phytoplankton and zooplankton (reviewed in Varela et al. [21]). We can make an approach to the Law of Demand assuming that if there is much phytoplankton but little zooplankton in the water column, then the phytoplankton should predominate in the stomach contents of Sardines. Conversely, if there is much zooplankton and little phytoplankton in the water column, then the zooplankton should predominate in the stomach contents. In contrast, with Giffen behaviour, the Law of Demand is not met (e.g. if there is little phytoplankton and much zooplankton in the water column, then Sardines should have much phytoplankton and little zooplankton in his stomach contents).
To check our hypothesis, we tested the bio-volume of phytoplankton and zooplankton from water column and stomach content were estimated semi-quantitatively according to Margalef [46] procedures using three categories: 3+=very abundant; 2+=mean abundance; 1+=scarce presence. In each sample, we compare the abundances of phytoplankton and zooplankton in the water column with the stomach contents of sardines eating in that area.
For this purpose, we used statistical sings-test according to Dixon and Mood [47], Walsh [48] and Siegel [49]. To detect whether the Sardines follow the Law of Demand we used two statistical test simultaneously: first, we use a two-tails signs test to compare whether the amount of phytoplankton found in the water column correspond with the amount of phytoplankton found in the stomach contents of Sardines. Simultaneously, we also use a two-tails signs-test to compare whether the amount of zooplankton found in the water column correspond with the amount of zooplankton found in the stomach contents of Sardines. If these two conditions are met simultaneously, then we consider that Sardines follow the Law of Demand. In cases where the feeding behaviour of Sardines do not fit to the Law of Demand, we apply two statistical tests: first, an one-tail sings-test to check if the amount of phytoplankton found in the stomach contents of Sardines is significantly greater than the amount of phytoplankton in the water column; second, an one-tail sings-test to verify that the amount of zooplankton found in the stomach contents of sardines is significantly less than the amount of zooplankton water column. In this case, the feeding behaviour of Sardines follow a Giffen behaviour: when the supply of phytoplankton in water column became reduced, the sardines consume more phytoplankton, while decreasing consumption zooplankton, which is a more abundant resource.
Economical approach: In addition, we also use a more complex economic model, in which we estimate the prices of phytoplankton and zooplankton as a function of its abundance and nutritional value, its demand, and other economic parameters (based on Slutsky equation [50] as follows:
The Slutsky equation is usually used to study the effect in the demand. Relates the variability of the price, maintain the initial income giving rise to a new utility function. Slutsky with his elasticity equation of demand holds:
φ=φh-bφr [50]
where φ is the elasticity of the price of demand (total effect), φhthe elasticity of the price compensated or hicksian demand, represents la elasticity of demand due to variation on the price, excluding the income effect and maintaining the utility function constant (substitution effect), b the budged allocated for the good and φrthe elasticity of the resources(being bφr the income effect).
Developing the equation:
(δx/δp1)=(δh1/δp1) - x(δx/δI)=Direct effect (due to the change in the price of x)
(δy/δp2)=(δh2/δp2) - y(δy/δI)=Crossover effect (due to change in the price of y)
wherex (good representing the demand of the basic good); y (good representing the demand of the wealthy good); p1(price of x); p2 (price of y); h1(hicksian demand of x); h2 (hicksian demand of y); I (income=p1x1+p2x2).
Total effect (TE); represents the global variation of the demand in such circumstances.
Substitution effect (SE); isthe effect derived from the variance of the price of a good that conduct to a decrease of the demand of that good and increase of other, change the interchange rate. Always act in opposite direction of the energetic price.
Income effect (IE); is the effect derived from the variance in purchasing potential, the real income. It acts in opposite direction of the energetic price for common goods and in the same direction of the energetic price for inferior goods.
The type of good conditions the variation in the demand:
i) Common good: been SE≤0 and IE<0; φ<0 or SE≥0 and IE>0; φ>0. Both effects reinforce each other.
ii) Inferior goods: both effects move in opposite directions;
iii) Inferior good no Giffen: been SE≤0 and IE>0 (φh
iv) Giffen good: been SE≤0 and IE>0 (bφr>φh);φ>0
Only an increase of the price large enough can compensate the substitution and produce a negative effect on the resources, leading the demand to Giffen behaviour. That scenario is more likely to arise when the consumers are placed in a subsistence constrain [51].
We employ this approach with sardines that prey on phytoplankton and zooplankton. In our model the Sardines consume is determinate by to characteristic of the goods of study: energy, e, and requirement (which can be attributed to nutritional necessity), r. The preys are grouped into two categories: staple good (phytoplankton), x, and the energetic good (zooplankton), y, denoting the consumption of each type of good. (ex, rx) and (ey, ry) are the energy and requirement for each staple and energetic good, respectively. We assume that the consumption of the energetic good would be increased once the subsistence level of the staple good is acquired.
Lets (px)and (py)be the price for the good (in our case the price represents the abundance of preys as a function of the energy expend during the forage):
a) high abundance, less energy cost so lower price,
b) decrease abundance, high energy cost so higher price.
Consuming zooplankton is more energetic than phytoplankton but the requirement to this goods behave in opposite direction:
ey>ex and ry
As in every market the consumer’s objective is to maximize the utility (u), the level of needs satisfaction when goods are consumed, the sardine priority is firmly based on achieve a substance level of energy (E) in which certain level should be cope by the staple good but we assume that rx is constant because otherwise the sardine would not survive, hence the subsistence limits:
eyy+exx ≥ E
Once it is acquire the trend is to increase the consumption as much energy goods as possible.
The E amount is obtain from the energy acquire with nourishment (energy obtain per g of a type of prey) less the energy consume for capture the preys (it depends of the abundance of the prey) and subtracting the surviving requirements, if the abundance is high (low price) more energy could be assigned to capture fancy goods.
The income (I) is determinate by the energy needed for subsistence and the wealth that is be consider the energy invest over the subsistence level in the attached good, determinate by the price so is say the abundance. The income constraint determine that the other factor conditioned the demand:
I ≥ xpx+ypy
Sardines cannot achieve E by consuming only the energy good, because a certain level should be cope with the staple good. Their diet has to be equilibrium between both good, which lies in the intersection where the subsistence energy level is accomplished and income constrains.
Hence the consumers demand is (Dx, Dy), where:
Dx=(Epy-eyI)/(expy-eypx) and Dy=(exI -Epx)/(expy-eypx).
To observe that the staple good is Giffen, the increase of the price leads to drives up the consumption of the good, so:
Δ Dx/Δ px>0
Figure 1 summarized the response of the demand to a change in the price in the goods of study considering the staple goodas a Giffen good.
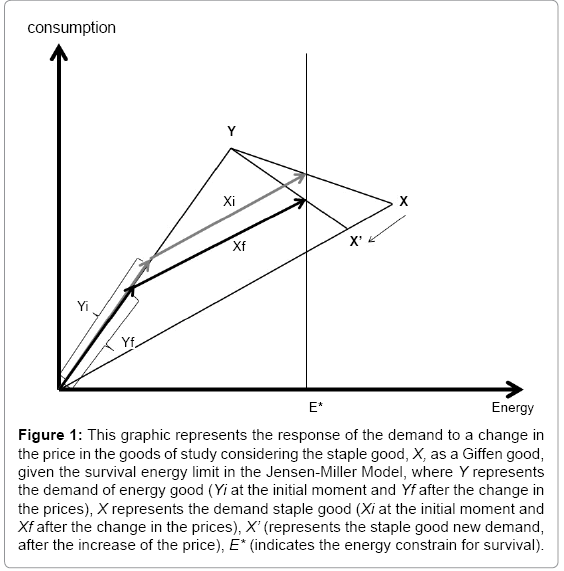
Figure 1: This graphic represents the response of the demand to a change in the price in the goods of study considering the staple good, X, as a Giffen good,given the survival energy limit in the Jensen-Miller Model, where Y represents the demand of energy good (Yi at the initial moment and Yf after the change in the prices), X represents the demand staple good (Xi at the initial moment and Xf after the change in the prices), X’ (represents the staple good new demand,after the increase of the price), E* (indicates the energy constrain for survival).
We estimate the caloric content of phytoplankton (diatoms and dinoflagellates) and zooplankton (copepods and tintinids) that constitutes the diet of Sardinapilchardus in the study area basing on a meta-analysis of the [52-55]. From these data the caloric content of phytoplankton and zooplankton consumed by sardines is around of 3600 ± 974 cal g-1 and 7700 ± 765 cal g-1 respectively (mean ± sd).
Sampling data
The abundance of phytoplankton and zooplankton in the water column as well as in the stomach content of 317 Sardines in the Cantabric and Galician continental shelf, estimated by bio-volume using a semi-quantitative scale is summarized in Table 1. A great diversity of results was obtained in the different sampling station during the annual cycle.
| Possible combinations of phytoplankton and zooplankton in water column and stomach content | No. of sardines found that fit to each condition | |||
|---|---|---|---|---|
| Water Column | Stomach content | |||
| Phytoplankton | Zooplankton | Phytoplankton | Zooplankton | |
| 3 | 3 | 3 | 3 | 18 |
| 3 | 3 | 3 | 2 | 11 |
| 3 | 3 | 3 | 1 | 2 |
| 3 | 3 | 2 | 3 | 2 |
| 3 | 3 | 2 | 2 | 21 |
| 3 | 3 | 2 | 1 | 2 |
| 3 | 3 | 1 | 3 | 0 |
| 3 | 3 | 1 | 2 | 0 |
| 3 | 3 | 1 | 1 | 0 |
| 3 | 2 | 3 | 3 | 13 |
| 3 | 2 | 3 | 2 | 21 |
| 3 | 2 | 3 | 1 | 2 |
| 3 | 2 | 2 | 3 | 2 |
| 3 | 2 | 2 | 2 | 7 |
| 3 | 2 | 2 | 1 | 8 |
| 3 | 2 | 1 | 3 | 0 |
| 3 | 2 | 1 | 2 | 0 |
| 3 | 2 | 1 | 1 | 1 |
| 3 | 1 | 3 | 3 | 0 |
| 3 | 1 | 3 | 2 | 5 |
| 3 | 1 | 3 | 1 | 11 |
| 3 | 1 | 2 | 3 | 0 |
| 3 | 1 | 2 | 2 | 2 |
| 3 | 1 | 2 | 1 | 5 |
| 3 | 1 | 1 | 3 | 0 |
| 3 | 1 | 1 | 2 | 0 |
| 3 | 1 | 1 | 1 | 0 |
| 2 | 3 | 3 | 3 | 8 |
| 2 | 3 | 3 | 2 | 8 |
| 2 | 3 | 3 | 1 | 4 |
| 2 | 3 | 2 | 3 | 3 |
| 2 | 3 | 2 | 2 | 2 |
| 2 | 3 | 2 | 1 | 3 |
| 2 | 3 | 1 | 3 | 0 |
| 2 | 3 | 1 | 2 | 0 |
| 2 | 3 | 1 | 1 | 0 |
| 2 | 2 | 3 | 3 | 1 |
| 2 | 2 | 3 | 2 | 2 |
| 2 | 2 | 3 | 1 | 2 |
| 2 | 2 | 2 | 3 | 0 |
| 2 | 2 | 2 | 2 | 5 |
| 2 | 2 | 2 | 1 | 4 |
| 2 | 2 | 1 | 3 | 0 |
| 2 | 2 | 1 | 2 | 0 |
| 2 | 2 | 1 | 1 | 0 |
| 2 | 1 | 3 | 3 | 0 |
| 2 | 1 | 3 | 2 | 5 |
| 2 | 1 | 3 | 1 | 16 |
| 2 | 1 | 2 | 3 | 0 |
| 2 | 1 | 2 | 2 | 0 |
| 2 | 1 | 2 | 1 | 9 |
| 2 | 1 | 1 | 3 | 0 |
| 2 | 1 | 1 | 2 | 0 |
| 2 | 1 | 1 | 1 | 0 |
| 1 | 3 | 3 | 3 | 11 |
| 1 | 3 | 3 | 2 | 23 |
| 1 | 3 | 3 | 1 | 9 |
| 1 | 3 | 2 | 3 | 1 |
| 1 | 3 | 2 | 2 | 6 |
| 1 | 3 | 2 | 1 | 4 |
| 1 | 3 | 1 | 3 | 0 |
| 1 | 3 | 1 | 2 | 1 |
| 1 | 3 | 1 | 1 | 0 |
| 1 | 2 | 3 | 3 | 1 |
| 1 | 2 | 3 | 2 | 4 |
| 1 | 2 | 3 | 1 | 13 |
| 1 | 2 | 2 | 3 | 1 |
| 1 | 2 | 2 | 2 | 4 |
| 1 | 2 | 2 | 1 | 4 |
| 1 | 2 | 1 | 3 | 0 |
| 1 | 2 | 1 | 2 | 2 |
| 1 | 2 | 1 | 1 | 0 |
| 1 | 1 | 3 | 3 | 0 |
| 1 | 1 | 3 | 2 | 1 |
| 1 | 1 | 3 | 1 | 4 |
| 1 | 1 | 2 | 3 | 0 |
| 1 | 1 | 2 | 2 | 0 |
| 1 | 1 | 2 | 1 | 11 |
| 1 | 1 | 1 | 3 | 0 |
| 1 | 1 | 1 | 2 | 0 |
| 1 | 1 | 1 | 1 | 12 |
Table 1: Abundance of phytoplankton and zooplankton in water column and stomach content of Sardines estimated by bio-volume using a semi-quantitative scale according to Margalef [46] (3+=very abundant; 2+=mean abundance; 1+=scarce presence). All the possible combinations of phytoplankton and zooplankton abundances in water column and stomach content are shown indicating the number of Sardines that fit to each combination. (Of course, sardines do not meet some of the theoretically possible combinations of phytoplankton and zooplankton; these cases are reflected in the column No. of Sardines with 0).
Numerous combinations between phytoplankton and zooplankton abundance (i.e. from very abundant phytoplankton and zooplankton to scarce presence of both) were observed, but there seems to be a pattern: when there is abundance of phytoplankton and zooplankton in water column, Sardines feed on both resources interchangeably (Table 1). A similar pattern also occurs when of both resources are in mean abundance in the water column (Table 1).
Conversely, when the phytoplankton amount is scarce in the water column, the concentration of phytoplankton in the stomach content of Sardines appear greatly increased, regarding the water column. To do this, Sardines apparently reduce the capture zooplankton, which is a more abundant resource in the water column than the phytoplankton. In any case, Sardines never increase their consumption of zooplankton based on reducing the phytoplankton consumption.
Biological approach
In our biological approach, we consider that Sardines follow the Law of Demand if: i) there are no-significant differences (p>0.05) between the amount of phytoplankton found in the water column and the amount of phytoplankton found in the stomach contents of sardines, and ii) there are no-significant differences (p>0.05) between the amount of zooplankton found in the water column with the amount of zooplankton found in the stomach contents of sardines (Table 2). This allows us to determine the conditions of abundance of phytoplankton and zooplankton in the water column required for that Sardines follow the Law of Demand: when the amount of phytoplankton in the water column is greater than or equal to amount of zooplankton in the water column, then Sardines fit the Law of Demand (Table 2). An amount of 163 Sardines out of 256.
| Conditions in which Sardinesfollow the Law of Demand | |||||||
|---|---|---|---|---|---|---|---|
| Water Column | Stomach content | No. of sardines found | Law of Demand | Giffen | Value of(Δ Dx/Δ px) | ||
| Phyto-plankton | Zoo-plankton | Phyto-plankton | Zoo-plankton | ||||
| 3 | 3 | 3 | 3 | 18 | Yes | no | ≤0 |
| 3 | 3 | 3 | 2 | 11 | Yes | no | ≤0 |
| 3 | 3 | 2 | 2 | 21 | Yes | no | ≤0 |
| 3 | 2 | 3 | 3 | 13 | Yes | no | ≤0 |
| 3 | 2 | 3 | 2 | 21 | Yes | no | ≤0 |
| 3 | 2 | 2 | 2 | 7 | Yes | no | ≤0 |
| 3 | 2 | 2 | 1 | 8 | Yes | no | ≤0 |
| 3 | 1 | 3 | 1 | 11 | Yes | no | ≤0 |
| 2 | 2 | 2 | 2 | 5 | Yes | no | ≤0 |
| 2 | 1 | 3 | 1 | 16 | Yes | no | ≤0 |
| 2 | 1 | 2 | 1 | 9 | Yes | no | ≤0 |
| 1 | 1 | 2 | 1 | 11 | Yes | no | ≤0 |
| 1 | 1 | 1 | 1 | 12 | Yes | no | ≤0 |
| Conditions in which Sardines follow Giffen behaviour | |||||||
| 2 | 3 | 3 | 3 | 8 | No | yes | >0 |
| 2 | 3 | 3 | 2 | 8 | No | yes | >0 |
| 1 | 3 | 3 | 2 | 23 | No | yes | >0 |
| 1 | 3 | 3 | 1 | 9 | No | yes | >0 |
| 1 | 3 | 2 | 2 | 6 | No | yes | >0 |
| 1 | 3 | 3 | 3 | 11 | No | yes | >0 |
| 1 | 2 | 3 | 1 | 13 | No | yes | >0 |
| Conditions in which sardines neither meet the Law of Demand, nor show Giffen behaviour(exceptions) | |||||||
| 3 | 1 | 3 | 2 | 5 | No | no | n.v. |
| 3 | 1 | 2 | 1 | 5 | No | no | n.v. |
| 2 | 1 | 3 | 2 | 5 | No | no | n.v. |
*n.v : not valuable.
Table 2: Results obtained using a Biological approach and a Theoretical approach: Law of Demand column: the Sardines fulfil the Law of Demand when two conditions are met: i) there are statistically no-significant differences (p>0.05) in two-tails signs test comparing the amount of phytoplankton found in the water column with the amount of phytoplankton found in the stomach contents of Sardines, and ii) there are statistically no-significant differences (p>0.05) in two-tails signs test comparing the amount of zooplankton found in the water column with the amount of zooplankton found in the stomach contents of Sardines. Giffen column: the Sardines follow Giffen behaviour when two conditions are met: i) the amount of phytoplankton found in the stomach contents of Sardines is significantly greater than the amount of phytoplankton in the water column (p<0.05, one-tail singstest) and ii) the amount of zooplankton found in the stomach contents of Sardines is significantly smaller than the amount of zooplankton in the water column (p < 0.05, one-tail sings-test). Statistic was performed only when sample ≥ 5 Sardines. Economical approach: Values of the ratio Δ Dx/Δ pxare shown grouped into 3 intervals: i) Δ Dx/Δ px ≤ 0 (Sardinesfollowing the Law of Demand), ii) Δ Dx/Δ px>0 (Sardines showing a Giffen behaviour) or iii) Samples of 5 Sardines non valuables (exceptions of the model). Statistic was performed only when sample ≥ 5 Sardines.
In our biological approach, we consider that sardines follow a Giffen behaviour when two conditions if: i) the amount of phytoplankton found in the stomach contents of Sardines is significantly greater than the amount of phytoplankton in the water column (p<0.05) and ii) the amount of zooplankton found in the stomach contents of Sardines is significantly smaller than the amount of zooplankton in the water column (p<0.05, one-tail sings-test). This allows us to determine the conditions of abundance of phytoplankton and zooplankton in the water column required for that Sardines follow a Giffen behavior: when the amount of phytoplankton in the water column is smaller than the amount of zooplankton in the water column, then sardines fit to a Giffenbehaviour (Table 2). An amount of 78 sardine out of the 256 sampled.
We also found 3 exceptions in which sardines neither meet the Law of Demand, nor show Giffen behaviour (Table 2). In all 3 cases only appeared five sardines in the sampling, so the most likely explanation for these exceptions is that there are insufficient data for a meaningful statistical.
Economic model
We have asingle economic model of two goods, phytoplankton (x) and zooplankton (y), consumed by sardines. The goal of a species in natural conditions is achieve an energetic level enabling it highest fitness, not wealth.
Due to the difficulty of calculating the energy cost of the forage, we have simplifies the price of each of the goods (phytoplankton [x]the staple good and zooplankton [y] the energetic good) as a function of the abundance. Being the higher price the lower abundance and vice versa we have estimated the price of each of the goodsas:
px=1/[ax/(ax+ay)] and py=1/[ay/(ax+ay)]
where: px=price of the staple good; py=price of the energetic good; ax=abundance of phytoplankton (as total bio-volume) and ay=abundance of zooplankton (as total bio-volume)
In practice, we expressed the prices of the staple good and the energetic good as percentage:
px=[(ax+ay)/ax] x 100 and py=[(ax+ay)/ay] x 100
The energy given by each of the goods, is obtain extrapolating data from literature. The caloric content of phytoplankton and zooplankton consumed by Sardines is around ofex ≈ 3600 ± 974 cal g-1 and ey ≈ 7700 ± 765 cal g-1 respectively (mean ± sd). Consequently ey ≈ 2.14 ex. Their diet has to be equilibrium between both good, Sardines cannot achieve E by consuming only the energetic good (E
The level of energy (E)constrain for survival should be constant. Energy was estimated as:
E=(ex ax)+(2.14 exay) with ax and ay estimated in stomach content
The ideal situation would have been the experimental calculation of the energy needed for subsistence. The income (I) is determinate by the energy needed for subsistence and the wealth. Therefore, the income should be the substance level of energy (E) plus 10% more of energy that Sardines can acquire (I=E x 1,10%). This value is linked directly to the energetic price (abundance) of the goods. Accordingly, we estimate the results of the consumers demand (Dx, Dy)
To observe that the staple good (phytoplankton) is Giffen, the increase of the price leads to drives up the consumption of the good:
Δ Dx/Δ px>0
These values are given in Table 2 grouped into two categories: i) values that satisfy the Law of Demand Δ Dx/Δ px ≤ 0) and ii) values that satisfy the Giffenbehaviour (Δ Dx/Δ px>0). This allows us to determine the conditions of abundance of phytoplankton and zooplankton in the water column required for that sardines follow Law of Demand or Giffen behavior: If the amount of phytoplankton in the water column is greater than or equal to amount of zooplankton in the water column, then Sardines fit the Law of Demand (Table 2). If the amount of phytoplankton in the water column is smaller than the amount of zooplankton in the water column, then Sardines fit to a Giffenbehaviour (Table 2). These results are consistent with those obtained using the biological approach of the previous section.
Since Marshall [2] raised the existence of Giffen goods, economists have mainly followed three strategies:
ii) look for evidences of Giffenbehaviour, mainly when the consumers are placed in a subsistence constrain [6,11-15], and to a lesser extent
iii) animal testing under laboratory experimental conditions that enable adoption of Giffenbehaviour, suggesting that there might be significant parallels between several animal and human “economic” behaviour [17-20].
Despite these different approaches, the controversy on the existence of Giffen goods continues, and many economists suggest that Giffenbehaviour observed in human communities living in poverty are due to errors in economic reasoning (which led them to poverty). Certainly, human beings have a complex behaviour creating intricate instrument to respond to the market phenomenon. Economic behaviour of human societies is conditionedby theweight of historyand education. This greatly complicates the study of Giffen behaviour.
As an alternative, we address a very different approach: the search for Giffen behaviour in animals exhibiting a default or less flexible behaviour. For this purpose, we studied Sardines living in their natural habitat, under an experimental approach (collecting data on abundance of phytoplankton and zooplankton in the water column and in the stomach contents of Sardines living there) that no will interfere with the natural behaviour of these fish.
One of the greatest achievements of modern evolutionary biology has been to understand the animal behaviour from an evolutionary point of view (reviewed in Hamilton [56], Wilson [57], Dawkins [58]. The behaviour in species (exhibiting a default or less flexible behaviours) is the result of natural selection as a strategy to maximize survival and reproductive success. Consequently, natural selection will only allow the behaviours that have higher fitness (reviewed in Maynard Smith [59-61]. Therefore, if we find a Giffenbehaviour in these animals we will have shown that this behaviour is adaptive under the environmental conditions where these animals live.
If sardines do not selectively choose between phytoplankton and zooplankton to eat, then it would expect that the stomach content fit with the abundance of phytoplankton and zooplankton in the water column. In this case the sardines follow the Law of Demand, i.e. to a greater offer (abundance of phytoplankton in the water column) correspond a greater abundance of phytoplankton in the stomach contents and vice versa. This is what happens when the amount of phytoplankton in the water column is greater than or equal to amount of zooplankton in the water column. Under these conditions, the stomach content of sardines is a true reflection of the resources in the water column.
However, if the amount of phytoplankton in the water column is smaller than the amount of zooplankton in the water column, then Sardines fit to a Giffenbehaviour. Surprisingly, when phytoplankton shows scarce presence in the water column, Sardines increase their consumption and phytoplankton appears more concentrated in their stomach content. Furthermore, this increase in phytoplankton consumption comes at the expense of consumption of zooplankton, despite being the most abundant resource in the water column.
Perhaps, a number of biologically based explanations would support this Giffen behaviour (e.g., zooplankton is more mobile and is more difficult to capture, but a diet of zooplankton provides a better caloric content). However, this work focuses on the search for Giffen behaviour in animals to propose an evolutionary explanation of it: if sardines show a Giffen behaviour in nature, then natural selection does not eliminate this behaviour. In particular, when there is little phytoplankton and a lot of zooplankton in the water column, Giffen behaviour could has more adaptive value than following the Law of Demand.
By using an Ockham’s razor, we employ a model of evolutionary population genetics to illustrate the adaptive value of Giffen behaviour. According to Hamilton [56] and Maynard Smith [59-61], we assume that in animals exhibiting no intelligent reasoning display ornot display aGiffenbehaviour is genetically determined.
In the simplest case, the model is based on a single gene with two alleles (G+, G) and three possible genotypes (G+G+, G+G, GG), where G+G+determine Giffen behaviour and GG determine a no-Giffen behaviour. The effects of natural selection is to change gene frequency according to:
Δp=(pq [p (w1-w2)+q (w2-w3)])/W [62]
where: p=f(G+); q=f(G-); w1=fitness of G+G+genotype; w2=fitness of G+G- genotype; w3=fitness of G-G- genotype; W=mean fitness.
Data from Table 1 indicates that when thephytoplanktonisscarcer thanzooplanktoninthe water column the Sardines follow a Giffenbehaviour increasing phytoplankton abundance in their stomach content (56 Sardines follow a Giffen behaviour, 1 sardine does not). When these results are analysed on a time scale, it is found that frequency of sardines that follow a Giffen behaviour remains constant around 0.98. Consequently, the Giffen behaviour is nearly fixed in populations of sardines (p≈1), which is explained if w1 ≥ w2>w3. This shows that Giffen behaviour in populations of Sardines have adaptive value.
Our work provides a new approach to the problem of Giffen goods: in some cases, Giffen behaviour is favoured by the action of natural selection as the best possible behaviour in circumstances of scarcity of basic resources. Of course, you cannot directly extrapolate the behaviour of sardine populations to human beings. Perhaps a Giffenbehaviour is the best way forward for certain human populations under conditions of extreme poverty.
The overwhelming majority of animals exhibit no intelligent reasoning. The behaviour of these species is the result of natural selection maximizing fitness. If Giffen behaviour is the most adaptive strategy to cope poverty, Giffen behaviour could then be the most common economic behaviour among the living beings that inhabit the Earth.
This work was supported by the Spanish Secretaría de Estado de Investigación, Desarrollo e Innovación (Grant CTM 2012-34757 and Grant CTM 2013-44366-R).