Journal of Pollution Effects & Control
Open Access
ISSN: 2375-4397
ISSN: 2375-4397
Research Article - (2017) Volume 5, Issue 3
The present study focused on assessing the water quality by using water quality index (WQI) of six streams located surrounding iron ore mine of Suakati area of Keonjhar District of Odisha, which includes the physicochemical analysis of fourteen parameters: pH, colour, total dissolved solids (TDS), dissolve oxygen (DO), biochemical oxygen demand (BOD), total hardness (TH), chloride (Cl-), nitrate (NO3-), oil & grease (O&G), sulphate (SO42-), iron (Fe), manganese (Mn), fluoride (F-) and arsenic(As). The WQI of these streams ranges from 4.47 to 244 indicating bad water quality of few streams. The high value of WQI has been found to be mainly from the higher values of TDS, TH, NO3-, O&G, Mn, SO42-, As, Fe and F- in different stream water. Correlation analysis shows a strongest value of positive Correlation coefficient (r) exist between O&G and WQI (r=0.979) at SW1, between as and WQI (r=0.985) at SW2, between O&G and WQI (r=0.99) at SW3, between O&G and WQI (r = 0.995) at SW4, between as and WQI (r=0.948) at SW5 and between TDS and WQI (r=0.753) at SW6. The analysis reveals average WQI score for water sample from locations SW1 (126.4), SW2 (222.6), SW3 (105.2) and SW6 (156.6) are in higher sides and quality is very poor. The study shows the quality of water is fit to use in irrigation but not fit for domestic purpose. It also proofs that anthropogenic activity like mining activity is putting deleterious impact on the surrounding water bodies.
Keywords: Water quality standards; Water quality index; Correlation; Multiple Linear Regression
Water one of the most priceless gifts of nature is regarded as the life line on Earth. The importance of water and its role as essential for human health, animals and plants [1,2] essential for crop and animal production, for aquatic and terrestrial ecosystems [3] and for our daily life supporting activities [4] is well observed . Water of adequate quantity and quality is essential for sustainable development [5].
In fresh water, river water contribute a major percentage for multiple uses in every sector like drinking, domestic purpose, agriculture, industry, transportation, aquaculture, public water supply etc. [6]. The quality of surface water within a region is governed by both natural processes such as precipitation rate, weathering processes and manmade activities such as urban, industrial and agricultural activities and the human exploitation of water resources. Many Studies have indicated that many rivers/streams particularly in developing countries are heavily polluted due to industrial, municipal waste water discharges, as well as agricultural runoff [7-10] and impair their use for drinking, industrial, agricultural and recreational purposes [11]. Mining activity is not excluded from these. Mining is one of the major manmade activities causing deleterious impact on surrounding environment [12-14]. The environmental problems arise due to mining activities are land degradation, air pollution, surface and ground water pollution, deterioration of natural drainage system [12,13,15]. Surface and groundwater pollution is one of the significant impacts of mining activity [16-18]. Water pollution is a major concern in mining operation area [12,13,16,17,19-22]. Water pollution in mining areas are getting affected mainly due to overburden dumps(OBD), surface impoundments, industrial effluents, acid mine drainage, tailing ponds [23], discharge of pumped out mine water which contain heavy metal [24-27], discharge of leachate from mine waste, surface runoff from OBD [16,28], disposal of solid waste generated by mining operations, waste rock, sub-grade ore and mineralized reject which in result cause disturbance of water level of surface and ground water quality and environmental pollution [29,30].
Mining activity have added metal contaminant to surface or ground water [17,18,31]. These metals have accumulated in living organisms [32], either directly through consumption of contaminated water or indirectly by consumption of contaminated plants or meat [33]. Study shows that there is health risk associated with those metal contaminanted water [34]. Those metal contaminated water pose direct threat to human health when that water is used as drinking purpose [31,35] or pose indirect threat to human health when that water is used in irrigation purpose [23,35-37]. River and streams located near to mining activities get contaminated continuously from point as well as non-point source. It is a matter of fact that in India the river systems are getting polluted day by day and river water pollution has now reached to a point of crisis. Access to drinking water in India has increased over the past few decades with the tremendous adverse impact of unsafe water for health [23].Scarcity of clean and potable drinking water has emerged in recent years as one of the most serious developmental issues in many parts of India like West Bengal, Jharkhand, Orissa, Western Uttar Pradesh, Andhra Pradesh, Rajasthan and Punjab [38]. The 30% of urban and 90% of the rural Indian population still depends completely on untreated surface or groundwater resources [39]. In Orissa a large scale of mining activities and industrialization based on these metallic minerals are being carried out in the district of Keonjhar which has greatly affected both water quality and quantity. The inhabitants of this area are mostly Scheduled Tribe (ST) with very little or no awareness regarding the water quality and its impact on health. Thus, there is an urgent need to create awareness among the local people about the contamination of water bodies, its impact and protection of these precious resources [40]. Hence access to safe drinking water remains an urgent necessity. Therefore to safeguard freshwater resources, management and protection strategies have to be developed for each water basin individually [41] including a comprehensive river water quality monitoring program to device ways and mean to protect it. The monitored data will help the planners both at the national and international levels to develop various environmental programs. However, when a large number of samples and parameters are monitored, it becomes difficult to evaluate and present the water quality as a single unit [42,43]. In this regard Index method is quite useful to express the quality of water. The Water quality index (WQI) is one of the most effective tool [44-46] used to transform large number of variables data into a single number to represents the water quality level [23,44-50] and to communicate information on the quality of water [51,52] to the concerned citizens and policy makers and ensure sustainable safe use of water for drinking [38]. Bordalo et al. [48] initially proposed the application of WQI and since then many different methods for the calculation of WQI have been developed. Therefore, the present study is made with an objective to evaluate water quality through water quality index of local streams water Bamni nala, Chamnda Nala, stream at Putulupani and surface water near Pond at Upar Jagar, Pond at Urumunda, Chamnda nala near Kumundi village and to assess the suitability of water for domestic and drinking purpose. This baseline information will also be very useful for managing future water resources in this region.
Study Area
The study area is located between 21°37’09”-21°40’02”N and 85°29’20”-85°31’30”E, near to Suakati town in Keonjhar district of Odisha . A major iron deposit of state namely Gandhmardan hill is located at the centre of study area, having an estimated reserves of 350 million tonne of iron ore. The existing iron ore mine at this hill is one of the oldest mines of Odisha. The iron ore mining started in Gandhamardan hill range by Odisha Mining Corporation (OMC), a State Goverment owned agency in 1965 and presently it has two open cast iron mines namely Gandhamardan A and B covering around 2200 hectare. Similarly two private owned mines are also operating at Putulpani (Talajagar) and at Urumunda village respectively covering a total area of 182.1932 hectares. The study area has dendritic pattern of drainage because of its hilly topography. The drainage channels emerging from the eastern half of the Gandhamardan area flow down to join the Kadal Nadi which flows northward to join the Ardei Nadi which is a tributary of Baitarani river.
The present study was carried out for a period of two year (2013- 2014) covering pre monsoon period (March-June), monsoon period (July-October) & post monsoon period (November-February). Water samples were collected from six different locations located surrounding iron ore mine of Suakati area of Keonjhar District of Odisha (Table 1) as per the norms of the American Public Health Association (APHA 2000). Water samples were collected in acid-washed plastic bottles of one litre capacity having double stopper facilities to its full capacity without entrapping air bubbles inside. The analytical method of samples for fourteen physico-chemical parameters pH, colour, TDS, DO, BOD, TH, Cl-, NO3-, O&G , SO42-, iron, Mn, F and As follows APHA 2000. The parameters pH, and DO were monitored at the sampling site. These obtained data of fourteen parameters were compared with the standard guideline values, recommended by IS:2296. The obtained analytical data of fourteen physico-chemical parameters from six sampling stations are used for calculation of WQI in eq-1 [53] for different studied period to assess the suitability of water for drinking purposes, for irrigation purpose, for industrial purpose, for biotic communities etc.
| Location code | Location | Remarks |
|---|---|---|
| SW1 | Bamni nala near Upar Jagar ( mines area) | Stream water |
| SW2 | Pond at Upar Jagar (2) | Surface water |
| SW3 | Stream at Putulupani | Stream water |
| SW4 | Pond at Urumunda | Surface water |
| SW5 | Chamnda nala near Kumundi village | Surface water |
| SW6 | Chamnda Nala near Suakat Town | Stream water |
Table 1: Six sampling location with location code.
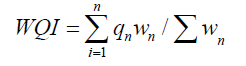 (1)
(1)
Where, qn=Quality rating of nth water quality parameter.
Wn=Unit weight of nth water quality parameter.
The quality rating (qn) is calculated using the expression given in equation 2.
qn=[( Vn-Vid )/( Sn-Vid )]×100 (2)
Where,
Vn=Estimated value of nth water quality parameter at a given sample location.
Vid=Ideal value for nth parameter in pure water.
(Vid for pH=7, for DO=14.6mg/L and for all other parameters is zero)
Sn=Standard permissible value of nth water quality parameter.
The unit weight (Wn) is calculated using the given equation 3.
Wn=k/S0 (3)
Where,
Sn=Standard permissible value of nth water quality parameter.
k=Constant of proportionality and it is calculated by using the bellow equation 4.
k=[1/(Σ1/Sn=1,2,..n)] (4)
WQI is calculated from the above equation-1 as per the details of water quality standard values and weightage factors, which Involves the Following Steps: First, the calculation of weightage of each parameter. Second, the calculation of the quality rating for each parameter. Third, the calculation of sub-indices and then, summation of these sub-indices of all parameters to get the overall index.
Subsequently Karl Pearson Correlation matrix-eq-2 [54] has used to find out the closeness of the relationship between fourteen tested parameters and that of with calculated WQI. Regression and multiple linear regression(MLR) analysis was tested to best represent the relation between a single dependent, single independent variable and between a single dependent, a set of independent variables. The obtained regression and MLR analysis is being used as a useful information to project the index value of the studied area, if the strongly WQI dependent variables are measured.
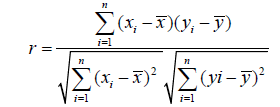
Where,
n=number of data points,
x=values of x- variable,
y=values of y-variable,
͞x =mean of all variables of x
ӯ=mean of all variables of y,y
r=Pearson Correlation.
The obtained data (Table 2) from laboratory analysis of water samples of six location showed that the observed physico-chemical parameters for different water samples are almost within the recommended standards except few parameter like colour, TDS, TH, O&G. These parameter are deteriorating the quality of water. Among all the analysed physico-chemical parameters. pH is an important parameter which determines the suitability of water for various purposes [55,56]. High pH levels are undesirable since they may impart a bitter taste to the water [57] and also depress the effectiveness of disinfection by chlorination, thereby requiring the use of additional chlorine or longer contact times [58]. In the present study, pH ranges from 6.1 to 7.8 (Table 2) for all six sampling location during entire studied period. This shows that the pH range obtained from six station water samples are almost within the recommended range of 6.50 to 8.50(IS 1982) except water samples from SW1,SW2,SW3 where the average recorded values were 6.2,6.3,6.4 respectively during study period and were just below the recommended range(IS 1982).
| Parameter | Standard (IS 2296) | SW1 | SW2 | SW3 | SW4 | SW5 | SW6 | ||||||||||||
|---|---|---|---|---|---|---|---|---|---|---|---|---|---|---|---|---|---|---|---|
| Pr.M | M | P.M | Pr.M | M | P.M | Pr.M | M | P.M | Pr.M | M | P.M | Pr.M | M | P.M | Pr.M | M | P.M | ||
| pH | 8.5 | 6.1 | 6.4 | 6.3 | 6.5 | 6.2 | 6.4 | 6.2 | 6.8 | 6.4 | 7.1 | 7.3 | 7.3 | 7.4 | 7.8 | 7.1 | 6.9 | 6.2 | 7.2 |
| Colour | 300 | 210 | 356 | 312 | 156 | 345 | 204 | 174 | 324 | 186 | 123 | 289 | 122 | 89 | 124 | 56 | 58 | 123 | 56 |
| TDS | 1500 | 1650 | 456 | 1450 | 1820 | 1560 | 1750 | 1540 | 1450 | 1620 | 1200 | 1405 | 1225 | 1200 | 1468 | 1350 | 1650 | 1850 | 1800 |
| DO | 4 Min | 5 | 5.6 | 4.8 | 4.2 | 3.5 | 3.8 | 3.4 | 5.2 | 3.9 | 4.5 | 4.1 | 5.6 | 4.5 | 3.7 | 5.2 | 3.9 | 3.2 | 4.3 |
| BOD | 3 | 1.8 | 2.8 | 2.1 | 1.8 | 2.2 | 3.7 | 2.2 | 2.1 | 3.1 | 1.2 | 1.8 | 1.6 | 2.2 | 2.6 | 1.1 | 3.2 | 4.2 | 1.6 |
| TH | 300 | 475 | 395 | 435 | 515 | 412 | 505 | 455 | 255 | 465 | 514 | 125 | 495 | 605 | 222 | 575 | 395 | 214 | 405 |
| Cl- | 600 | 35.4 | 42.2 | 112 | 52 | 35.5 | 24.6 | 560 | 57.5 | 620 | 435 | 121 | 455 | 550 | 235 | 415 | 550 | 212 | 580 |
| NO3- | 50 | 45 | 32 | 25 | 35 | 22.1 | 44 | 35 | 24.5 | 30 | 25 | 25 | 32 | 40 | 32 | 35 | 53 | 14 | 44 |
| O & G | 0.1 | 0.3 | 0.01 | 0.21 | 0.21 | 0.05 | 0.04 | 0.24 | 0.03 | 0.21 | 0.02 | 0 | 0 | 0.03 | 0.01 | 0.02 | 0.2 | 0.06 | 0.3 |
| SO42- | 400 | 135.6 | 121 | 56.7 | 52.5 | 23..5 | 95 | 15.3 | 21.2 | 12.5 | 56 | 15 | 7.5 | 17.4 | 12.3 | 11.2 | 23.4 | 26.8 | 45.4 |
| Iron | 50 | 4.5 | 15.2 | 2.4 | 9.4 | 35.4 | 12.2 | 11.4 | 12.3 | 6.5 | 11.2 | 7.4 | 2.3 | 1.8 | 0.45 | 2.3 | 21 | 12.8 | 21.3 |
| Mn | 0.5 | 0.7 | 0.01 | 0.3 | 0.2 | 0.12 | 0.21 | 0.12 | 0.21 | 0.04 | 0.12 | 0.02 | 0.134 | 0.023 | 0 | 0 | 0.01 | 0.04 | 0.02 |
| F - | 1.5 | 0.01 | 0.4 | 0.3 | 0.2 | 0.2 | 0.02 | 0.2 | 0.23 | 0.15 | 0.02 | 0.01 | 0.012 | 0.001 | 0 | 0.03 | 0.012 | 0.01 | 0.02 |
| As | 0.2 | 0.001 | 0.01 | 0.01 | 0.01 | 0.01 | 0.04 | 0.02 | 0.12 | 0.14 | 0.001 | 0.01 | 0.002 | 0.051 | 0.12 | 0.11 | 0.04 | 1.1 | 0.01 |
| WQI | -- | 244 | 10.9 | 125 | 122 | 34.1 | 512 | 138.6 | 40 | 137 | 15.8 | 4.47 | 5.57 | 11.98 | 25.1 | 27.9 | 117 | 186 | 167 |
| Note: All parameter are in mg/L except pH, colour (Hazen) and WQI. Pr.M (pre monsoon), M (monsoon), PM (post monsoon) | |||||||||||||||||||
Table 2: Physicochemical parameters of water samples of six local streams at Gandhamardan iron mines, Suakati, Keonjhar district in the pre-monsoon, monsoon and post monsoon season.
The water color results from the existence of dissolved substances like presence of some metallic ions (iron and manganese), bacterial activity and colored effluents discharges from some industries [59]. As the studied sampling station of six stream water receives a great quantity of effluents from heavy vehicle repairing garage, surface runoff water from mining area, thus quality of these effluents has a great influence on the water color which is cleared from correlation study between color and WQI. The average value for color at six sampling sites were ranging from 79hazen to 292 hazen where lowest value is registered at SW6 (79hazen) and highest value is registered at SW1. At other stations SW2, SW3, SW4, SW5 the values were 237, 228, 178, 89 respectively (Table 2). Though the values were within the limit (IS 1982) but it was observed that during monsoon period (356 hazen) & postmonsoon period (312 hazen) at SW1, monsoon period (345hazen) at SW2,monsoon period (324 hazen) at SW3 higher values of colour parameter was registered which greatly influenced the WQI at those stations during observed period.
TDS in ground water may affect persons suffering from kidney and heart diseases [60]. The dissolved solid is due to surface runoff from mining area and industrial discharge .The TDS value of all water samples collected from six studied location ranges from 1200 mg/L to 1650 mg/L, 1560 mg/L to 1820 mg/L, 1450 mg/L to 1620 mg/L, 1200 mg/L to 1400 mg/L, 1200 mg/L to 1468 mg/L, 1650 mg/L to 1880 mg/L at station SW1, SW2, SW3, SW4, SW5, SW6 respectively (Table 2). At sampling stations SW2, SW3 and SW6, the average TDS values was found at 1710 mg/L, 1537 mg/L, 1777 mg/L which were well above the recommended limit (IS 1982). Whereas at sampling station SW1 (1400 mg/L), SW4 (1275 mg/L), SW5 (1339 mg/L) the average values of TDS were recorded below the recommended limit. At sampling stations SW1, SW2, SW3, SW4, SW5, SW6 the highest values for TDS 1650 mg/L, 1820 mg/L, 1620 mg/L, 1400 mg/L, 1468 mg/L, 1880 mg/L are observed during pre-monsoon, postmonsoon, monsoon, (Table 2) respectively whereas at same stations the lowest values of 1200 mg/L, 1560 mg/L, 1450 mg/L, 1200 mg/L, 1200 mg/L, 1650 mg/L for TDS are recorded during monsoon, premonsoon period respectively. Among the data obtained from all the station shows station, SW6 registered highest value of 1880 mg/L for TDS and was excepted probable due to the surface runoff generated from the overburden, mining site during rainy season.
DO is an important parameter for all aquatic organisms that possess aerobic respiration [61] and its presence in water may be due to direct diffusion from air and photosynthetic activity of autotrophs [62]. It gives direct and indirect information regarding bacterial activity, photosynthesis, availability of nutrients, stratification etc. of water [63].
The mean values of DO and BOD have never reached critical values in the most times at the studied areas. The obtained values are almost within the recommended limits except of few samples, indicating less biodegraded load in water and microbial activity. The average lowest DO value of 3.6 mg/L was recorded at SW2 indicating possible organic pollution. Whereas the highest value of 4.9 mg/L was recorded at SW1 indicating very less organic pollution. The DO value for different period below the limit are 3.5 mg/L (during monsoon period) & 3.8 mg/L (during post monsoon period) at SW2, 3.4 mg/L (during pre-monsoon period) & 3.9 mg/L (during post monsoon period) at SW3, 3.7 mg/L (during monsoon period) at SW5 and 3.2 mg/L (during monsoon period) at SW6 respectively were recorded indicating high BOD load. At stations SW3, SW4, SW5, SW6 average DO values were, 4.2, 4.7, 4.3, 3.7 mg/L respectively indicating DO level was with in the limit as per (IS 1982) and also indicates less BOD load which was cleared from obtained data. At station SW6 highest average BOD value of 3 mg/L was found whereas at SW1, SW2, SW3, SW4, SW5 low BOD values of 2.2, 2.5, 2.4, 1.5, 1.9 mg/L respectively were obtained. Higher BOD value of 3.7 mg/L at SW2, 3.1 mg/L at SW3, 3.9 mg/L and 4.2 mg/L at SW6 were obtained during post monsoon, pre-monsoon, monsoon period respectively. The high levels of BOD value from analysis indicated the nature of pollution.
Total hardness of water determines suitability of water for domestic, industrial and drinking purposes and attributed to presence of bicarbonates, sulphates, chlorides and nitrates of calcium and magnesium. The observation from water samples reveals that the total hardness value ranges between 124.5 to 605 mg/l with minimum at SW4 during monsoon and maximum at SW5 during pre-monsoon. The results shows that the average total hardness values at all station (at SW1- 435 mg/L, at SW2-477 mg/L, at SW3-391 mg/L, at SW4-377 mg/L, at SW5- 467 mg/L, at SW6-337 mg/L) found above the permissible limit from the value recommended by the WHO for different water use. These deviations are due to different sources of pollutions at different sampling station. The registered low and high values at six station were 395 mg/L (monsoon) to 475 mg/L (pre-monsoon) at SW1, 412 mg/ L(monsoon) to 515 mg/L (pre-monsoon) at SW2, 255 mg/L (monsoon) to 465 mg/L (pre-monsoon) at SW3, 124.5 mg/L (monsoon) to 514 mg/L (pre-monsoon) at SW4, 221.6 mg/L (monsoon) to 605 mg/L (pre-monsoon) at SW5, 213.5 mg/L (monsoon) to 405 mg/L (postmonsoon) at SW6 indicating water at all station are hard water.
The salts of sodium, potassium and calcium contribute chlorides in water. Large contents of chloride in freshwater is an indicator of pollution [58]. Average chloride value obtained in the studied area ranges from 37 mg/L at SW2 to 447 mg/L at SW6. Though all the average values are well below the recommended standard, but the values of chloride at SW3 (412 mg/L), SW4 (337 mg/L), SW5 (400 mg/L) and at SW6 (447 mg/L) reflects that the water from these sampling station are heading towards chloride pollution. In fact it is observed that at SW3 during post monsoon period, the obtained chloride value was 620 mg/L (Table 2), which indicates water pollution due to chloride whereas during premonsoon period (560mg/L) quality of water is near the line of chloride pollution. At SW6 during pre-monsoon and post monsoon period the obtained chloride value was 550 mg/L and 580 mg/L respectively which indicates water pollution due to chloride which may be possibly due to pollution sources such as domestic effluents, fertilizers, surface runoff, sewage water and industrial effluent.
Nitrate concentration in water depends upon the activity of nitrifying bacteria. Nitrate contributes to freshwater through discharge of sewage and industrial wastes and run off from agricultural fields [64].
The highest amount of nitrate concentration was known to support the formation of blooms [65]. The average value of nitrate recorded in the water samples during the year 2012-2013 at six different stations, at SW1 34 mg/L, at SW2 33 mg/L, at SW3 29 mg/L, at SW4 27 mg/L and at SW5 35 mg/L (Table 2) shows the value are well below the desired limit (as per IS 2296-1982, 50 mg/L) even during all three studied period except at SW6. At SW6 highest nitrate value of 53 mg/L is observed during pre-monsoon period but the average value at SW6 is 37 mg/L. These values of nitrate at all sampling points reflects that no algal bloom or very less algal bloom presence in those water sample from six stations.
Oil and Grease present in the water samples represent the contamination caused by the petrol, diesel and other hydrocarbon fractions spilled from the machinery and washed down by rain. The average value for oil and grease content in the water samples of six location ranges between 0.006 mg/L at SW4 to 0.18 mg/L at SW6. Presence of Oil & Grease indicates an extreme water pollution as it can pollute the whole water table and can significantly make the water unfit for drinking purposes. The study shows that the average value of Oil & Grease at sampling location SW1 was 0.17, at SW2 0.1, at SW3 0.16 and at SW6 0.18 which are in higher sides with comparison to IS 2296 standard (0.1 mg/L), which Indicates poor water quality at those locations. This was expected because of heavy mining activity and large number of vehicular activity, machinery activity .Higher values of Oil & Grease were registered during pre-monsoon (0.3 mg/L) and postmonsoon (0.21 mg/L) at SW1, during pre-monsoon (0.21 mg/L) at SW2, during pre-monsoon (0.24 mg/L) and post-monsoon (0.21 mg/L) at SW3, during pre-monsoon (0.2 mg/L) and post-monsoon (0.3 mg/L) at SW6 (Table 2).
Sulphate ions does not affect the taste of water if present in low concentration, but imparts a slightly milder taste to drinking water than chloride. No significant taste effects were detected below 300 mg/L [66]. The average sulphate concentration at six different station fluctuates between 13.6 mg/L at SW5 to 104 mg/L at SW1, indicating SO42- concentration is well within the prescribed limit. The highest value of 135.6 and 121.4 mg/L was observed at SW1 during pre-monsoon and post-monsoon period where as at other places and even in any studied period the observed value SO42- was below the 100 mark. The lowest SO42- value of 7.5 mg/L was noticed at station SW4 during post monsoon period.
It is found from different study that increase in metal concentration in water have adverse health effect either by directly [31,35] or indirectly [35-37]. Excess iron is an endemic water quality problem in many parts of India [23]. Iron is an abundant element in the earth’s crust, but exists generally in minor concentrations in natural water systems. The observed value for iron present in table 2 reveals that the values are <25 mark which is well below the desired limit as per (IS 1982) even during any studied period except at SW2 during monsoon period (35.4 mg/L). This higher value of iron results were due to surface runoff of water from mining area. The average observed value for all sampling station ranges from 1 mg/L at SW5 to 19 mg/L at SW2.
Manganese is commonly found in water and is an essential element required in small amounts by all living organisms. All stream water during study period shows Mn concentration in far below the recognized standard as per (IS 1982). Mental diseases like alzheimer’s and manganism are the caused due to intake of drinking water containing high concentrations of Mn [67]. High Mn contamination in drinking water also affects the intellectual functions of 10-year-old children [68]. In the present study the values are ranging from 0.008 mg/L at SW5 to 0.3 mg/L at SW1. At other station the recorded average value for Mn were 0.17 mg/L (at SW2), 0.12 mg/L (at SW3), 0.09 mg/L (at SW4) and 0.01 mg/L (at SW4). The results show that manganese concentration in water at SW1 station during pre-monsoon (07 mg/L) was above the maximum permissible limit. Manganese in water supposed due to weathering of manganese bearing minerals and rocks. Except this point and period the Mn value was well below the desired limit.
Fluoride (F–) occurs in almost all waters from trace to high concentrations. Small amount of it is beneficial for human health for preventing dental cavities but consuming fluoride contaminated water (>1 ppm) cause fluorosis. Human health risk is associated with higher concentration of fluoride content in water [69]. There are evidences of tooth mottling, bone deformities and skin diseases [70] due fluoride pollution. The fluoride content in drinking water should be in the range of 0.5 to 1.5 ppm [71]. The continuous intake of fluorides causes permanent inhabitation of growth [72-74] “Implications of fluoridean endless Uncertainty”, Journal of Environmental Biology, 23:81-87.). The concentration of fluoride in groundwater is principally governed by climate, the composition of the host rock and hydrogeology [75- 83]. Fluoride is released to the soil and groundwater by the process of weathering of primary rock or leaching of landfill contaminants [75]. The observed data in Table 2 reveals highest average F- value of 0.23 mg/L at SW1 and lowest of 0.011 mg/L at SW5 indicating water from all sampling station are well below the recommended limit of 1.5 mg/L (IS 1982). These average low values of 0.14, 0.19, 0.01, 0.12 mg/L at sampling points SW2, SW3, SW4 and SW6 respectively reflects the water is free from fluoride pollution. During three studied period, the lowest value for F- (0.001 mg/L) is observed at SW5 in pre-monsoon period where as highest value of 0.4 mg/L is obtained at SW1 during monsoon period.
Arsenic, a well-known carcinogen, is considered as one of the world’s most hazardous chemicals [84,85]. It is carcinogenic to human health even at extremely low levels of exposure (Centers for Disease Control and Prevention: Atlanta, GA, USA, 1999). Acute exposure to arsenic compounds may cause nausea, vomiting, abdominal pain, muscle cramps and diarrhoea (National Research Council: Washington, DC, [86] while chronic exposure is associated with peripheral nerve damage. Concentration of as toxic to human and aquatic life has resulted from mining activities. Arsenic (As) is introduced into soil and water during weathering of rocks and minerals followed by subsequent leaching and runoff. Excessive and long term (such as 5-10 years) human intake of toxic inorganic As from drinking water and food may result in arsenicosis, a common name generally used for As related health problems including skin disorders, skin cancers, internal cancers (bladder, kidney, and lung), diseases of the blood vessels of the legs and feet, possibly diabetes, increased blood pressure, and reproductive disorders [87].
Result from WQI
Water quality index indicates the quality of water in terms of index number which represents overall quality of water for any intended use [66]. In this study, the WQI is established from important physicochemical parameters such as pH, total alkalinity, chlorides, sulphate, nitrate, total hardness, calcium, magnesium, electrical conductivity, dissolved oxygen, biochemical oxygen demand, total dissolved solids and total suspended solids. The average values of obtained WQI from the different sampling stations were found to be varied from 8.6 to 222.7 (Table 2) .The result shows that the WQI at sampling stations SW1 (126.6), SW2 (222.7), SW3 (105.2), SW6 (156.6) were in higher side and quality of water is very poor which is not suitable for drinking or other use (Table 3). The obtained WQI score for sampling stations SW1, SW2, SW3, SW6 indicates restricting possible use of water for Irrigation (Table 3). The observed range of WQI at sampling stationSW1 during studied period ranges from 10.9 to 244 which reveal that in monsoon the water quality was excellent(WQI=10.9) whereas during pre and post-monsoon water quality are very poor (WQI=244.6,125). Also in sampling station SW2, SW3, SW6 during pre-monsoon higher values of index value were observed (WQI=122, 138.6, 117) which reflects water was unsuitable for drinking as the quality of water was very poor (Table 2). Similarly in sampling station SW2, SW3, SW6 during post-monsoon higher values of index value were observed (WQI=512, 137, 167) which reflects water quality was very poor (Table 2). But in sampling station SW4 and SW5 the average calculated index score (WQI=8.6, 21.66) shows the WQI value fall in the categories of ‘excellent’ to ‘good’ (Table 2). In station SW4 the index score ranges between 4.47 to15.8 indicating quality of water was excellent in all three study period but in station SW5 the index score ranges between 11.98 to 27.9 indicating quality was excellent in pre-monsoon (WQI=11.98) whereas during monsoon and post-monsoon (WQI=25.1, 27.9) quality is good [89-91].
| SL.No. | WQI | Status | Possible usages |
|---|---|---|---|
| 1 | 0-25 | Excellent | Drinking, Irrigation and Industrial |
| 2 | 25-50 | Good | Domestic, Irrigation and Industrial |
| 3 | 51-75 | Fair | Irrigation and Industrial |
| 4 | 76-100 | Poor | Irrigation |
| 5 | 101-150 | Very Poor | Restricted use for Irrigation |
| 6 | Above 150 | Unfit for Drinking | Proper treatment require before use |
Table 3: Water Quality Index and corresponding water quality status [88]. Water Quality Index and corresponding water quality status [88].
Result from co-relation study
From the present correlation analysis (Table 4a-4f) it was clear that the higher values of WQI score result mainly from higher values of the water quality parameters TDS, TH, BOD, NO3-, SO42-, Cl-, Iron, F, Oil & Grease, Mn, As. Correlation study reveals there exist strongly correlation between these water quality parameter and WQI at different sampling station. At sampling station SW1 higher values of WQI was resulted from water quality parameter like TDS, TH, O&G, Mn as there exist strong positive correlation between WQI and mentioned water quality parameter with correlations co-efficients r=0.721, 0.87, 0.979, 0.948 (Table 5a). The strong positive correlation found between WQI and water quality parameter (BOD, TH, NO3-, SO42-, Mn, As) at sampling station SW2 with correlations co-efficients r=0.883, 0.61, 0.883, 0.971, 0.672, 0.985 (Table 5b) respectively. Higher value of WQI at sampling station SW3 was due to higher value of water quality parameter TDS, TH, Cl-, NO3-, O&G which was cleared from correlations study as strong correlations exist with correlations co-efficients of r=0.85,0.921,0.81,0.869,0.99 respectively (Table 5c). Though in sampling station SW4 and SW5 the quality of water was excellent and good. There also exist strong correlation between WQI and different water quality parameter. At SW4 strong positive correlation found between WQI and water quality parameter (TH, Cl-, O&G, SO42-, Iron, F-) with correlation co-efficients r=0.631,0.588, 0.995,0.97,0.79,0.987 respectively (Table 5d). Whereas correlation coefficients of r=0.547, 0.701, 0.948 (Table 5e) found between WQI and water quality parameter like TDS,F-,As respectively at sampling station SW5. At sampling station SW6 strong correlation found between WQI and water quality parameter TDS with co-relation co-efficients r=0.753 (Table 5f) .The result from Co-relation study shows strongest positive co-relation between WQI and O&G (r=0.979) at SWI, between WQI and As (r=0.985) at SW2, between WQI and O&G (r=0.99) at SW3, between WQI and O&G (r=0.995) at SW4, between WQI and As (r=0.987) at SW5 and between WQI and TDS (r=0.753) at SW6 which indicates the higher values of WQI are due to these water quality parameter at these locations [92,93].
| SW1 | Water quality parameter(x) | |||||||||||||
|---|---|---|---|---|---|---|---|---|---|---|---|---|---|---|
| pH | Colour | TDS | DO | BOD | TH | Cl- | NO3- | O & G | SO42- | Iron | Mn | F- | As | |
| WQI (y) |
y=-600.6x+3900.42 | y=1.622732437+590.4731466 | y=0.145850698x-78.5006124 | y=0.91 x+97.166 | y=234.8793103x+641.8474138 | y=2.864174212x- 1145.722869 | y=-0.1044352772x+108.0399369 | y=8.495880536x- 172.3671473 | y=747.5956284x-1.169398907 | y=0.3063405142x+68.90783308 | y=-10.854842 x+175.4379256 | y=355.2028736x-.375898007 | y= -515.9043033 x+218.993229 | Y=-17223.26733x+ 265.2460396 |
| R2 | 0.9102 | 0.91905 | 0.52 | 2E-05 | 0.923 | 0.75773 | 0.0014 | 0.50529 | 0.959 | 0.00974 | 0.3333 | 0.89896 | 0.6376 | 0.864 |
| Regression coefficient (R) |
-600.6 | -1.6227 | 0.146 | 0.91 | -234.9 | 2.86417 | 0.1044 | 8.49588 | 747.6 | 0.30634 | -10.855 | 355.203 | -515.9 | -17223 |
| MLR | y=505.8630313 O&G - 78.59381709 F - 5068.012022 As+ 98.09504079 | |||||||||||||
Table 4a: Regression study of WQI with fourteen tested water quality parameter and multiple linear regression of WQI at location SW1.
| SW2 | Water quality parameter(x) | |||||||||||||
|---|---|---|---|---|---|---|---|---|---|---|---|---|---|---|
| pH | Colour | TDS | DO | BOD | TH | Cl- | NO3- | O&G | SO42- | Iron | Mn | F- | As | |
| WQI (y) | y=-31.92307692x+396.803846 | y=-1.172162874x+469.2886825 | y=0.8864754468x-306.135411 | y=140.1278539x-324.069863 | y=234.6450809 x - 413.3110834 | y = 2.719764796 x - 1086.709513 | y=-11.54883933x+ 612.7213566 | y = 21.26241526 x - 516.6068679 | y= -521.6847151x+33.1564619 | y= 6.987470276x - 182.9296598 | y=-6.950998088x+307.502992 | y = 3623.179487 x -452.214359 | y=-1417.647059x+332.6647059 | y = 14271.11111x- 58.84444444 |
| R2 | 0.00094 | 0.1881 | 0.231 | 0.07595 | 0.7809 | 0. 3732927087 | 0.36666 | 0.781 | 0.0433 | 0.942932 | 0.1593 | 0.45214 | 0.33793608 | 0.9712716 |
| Regression coefficient (R) | -31.923 | -1.1722 | 0.886 | 140.128 | 234.65 | 2.71976 | -11.549 | 21.262 | -521.68 | 6.98747 | -6.951 | 3623.18 | -1417.6471 | 14271.111 |
| MLR | y=1080.793651 Mn+28.73015873 F+12812.1164 As-228.0259259 | |||||||||||||
Table 4b: Regression study of WQI with fourteen tested water quality parameter and multiple linear regression of wqi at location SW1
| SW3 | Water quality parameter(x) | |||||||||||||
|---|---|---|---|---|---|---|---|---|---|---|---|---|---|---|
| pH | Colour | TDS | DO | BOD | TH | Cl- | NO3- | O&G | SO42- | Iron | Mn | F- | As | |
| WQI (y) | y = -206.9 x+1428.5 | y=-0.5298748507x+00.8848107 | y=0.7155851852x - 1005.828444 | y=-63.26436782x+349.3603448 | y=54.2962963x-50.73333333 | y=0.5636577247x -127.0170746 | Y=0.200946888x+4.150387298 | y=11.68536355x-253.7648725 | y=538x+16.4 | y=-6.592896781x+186.8288346 | y=-11.44205128x +199.2147179 | y=-299.0361446x+116.5439759 | y=-789.411764x +233.6382353 | y=123.3259424x+74.09223947 |
| R2 | 0.71641 | 0.3393159 | 0.7230598 | 0.5827407 | 0.149863 | 0.8485639 | 0.6563596 | 0.756254863 | 0.9809058 | 0.1638533 | 0.213624 | 0.1242119 | 0.1772939 | 0.0143494 |
| Regression coefficient (R) | -206.9 | -0.529875 | 0.7155852 | -63.26437 | 54.2963 | 0.5636577 | 0.2009469 | 11.6853636 | 538 | -6.592897 | -11.4421 | -299.0361 | -789.4118 | 123.32594 |
| MLR | y=895.9207161 F-+0.7750767263 TH+295.3772379 As-399.1515985 | |||||||||||||
Table 4c: Regression study of WQI with fourteen tested water quality parameter and multiple linear regression of WQI at location SW1.
| SW4 | Water quality parameter(x) | |||||||||||||
|---|---|---|---|---|---|---|---|---|---|---|---|---|---|---|
| pH | Colour | TDS | DO | BOD | TH | Cl- | NO3- | O&G | SO42- | Iron | Mn | F- | As | |
| WQI (y) | y=-2.288059701x+24.10492537 | y=-0.03542784456x+14.01122976 | y=-0.03895572522x+57.87034584 | y=-1.530991736x+15.07471074 | y=-19.31866667x+37.26346667 | y=0.01842725598x+1.198632139 | y=0.01726196942x+2.843999284 | y=-0.6257251908x+ 4.85351145 | y=533.1666667 x+5.136666667 | y=0.2382409396x+ 2.114497568 | y=0.1090601504x+0.931710526 | y=26.64825918 x+ 5.044405175 | y =1110.441176 x -6.633235294 | y=-585.6545155x+9.896214893 |
| R2 | 0.0 1020045129 | 0. 2711661933 | 0.457219557 | 0.032991 | 0.814001941 | 0.398907808 | 0.34621808 | 0.149158653 | 0.9920124087 | 0.941627823 | 0.625651677 | 0.078532795 | 0.975371134 | 0.224097988 |
| Regression coefficient (R) | -2.288059701 | -0.035427845 | -0.03895572 | -1.53099 | -19.31866667 | 0.018427256 | 0.017261969 | -0.62572519 | 533.166667 | 0.238240939 | 0.10906015 | 26.64825918 | 1110.441176 | -585.6545155 |
| MLR | y=-0.7578947368 pH+0.002968960864 TH+501.1005398 O&G+9.632995951 | |||||||||||||
Table 4d: Regression study of WQI with fourteen tested water quality parameter and multiple linear regression of WQI at location SW1.
| SW5 | Water quality parameter(x) | |||||||||||||
|---|---|---|---|---|---|---|---|---|---|---|---|---|---|---|
| pH | Colour | TDS | DO | BOD | TH | Cl- | NO3- | O&G | SO42- | Iron | Mn | F- | As | |
| WQI (y) | y=2.076923077x+3.700769231 | y=0.04684875384x+5.20497781 | y=0.04268166078x- 8.47554915 | y = 3.637474542x+3.15604888 | y=-6.783098592x+33.31450704 | y=-0.01746948796x+27.278912 | y=-0.04474444011x+37.538267 | y=-1.854814815x+87.69814815 | y=-194.5454545x+22.47454545 | y=-2.481769468x+52.76002052 | y=1.324837046 x+17.24172488 | y=-461.1695906x+22.29818713 | y=396.2606232 x+15.50365439 | y=171.9388388 x+6.131602379 |
| R2 | 0.004985 | 0.0285752 | 0.2999089 | 0.072193 | 0.2904146 | 0.123468 | 0.4618763 | 0.8257883 | 0.0462646 | 0.6003242 | 0.0160391 | 0.3233116 | 0.4927656 | 0.9002434 |
| Regression coefficien t(R) | 2.076923 | 0.0468488 | 0.0426817 | 3.6374745 | -6.7830986 | -0.0174695 | -0.0447444 | -1.8548148 | -194.54545 | -2.4817695 | 1.324837 | -461.16959 | 396.26062 | 171.93884 |
| MLR | y=-23.50936615 Fe+961.5606622 Mn+1575.129601 As+30.60583424 | |||||||||||||
Table 4e: Regression study of WQI with fourteen tested water quality parameter and multiple linear regression of WQI at location SW1.
| SW6 | Water quality parameter(x) | |||||||||||||
|---|---|---|---|---|---|---|---|---|---|---|---|---|---|---|
| pH | Colour | TDS | DO | BOD | TH | Cl- | NO3- | O&G | SO42- | Iron | Mn | F- | As | |
| WQI (y) | y=-46.71232877x+487.090411 | y=0.4312541473x+140.1746848 | y=0.3.192402817x- 401.7623172 | y=-40.26153846x+323.9307692 | y=-5.619172685x+188.8241628 | y=-0.2823431978x+ 66.0879624 | y=-0.08149890147x+210.500618 | y=-1.952380952x+235.4261905 | y=116.2658228 x+145.0462025 | y=1.358688315 x+129.2681707 | y=-3.790341379x+225.1733235 | y=2377.334284 x+124.8089808 | y=2051.428571x+146.7942857 | y =14.39914627x+168.767048 |
| R2 | 0.2087693 | 0.0979556 | 0.567072 | 0.1841254 | 0.2100894 | 0.3343125 | 0.0994527 | 0.7553734 | 0.1492934 | 0.0908011 | 0.7511617 | 0.3464158 | 0.0064349 | 0.031677 |
| Regression coefficient (R) | -46.712329 | 0.4312541 | 0.3.1924028 | -40.261538 | -5.6191727 | -0.2823432 | -0.0814989 | -1.952381 | 116.26582 | 1.3586883 | -3.7903414 | 2377.3343 | 2051.4286 | 14.399146 |
| MLR | y=-303.1546811 pH+1.101221167 TDS-15859.56581 Mn+550.3480326 | |||||||||||||
Table 4f: Regression study of WQI with fourteen tested water quality parameter and multiple linear regression of WQI at location SW1.
Regression study founds regression coefficients of R=355.2028736, 14271.1111, 538, 1110.44117, 396.2606232, 2377.334284 between Mn, As, F-, O&G, F and Mn water quality parameter and WQI (Table 5a-5f) at six sampling station SW1, SW2, SW3, SW4, SW5, SW6 respectively and these parameter at respective location are good at predicting WQI. Whereas MLR study (Table 5a-5f) reveals that water quality parameter: O&G, F-, As at SW1, water quality parameter: Mn, F-, As at SW2, water quality parameter: F-, Th, As at SW3, water quality parameter: pH, Th, O&G at SW4, water quality parameter: Fe, Mn, As at SW5, water quality parameter: pH, TDS, Mn at SW6 respectively are good at predicting WQI at respective different sampling points [94].
| Parameter | pH | Colour | TDS | DO | BOD | TH | Cl- | NO3- | O&G | SO42- | Iron | Mn | F- | As | WQI |
|---|---|---|---|---|---|---|---|---|---|---|---|---|---|---|---|
| pH | 1 | 0.887 | -0.48 | -0.3 | 0.84 | -0.7 | 0.124 | -0.79 | -0.925 | -0.17 | 0.327 | -0.83 | 0.648 | 0.958 | -0.95 |
| Colour | 1 | -0.73 | 0.091 | 0.91 | -0.93 | 0.26 | -0.81 | -0.886 | -0.33 | 0.531 | -0.99 | 0.926 | 0.944 | -0.96 | |
| TDS | 1 | -0.68 | -0.87 | 0.924 | 0.256 | 0.219 | 0.74 | -0.17 | -0.95 | 0.836 | -0.8 | -0.48 | 0.721 | ||
| DO | 1 | 0.24 | -0.45 | -0.29 | 0.353 | -0.02 | 0.223 | 0.735 | -0.24 | 0.385 | -0.24 | 0.004 | |||
| BOD | 1 | -0.92 | -0.17 | -0.51 | -0.974 | 0.093 | 0.78 | -0.94 | 0.797 | 0.796 | -0.96 | ||||
| TH | 1 | -0.08 | 0.577 | 0.824 | 0.171 | -0.77 | 0.975 | -0.96 | -0.76 | 0.87 | |||||
| Cl- | 1 | -0.71 | 0.167 | -1 | -0.53 | -0.15 | 0.354 | 0.371 | -0.03 | ||||||
| NO3- | 1 | 0.563 | 0.74 | 0.06 | 0.708 | -0.71 | -0.92 | 0.71 | |||||||
| O&G | 1 | -0.1 | -0.65 | 0.894 | -0.7 | -0.85 | 0.979 | ||||||||
| SO42- | 1 | 0.44 | 0.23 | -0.44 | -0.42 | 0.098 | |||||||||
| Iron | 1 | -0.66 | 0.587 | 0.264 | -0.58 | ||||||||||
| Mn | 1 | -0.94 | -0.88 | 0.948 | |||||||||||
| F- | 1 | 0.781 | -0.8 | ||||||||||||
| As | 1 | -0.93 | |||||||||||||
| WQI | 1 |
Table 5a: Correlation coefficient matrix of water quality parameter and WQI of water sample location SW1.
| Parameter | pH | Colour | TDS | DO | BOD | TH | Cl- | NO3- | O&G | SO42- | Iron | Mn | F- | As | WQI |
|---|---|---|---|---|---|---|---|---|---|---|---|---|---|---|---|
| pH | 1 | -0.545 | 0.268 | -0.21 | 0.009 | 0.303 | 0.139 | 0.359 | 0.036 | 0.145 | -0.83 | 0.575 | -0.53 | -0.16 | -0.03 |
| Colour | 1 | -0.95 | -0.67 | -0.07 | -0.96 | -0.36 | -0.79 | -0.617 | -0.63 | 0.899 | -0.93 | 0.195 | -0.28 | -0.43 | |
| TDS | 1 | 0.857 | 0.048 | 0.985 | 0.396 | 0.753 | 0.719 | 0.65 | -0.73 | 0.855 | -0.01 | 0.346 | 0.48 | ||
| DO | 1 | -0.2 | 0.784 | 0.548 | 0.415 | 0.856 | 0.385 | -0.28 | 0.479 | 0.449 | 0.195 | 0.275 | |||
| BOD | 1 | 0.214 | -0.9 | 0.671 | -0.638 | 0.789 | -0.22 | 0.411 | -0.83 | 0.916 | 0.883 | ||||
| TH | 1 | 0.237 | 0.855 | 0.589 | -0.39 | -0.43 | 0.152 | -0.05 | 0.017 | 0.61 | |||||
| Cl- | 1 | -0.06 | 0.215 | -0.19 | -0.08 | 0.001 | 0.228 | -0.02 | -0.61 | ||||||
| NO3- | 1 | 0.02 | 0.427 | -0.43 | 0.156 | -0.19 | 0.027 | 0.883 | |||||||
| O & G | 1 | -0.02 | -0.16 | 0.05 | 0.198 | -0.01 | -0.21 | ||||||||
| SO42- | 1 | -0.33 | 0.137 | -0.19 | 0.032 | 0.971 | |||||||||
| Iron | 1 | -0.15 | 0.158 | -0.01 | -0.4 | ||||||||||
| Mn | 1 | -0.16 | 0.018 | 0.672 | |||||||||||
| F- | 1 | -0.02 | -0.63 | ||||||||||||
| As | 1 | 0.985 | |||||||||||||
| WQI | 1 |
Table 5b: Correlation coefficient matrix of water quality parameter and WQI of water sample location SW2.
| Parameter | pH | Colour | TDS | DO | BOD | TH | Cl- | NO3- | O&G | SO42- | Iron | Mn | F- | As | WQI |
|---|---|---|---|---|---|---|---|---|---|---|---|---|---|---|---|
| pH | 1 | 0.227 | -0.03 | 0.167 | -0.047 | -0.021 | -0.44 | -0.137 | -0.328 | 0.134 | 0.071 | 0.118 | 0.068 | 0.068 | -0.846 |
| Colour | 1 | -0.029 | 0.16 | -0.094 | -0.196 | -0.454 | -0.104 | -0.239 | 0.196 | 0.12 | 0.192 | 0.11 | 0.007 | -0.582 | |
| TDS | 1 | -0.7 | 0.812 | 0.914 | 0.849 | 0.898 | 0.828 | -0.72 | -0.857 | -0.818 | -0.818 | 0.291 | 0.85 | ||
| DO | 1 | -0.33 | -0.918 | -0.932 | -0.922 | -0.84 | 0.742 | 0.386 | 0.641 | 0.559 | 0.464 | -0.763 | |||
| BOD | 1 | 0.559 | 0.642 | 0.092 | 0.347 | -0.765 | -0.966 | -0.846 | -0.946 | 0.456 | 0.387 | ||||
| TH | 1 | 0.974 | 0.876 | 0.946 | -0.721 | -0.62 | -0.664 | -0.676 | -0.077 | 0.921 | |||||
| Cl- | 1 | 0.804 | 0.85 | -0.857 | -0.69 | -0.807 | -0.791 | -0.157 | 0.81 | ||||||
| NO3- | 1 | 0.926 | -0.44 | -0.167 | -0.324 | -0.274 | -0.383 | 0.869 | |||||||
| O&G | 1 | -0.459 | -0.423 | -0.389 | -0.426 | -0.016 | 0.99 | ||||||||
| SO42- | 1 | 0.772 | 0.987 | 0.932 | 0.219 | -0.404 | |||||||||
| Iron | 1 | 0.845 | 0.947 | 0.449 | -0.462 | ||||||||||
| Mn | 1 | 0.971 | 0.087 | -0.352 | |||||||||||
| F- | 1 | -0.145 | -0.421 | ||||||||||||
| As | 1 | 0.119 | |||||||||||||
| WQI | 1 |
Table 5c: Correlation coefficient matrix of water quality parameter and WQI of water sample location SW3.
| Parameter | pH | Colour | TDS | DO | BOD | TH | Cl- | NO3- | O&G | SO42- | Iron | Mn | F- | Arsenic | WQI |
|---|---|---|---|---|---|---|---|---|---|---|---|---|---|---|---|
| pH | 1 | 0.261 | 0.063 | 0.055 | 0.437 | -0.014 | 0.384 | 0.245 | -0.07 | -0.193 | 0.007 | -0.54 | 0.029 | 0.587 | -0.1 |
| Colour | 1 | 0.96 | -0.71 | 0.753 | -0.958 | -0.797 | -0.499 | -0.442 | -0.341 | 0.107 | -0.924 | -0.559 | 0.934 | -0.52 | |
| TDS | 1 | -0.601 | 0.796 | -0.997 | -0.913 | -0.402 | -0.611 | -0.492 | -0.089 | -0.784 | -0.733 | 0.828 | -0.676 | ||
| DO | 1 | -0.073 | 0.647 | 0.593 | 0.961 | -0.262 | -0.397 | -0.735 | 0.726 | -0.088 | -0.575 | -0.181 | |||
| BOD | 1 | -0.749 | -0.565 | 0.191 | -0.866 | -0.852 | -0.528 | -0.638 | -0.868 | 0.792 | -0.902 | ||||
| TH | 1 | 0.931 | 0.461 | 0.565 | 0.436 | 0.035 | 0.778 | 0.698 | -0.809 | 0.631 | |||||
| Cl- | 1 | 0.484 | 0.539 | 0.377 | 0.079 | 0.518 | 0.695 | -0.539 | 0.588 | ||||||
| NO3- | 1 | -0.453 | -0.594 | -0.831 | 0.513 | -0.275 | -0.328 | -0.386 | |||||||
| O&G | 1 | 0.982 | 0.841 | 0.195 | 0.98 | -0.396 | 0.995 | ||||||||
| SO42- | 1 | 0.893 | 0.141 | 0.926 | -0.357 | 0.97 | |||||||||
| Iron | 1 | -0.314 | 0.739 | 0.093 | 0.79 | ||||||||||
| Mn | 1 | 0.281 | -0.974 | 0.28 | |||||||||||
| F- | 1 | -0.453 | 0.987 | ||||||||||||
| As | 1 | -0.473 | |||||||||||||
| WQI | 1 |
Table 5d: Correlation coefficient matrix of water quality parameter and WQI of water sample location SW4.
| Parameter | pH | Colour | TDS | DO | BOD | TH | Cl- | NO3- | O&G | SO42- | Iron | Mn | F- | As | WQI |
|---|---|---|---|---|---|---|---|---|---|---|---|---|---|---|---|
| pH | 1 | 0.967 | 0.455 | -0.867 | 0.757 | -0.855 | -0.65 | -0.48 | -0.354 | 0.092 | -0.83 | 0.031 | -0.656 | 0.308 | 0.07 |
| Colour | 1 | 0.324 | -0.719 | 0.609 | -0.758 | -0.597 | -0.555 | -0.15 | 0.152 | -0.662 | 0.162 | -0.542 | 0.439 | 0.169 | |
| TDS | 1 | -0.493 | 0.235 | -0.85 | -0.926 | -0.664 | -0.923 | -0.808 | -0.663 | -0.875 | 0.034 | 0.473 | 0.547 | ||
| DO | 1 | -0.954 | 0.804 | 0.509 | 0.122 | 0.585 | -0.11 | 0.976 | 0.087 | 0.845 | 0.115 | 0.268 | |||
| BOD | 1 | -0.591 | -0.228 | 0.159 | -0.404 | 0.367 | -0.882 | 0.14 | -0.963 | -0.374 | -0.538 | ||||
| TH | 1 | 0.919 | 0.662 | 0.75 | 0.412 | 0.88 | 0.489 | 0.375 | -0.447 | -0.351 | |||||
| Cl- | 1 | 0.865 | 0.732 | 0.693 | 0.64 | 0.683 | -0.017 | -0.706 | -0.679 | ||||||
| NO3- | 1 | 0.328 | 0.636 | 0.23 | 0.478 | -0.343 | -0.965 | -0.908 | |||||||
| O&G | 1 | 0.679 | 0.74 | 0.847 | 0.158 | -0.1 | -0.215 | ||||||||
| SO42- | 1 | 0.101 | 0.954 | -0.601 | -0.574 | -0.774 | |||||||||
| Iron | 1 | 0.297 | 0.724 | 0.023 | 0.126 | ||||||||||
| Mn | 1 | -0.388 | -0.355 | -0.568 | |||||||||||
| F- | 1 | 0.51 | 0.701 | ||||||||||||
| As | 1 | 0.948 | |||||||||||||
| WQI | 1 |
Table 5e: Correlation coefficient matrix of water quality parameter and WQI of water sample location SW5.
| Parameter | pH | Colour | TDS | DO | BOD | TH | Cl- | NO3- | O&G | SO42- | Iron | Mn | F- | As | WQI |
|---|---|---|---|---|---|---|---|---|---|---|---|---|---|---|---|
| pH | 1 | -0.891 | -0.356 | 0.997 | -0.812 | 0.969 | 0.9123 | 0.83 | 0.516 | 0.601 | 0.552 | -0.874 | 0.833 | -0.819 | -0.456 |
| Colour | 1 | 0.538 | -0.863 | 0.813 | -0.932 | -0.998 | -0.718 | -0.752 | -0.398 | -0.213 | 0.949 | -0.714 | 0.986 | 0.312 | |
| TDS | 1 | -0.292 | -0.053 | -0.572 | -0.506 | -0.716 | -0.045 | 0.522 | -0.348 | 0.739 | 0.17 | 0.494 | 0.753 | ||
| DO | 1 | -0.823 | 0.95 | 0.888 | 0.806 | 0.503 | 0.649 | 0.56 | -0.837 | 0.859 | -0.788 | -0.429 | |||
| BOD | 1 | -0.711 | -0.832 | -0.36 | -0.856 | -0.834 | -0.018 | 0.615 | -0.965 | 0.826 | -0.144 | ||||
| TH | 1 | 0.942 | 0.905 | 0.488 | 0.395 | 0.551 | -0.963 | 0.693 | -0.861 | -0.578 | |||||
| Cl- | 1 | 0.728 | 0.744 | 0.44 | 0.243 | -0.944 | 0.746 | -0.98 | -0.315 | ||||||
| NO3- | 1 | 0.085 | 0.104 | 0.8 | -0.88 | 0.391 | -0.603 | -0.869 | |||||||
| O&G | 1 | 0.532 | -0.428 | -0.518 | 0.699 | -0.838 | 0.386 | ||||||||
| SO42- | 1 | 0.103 | -0.185 | 0.925 | -0.387 | 0.301 | |||||||||
| Iron | 1 | -0.426 | 0.191 | -0.052 | -0.866 | ||||||||||
| Mn | 1 | -0.537 | 0.9 | 0.588 | |||||||||||
| F- | 1 | -0.696 | 0.08 | ||||||||||||
| As | 1 | 0.177 | |||||||||||||
| WQI | 1 |
Table 5f : Correlation coefficient matrix of water quality parameter and WQI of water sample location SW6.
The study shows presence of high values of physicochemical parameters such as TDS, Fe, Mn, O&G, As in six streams (Table 2) located surrounding iron ore mine of Suakati area of Keonjhar District of Odisha which indicates poor quality of water except location at SW4 and SW5. The WQI reveals that degradation of water quality was due to high concentrations of these parameters at different locations. Overall assessment is that almost all of the samples vary from poor to very poor category. This may be due to low volume of water, low flow condition, dense population in the catchment area and flowing of streams in the close proximity of various iron mines having lot of anthropogenic activity. The sources of contamination are soil erosion, mines run off and anthropogenic activities with extensive recreational use of the streams and the river. Mostly the quality of water was very poor during pre-monsoon and post-monsoon period at almost all sampling location indicating unfit for domestic purpose and need special attention for treatment before its use. The quality of water at some location is found unfit for public consumption purpose. The streams of this area are part of upper catchment of Baitarani river, one of the largest river of the state. The area is inhabited by poor tribal having no idea of water pollution thus aggravating the problem. Thus there is a need of necessary efforts to overcome the problem of pollution for maintenance of healthy aquatic ecosystems and its balance in this area. There is an urgent need for proper management to check the human activities along the streams and river/river catchment along with public awareness to ensure its minimal negative impact on the water body. Further study is needed to find out whether the metal content are accumulating in agricultural product or not, as water is used in irrigation purpose. Deforestation should be strictly enforced to check the massive soil erosion at mining surrounding area. Similarly plantation along with coir-mattering should be practised on overburden dump site to check soil erosion. The present baseline information of the physico-chemical parameters of water samples would form a useful tool for further ecological and environmental assessment and monitoring of these water ecosystems, leading to the safe survival of the inhabitants in the study area.