Journal of Geography & Natural Disasters
Open Access
ISSN: 2167-0587
ISSN: 2167-0587
Research Article - (2017) Volume 7, Issue 3
Earth is one geological system, embodying all the smaller subsystems into one interconnected system. The relationship between living organisms and the environment are part of an ecological systems complexity. Development planning involves more than considering individual resources. It focuses on the natural systems and ecological processes that sustain the resources. The challenge in developmental planning is to balance the short term demands for goods and services with the long term sustainability of ecological systems. Developing countries like India are under a lot of pressure to compete economically with developed countries and their industrial advancements are damaging as well. The study includes within its frame work the existing scenario and potentialities in the fields of agriculture, forestry Minerals and industries etc., and recommended for the development of these sections on an optimal basis.
Keywords: Analysis; Ecological systems complexity; Crop combination; Crop intensity; Crop concentration; Crop diversification
The concept of integrated approach for development of an area is attaining importance over the past decade. It includes the aspects of spatial and functional integration. The spatial component includes in it the themes which are directly related to land, like physiography, climates, soils land use, vegetation etc., the functional component includes all the aspects of social and economic activities like agriculture, livestock industries etc., which influence the life of people. Change in priorities of one sector will influence the other sector. Any proposed change for development has to thoroughly investigate each of the above component and its inter relationship. Thus, the context of development when, new alternative activities and proposed the location of such function become extremely important. Planning for land use is not an end in itself. It is a means to achieve other goals and objectives. The procedural aspect to be followed to transform the goal and objectives into reality are crucial. For accomplishing these objectives, it is essential to have a continuous flow of natural resources information of a region, up to the village level ear marking the profile of the region in relation to the basic objectives to formulate strategies for developmental planning. While planning for sustainability of natural resources a lot of importance should be given for analysis of natural phenomena such as land use, Hydro Geomorphology, Slope, Soil etc., because these phenomena have an instantaneous effect on environment. This will increasingly depend on the efficient use of the present expertise available. To meet these needs new ecological approaches, technical solutions, economic consideration and social attributes should be considered for planning, preparing managing and implementing these natural resources development programmes
Location and extent of the study area
The study area i.e. Mulugu Division was situated within Warangal District of undivided Andhra Pradesh (now in Telangana) is bounded by Karimnagar District in the North, Medak District in the West, Nalgonda district in the South and Khammam District in the East. The Study Area extends between 17.9957°N and 18.6097°N Latitudes and 79.5593°E and 80.6665°E Longitude. There are 13 mandals in the Division (Figures 1 and 2) [1].

Figure 1: Location of Mulugu Division in Warangal District.

Figure 2: Slope Map of Mulugu Division Represented in Degrees.
Physiography
Mulugu division, which is part of the Warangal district, is located in the table land of Deccan and long hill ranges are not very common in this division. However, the characteristic topography of the Deccan, like rocky clusters and isolated peaks, are also found in this division. The Deccan trap is found in the Northern Frontier and the rock clusters relate to the Archean group. These geological formations contain a rich source of mineral deposit that include clays, iron ore, manganese and soap stones. Two major rivers water this division.
The water of the Maneru and the Godavari rivers are used for irrigation in this division. There are also a good number of streams, ponds, wells and manmade tanks which are used for irrigation [2].
As there is a rich source of irrigation, the main occupation of the people of this division is agriculture. Paddy, Sugarcane and Cotton are grown to a large extent because a major portion of the division is covered by black cotton soil and sandy soil. Most of the area is under forest cover and this plays a very crucial role in shaping the economy of the division. Unfortunately, although the division is covered to a large extent by the forest belt and has a rich forest resource, this is not made to use, optimally.
Objectives of the study
• To classify the terrain according to land system, land forms and soils after identifying the physical base of the division.
• To investigate the various types of water resources that are available and how they are optimally utilized. Making use of qualitative and quantitative data for analysing the structure of land use and land cover.
• To study the cropping pattern their spatial variations and to correlate this with the physical base.
• To calibrate the potentialities of industries that is based on resources and their stages of development.
• An attempt to design an Action Plan for the development of the Division.
Hypotheses of the study
• Agriculture in the Division depends on the Minor Irrigation facilities and Rainfall.
• The Cropping Pattern of the Division is determined by the quality of Land and Soil Characteristics.
In the current research, the data for the taken set of periods between 2000-02 and 2010-12, has been collected from two major sources viz. Primary and Secondary. The third type of data was derived from the primary and secondary data after several processing and evaluations. Altogether the Secondary data and the Derived data were always verified with the Primary field data collected in real time from the Study Area (Mulugu Division of Warangal District). Then the analysis was undertaken to get the optimum result of the research. The Primary data was collected from the Study Area through GPS and DGPS Survey as well as statistical surveys. The Secondary data was further subdivided into four sub categories and were collected from different Government authorities. Those are Statistical, Geological, Topographical and Remotely Sensed data. Coming to the Statistical Data, the Agricultural Data was collected from the Directorate of Agriculture, AP. The Water Resources and Irrigation data were collected from the Central Ground Water Board and Irrigation and Cad Department, Irrigation Wing, AP. Most of the other statistical data and the Soil Information were collected from the Directorate of Economics and Statistics, AP. The forest data was collected from the “AP State Forest Report, 2013” published by “State Forest Department, AP”. Industrial data was collected from the Statistical Report of the Ministry of Industrial Development, AP. Geological toposheets of 1:50000 scale was collected from the Geological Survey of India (GSI) and the topographical information was extracted from the toposheets of 1:50000 scale, collected from the Survey of India (SOI). More over the Remote Sensing technology has been used vastly to extract the Resource Information and to prepare the Resource Information System Database (RIS). Multi-seasonal Scenes of the Landsat-7 Enhanced Thematic Mapper (ETM) and Landsat-5 Thematic Mapper (TM) were collected from the official United States’ Geological Survey (USGS) database, for the period of 2000-02 and 2010-12 respectively to prepare the LULC maps. Again, to prepare the Relief and Slope maps the Global 1cS (30 m) DEM Satellite Scenes were collected from the Japanese Database of ASTER (Advanced Space borne Thermal Emission and Reflection Radiometer) Satellite.
The “Derived Data” is a result of several complex processing and management of these Primary and Secondary Data which includes most part of the Methodology and its Stages. In this process, well configured High-end computer hardware and several GIS (Geographical Information System) software were used. The statistical data were analysed using several quantitative techniques and geostatistical theories and were processed using IBM SPSS (Spatial Statistics Software) for accurate and errorless evaluation to meet the required results. Further these Statistical data, also, were compared and matched with the Data, collected during Field Survey. The L1 (Level-1) Ortho-geo-rectified satellite Scenes of Landsat-5 and 7 were further matched with the GCPs (Ground Control Points), collected during the Field DGPS (Differential Geographic Positioning System) Survey. Then using ERDAS Imagine, a high capable IP (Image Processing) software, the satellite scenes were processed. Using “Supervised and Non- Supervised” classification technique, the scenes were processed and the possible Land use/ Land cover classes were extracted from raster to vector format. There the specific spectral signatures of different earth features were used to distinguish the various classes and the samples, known as “training sites” were also cross verified with the sample training sites which were collected during the field DGPS survey. Then the data was converted into vector format, using ArcGIS, a high capable Geo-Statistical software from ESRI (Environment System Research Institute, USA), all the feature classes were further processed to manage the errors and finally the LULC maps were prepared for analysis after post processing. Multi temporal LULC data were compared for the change detection and percentile calculation. After the LULC were derived from the satellite scenes, using the statistical data, the multi-temporal CC (Crop Combination), CI (Crop Intensity) and II (Irrigation Intensity) maps were prepared for quantitative and qualitative analysis.
Relief, slope and aspect maps were prepared using ASTER Global DEM (Digital Elevation Model) for terrain study. Also, it was rectified by using the GHPs (Ground Height Point) of the “Toposheets” collected from SOI which helped in understanding the flow direction of the surface water within the Study Area. Groundwater data, collected from CGWB (Central Ground Water Board), were used to understand the availability of groundwater for dug well, bore well or other means of lift irrigation facilities to the agricultural fields. Geological toposheets were used to study the chemical contents and the pH condition of the soil of the agro-fields which means the FISSAL Database, (Fertility Information System of the Agricultural Lands) to identify the FCSC (Fine Cultivable Soil Covers) within the Study Area and also to locate the Mineral Resources and its distribution within the Division. Forest Resource and its distribution pattern and percentage was extracted from the processed satellite scenes as well as from the State Forest Department report book of AP State Government, 2013.
This way the complex investigation of the research was carried out for two sets of periods of 2000-02 and 2010-12 for the Division of Mulugu of Warangal District in Telangana, mainly focussed on five techniques viz. Crop Combination, Intensity of Cropping, Crop Concentration, Crop Diversification and Ranking of the Crops.
Crop combination (CC)
The study of crop combination gives us the relative position of crops on divisional scale. Farmers grow crops in varied physical and cultural conditions. The pattern of crop combination gives the predominance of certain crops or combination resulting in the emergence of crop regions. In the present study, an attempt is made by using Coppock’s Least Square method.
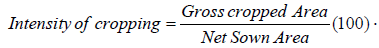
Crop intensity (CI)
For a specific crop the cropping intensity each numbers of times that crop is grown in one year on the same field, the following technique has been use to determine the Crop Intensity.
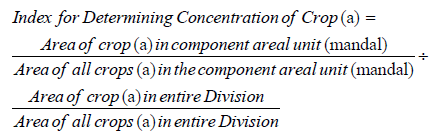
Crop concentration (CCnt)
Crop Concentration means the variation of density of any crop in a region at a given point of time. It largely depends on its terrain, climate, soils and agriculture practices of the farmers. As per Bhatia, the following technique is used to determine the Crop Concentration for the study area:
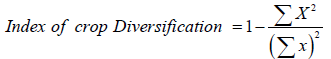
Crop diversification (CD)
The nature of Crop Diversification is examined through the changes in the allocation of land towards the cultivation of different crops grown over the years. In order to identify the spatial pattern of the Crop Diversification, the quantitative techniques proposed by Gibbs and Martin was used [3,4]. The formulae is as follows:
Major findings
From the data received through the satellite it becomes obvious that there is an innate relation between the land forms and land systems and the topographical maps from Survey of India and the DTM prepared from ASTER products, depict the components and the pattern of slope (Figure 3) which indicates that landforms are closely related to given land systems. Figure 4 shows the slope of the Division (Table 1) [5,6].

Figure 3: Major land forms in Mulugu Division.

Figure 4: Graph -Comparative status of Irrigation Intensity between 2000-02 and 2010-12 for Mulugu Division.
| Soil Categories | Area of the Division in Ha. | Area under the specific Soil Type in Ha. | Percentage to the Total Division |
|---|---|---|---|
| Clayey to gravelly clayey moderately deep Dark brown soils | 448949 | 71764 | 15.98 |
| Deep black clayey soils | 448949 | 31011 | 6.91 |
| Fine loamy gravelly clayey shallow Reddish brown soils | 448949 | 19519 | 4.35 |
| Light grey deep sandy soils | 448949 | 5751 | 1.28 |
| Loamy to clayey skeletal deep reddish brown soils | 448949 | 102615 | 22.86 |
| Loamy to gravelly clay deep dark reddish brown soils | 448949 | 1058 | 0.24 |
| Moderately deep calcareous black soils | 448949 | 66024 | 14.71 |
| Moderately deep calcareous moist clayey soils | 448949 | 30035 | 6.69 |
| Shallow gravelly Red soils | 448949 | 109366 | 24.36 |
| Unclassified | 448949 | 9298 | 2.07 |
| Water Body | 448949 | 1792 | 0.40 |
| Settlement | 448949 | 711 | 0.16 |
| Total | 448949 | 100.00 |
Source: Directorate of Economics and Statistics.
Table 1: Area and percentage occupied by major soil types of mulugu division.
The following classes of the terrain were identified from classified Remotely Sensed Imageries after feature extraction and post processing and were cross verified by ground truth in field visit mode (Table 2). The Mulugu division has a variety of landforms composed of igneous, sedimentary and metamorphic rock formations [2,7-9].
| Major Landforms | Division Area in Ha. | Class Area in Ha. | % age to the Division Area |
|---|---|---|---|
| Floodplain | 448949 | 70707 | 15.75 |
| Pediment Inselberg Complex | 448949 | 45962 | 10.23 |
| Pedi plain Weathered | 448949 | 245007 | 54.57 |
| Residual Hills | 448949 | 60589 | 13.49 |
| Drainage and Water bodies | 448949 | 26682 | 5.94 |
| Sum Total | 448949 | 448949 | 100.00 |
Table 2: Percentage of area under various landforms in Mulugu division.
Major four sources of irrigation found in the Division are Canals, Tanks, Wells and other sources provide water facility to the agriculture and allied activities. Amongst these four sources “Wells” are the chief sources of water supply to the agricultural lands within the Division. Next to “Wells” it is tanks which are the second most source of water supply for the purpose irrigation in the Division. The following Table 3 shows the total irrigated area under various sources of irrigation for the years 2000-02 and 2010-12 revealed that the area under canal irrigation was seen mostly in the Mandals of Shayampet, Mangapet, Regonda and Parkal. Whereas Wells and Tanks provided the major sources of Irrigation for the Division. Very few Mandals showed Lift Irrigation and other sources of Irrigation. Only three Mandals within the Divison (Mangapet, Parkal and Regonda) were under canal irrigation which was less than 5% for Parkal and Regonda between the years 2010-12. Rest of the other Mandals were dominated by Tank and Well Irrigation. Very few Mandals were under Lift and Other sources of irrigation [10-12].
| Total Irrigated Area | 2000-2002 (Avg.) | 2010-2012 (Avg.) |
|---|---|---|
| Canals | 3539.17 | 1296.5 |
| Tanks | 61408.8 | 18342 |
| Tubewells | 16059.4 | 24256 |
| Dugwells | 71798.2 | 29285 |
| Lift Irrigation | 499.767 | 151.5 |
| Other Sources | 1438.25 | 1012.5 |
| Net Irrigated Area | 66122.90 | 90130.00 |
| Gross Irrigated Area | 111968.00 | 76083.45 |
Source: Directorate of Economics and Statistics.
Table 3:Area under various sources of irrigation for two sets of years in Mulugu Division.
Agricultural development is highly influenced by the Intensity of Irrigation. It is the percentage ratio of gross irrigated area to the net irrigated area. It is found that only Eturnagaram Mandal showed Very High Intensity of Irrigation within the Division and High Intensity was seen in two of the Mandals viz. Tadvai and Govindaraopet. Whereas Moderate intensity was found in Bhupalpalle Mandal and rest of the nine Mandals showed Low intensity. Coming to the period of 2010- 12, it can be noticed that Govindaraopet and Venkatapur Mandals showed Very High Intensity of Irrigation which were High and low correspondingly during the previous set of years. It is because of the increase in the number of Dug wells and Tube wells. Eturnagaram Mandal remained at the same level of intensity which was very high. It is also found that because of the increase in the number of Dug wells and Tube wells in the Mandals of Ghanpur and Mangapet, these Mandals showed High Intensity which was low during the previous set of years. In the Moderate category, Bhupalpalle Mandal remained at the same level but Tadvai Mandal moved from High to moderate and Mogullapalle moved from low to Moderate. Rest of the Mandals remained at the same level of intensity that is Low. The following Graph clearly depicts a comparative status of the Intensity of Irrigation for two set of periods in the Division (Table 4) [3,4,13].
| Sl. No | Crops | 2000-02 | 2010-12 |
|---|---|---|---|
| 01 | Paddy | 43.07 | 25.98 |
| 02 | Maize | 9.19 | 5.78 |
| 03 | Total Pulses | 2.49 | 4.96 |
| 04 | Chili | 9.80 | 9.55 |
| 05 | Groundnut | 2.45 | 0.59 |
| 06 | Sesamum | 0.60 | 2.33 |
| 07 | Cotton | 29.20 | 0.24 |
| 08 | Fruits and Vegetables | 0.79 | 48.40 |
| 09 | Others | 2.41 | 2.17 |
| Total | 100.00 | 100.00 |
Source: Directorate of Economics and Statistics.
Table-4: Cropping Pattern of the Division in percentage for two sets of Years.
Ranking of crops gives an insight in the geographical reality of cropping structure. Table 4 revealed that the crops like fruits and vegetables and pulses have registered a phenomenal increase during the sample period and the cotton crop register a drastic decline.
Crop intensity
“Intensive cultivation” implies multiplicity of cultivation on the same plot of arable land. It involves “double” or even “triple” cropping.
It is observed that in the Study Area for the years 2000-02, the mandals of Eturnagaram, Govindraopet and Mangampet show high degrees of crop intensity. It is because of the assured water supply either from the rivers, canals or perennial Waterbodies. Hence most of the land is under cultivation in both Kharif and Rabi season. The mandals like Bhupalpalle, Ghanpur and Tadvai showed moderate intensity. It is because, most of the geographical regions of the mandals Tadvai and Bhupalpalle are uplands, although assured surface water is available but because of the land undulation the supply is improper. Remaining seven mandals showed low to very low crop intensity. It is all because of unassured irrigation, forest cover, hilly and high lands etc.
The results for the period 2010-12 shows that the mandals of Eturnagaram and Mangampet showed a high degree of crop intensity, whereas Govindaraopet has shown moderate crop intensity. Venkatapur also showed moderate cropping intensity which earlier was under very low category. The intensity in case of Venkatapur increased from very low to moderate because of the change in crop combination and good irrigation. In course of time the intensity of Bhupalpalle has fallen from moderate to very low. The growth of mining activity and the maximum usage of available ground water in industries have resulted in the reduction of the agricultural activity. Whereas rest of the mandals maintain their ranks as it was.
Concentration of cropped area
The degree of concentration varies spatially highlighting the differential interaction between various factors such as Physiography, Climate, and Hydrology and Socioeconomic variability of a particular region. The study revealed that during the years 2000-02 very high concentration was found in only one Mandal which is Mogulapalle. High Concentration was found in the mandals of Parkal and Shayampet. Whereas the mandals like Ghanpur and Regonda have shown moderate concentration. These mandals are found to be well irrigated and to have highly fertile soil which support the most in intensive cultivation so as the concentration. Low to very low concentration is shown in rest of the mandals as most of the mandals have maximum forest cover and infertile soil with discrete undulation of the land causing low concentration.
For the years 2010-12, it was found that the mandal showing very high and high Concentration remained unchanged after a decade also, those are Mogulapalle as Very High and Parkal and Shayampet as High. The Concentration of Ghanpur mandal also remained unchanged as moderate for both the study period. Similarly the mandals with low concentration like Bhupalpalle, Mangapet and the mandals with very low concentration i.e. Eturnagaram and Tadvai showed no change within a decade. But the mandals like Regonda, Chityal and Venkatapur have shown a slight improvement in the crop concentration from moderate to high, Low to moderate and very low to low respectively. It is also observed that Mandals like Govindaraopet and Mulugu2 are observed as decreasing in the crop concentration within a decade from low to very low.
Crop diversification
It is found that in the Division ten important crops are grown, mainly according to the type of soil and also due to the influence of the demand in the market. The ten main crops grown in the Division are, Paddy, Jowar, Maize, Pulses, Chili, Fruits and Vegetables, Groundnut, Sesamum, Cotton and Other. For the year 2000-02 the high degree of Diversification is found in the mandals of Parkal, Bhupalpalle and Shayampet. It can be attributed to the socioeconomic and cultural factors, poor management practices accentuated by rainfall deficit resulting in low productivity. Moderate degree of Crop Diversification is found in the mandals of Chityal, Mogulapalle, Regonda, Mulugu and Ghanpur. Many of these mandals show Monoculture (Crop Specialization). Low and very low crop diversification is found in Venkatapur, Eturnagaram, Tadvai, Mangampet and Govindraopet. In Figure 4 for the year 2010-12, high diversification is being shown by the mandals of Mulugu2, Eturnagaram, Shayampet, Bhupapalle and Ghanpur. Moderate crop diversification is found in the Mandals of Govindraopet, Tadvai and Parkal. Remaining mandals showed low to very low Crop Diversification.
It is obvious from the above discussion that cultivation is more intense, stable and highly productive in crop specialization (Low Diversification) areas where irrigated agriculture is common. In the highly diversified cropping areas agriculture is characterized by low productivity, uncertainty and inferior cropping system, because of risks generally associated with rained farming.
Crop combination
For the year 2000-02
Monocrop combination: it is clearly understood that, out of thirteen mandals of the division, four mandals exhibited monoculture. Those are Govindraopet, Eturnagaram, Tadvai and Mangampet. The main crop in these mandals is Paddy.
Double crop combination: The mandals of Bhupalpalle, Regonda, Mulugu2, Ghanpur and Venkatapur exhibited two crop combination. The combinations are Paddy, Cotton and Maize.
Tri crop combination: Mogulapalle and Shayampet have exhibited three crop combination. The main crop combinations for these mandals are Cotton, Paddy and Maize.
Quad crop combination: Chityal and Parkal mandals exhibited the four crop combinations within the division. And the main crop combinations for these mandals are Cotton, Paddy, Maize and Chili.
For the years 2010-12
Monocrop combination: A slight variation in the monoculture is observed in relation to that of 2000-02. The main crop combinations are paddy or cotton. And it is seen in the mandals of Bhupalpalle, Mangampet, Regonda and Chityal.
Double crop combination: It was found in the mandals of Parkal, Mogulapalle and Venkatapur. The main crop combinations for these mandals are Cotton and Paddy.
Tri crop combination: Tadvai and Govindraopet mandals exhibited three crop combinations which are Paddy, Cotton and either Maize or Pulses.
Quad crop combinations: This type of crop combination was found in Ghanpur, Mulugu, Shayampet and Eturnagaram mandals of the Division. The crops in this combination are Paddy, Cotton, Chili and Spices.
From the Tables 5 and 6, it can be seen that, among the large and medium scale units (Mainly Agro based units) of the division, occupy number of units and investments. Although the industrial the first place in structure of the Division is diversified, Agro based industries account nearly half of the entire industrial units of the division in both the time periods. Apart from large scale units, the small-scale units of the Division also have offered a major part of employment to the industrial sector. The poor industrial development of the study area is a remarkable indicator for the economic backwardness of the division in general. The foregoing analysis highlights the existing industrial pattern and the type of industries to be developed in the division.
| Sl. No. | Name of the Industry | Units | %age | Workforce | %age | Capital Investment (RS. in Millions) | %age |
|---|---|---|---|---|---|---|---|
| 1 | Agro based | 119 | 29.60 | 383 | 35.43 | 48.45 | 51.54 |
| 2 | Forest based | 53 | 13.18 | 139 | 12.86 | 11.11 | 11.82 |
| 3 | Mineral and Cement based | 14 | 3.48 | 94 | 8.70 | 12.05 | 12.82 |
| 4 | Leather based | 7 | 1.74 | 16 | 1.48 | 0.70 | 0.74 |
| 5 | Others (Engineering, Elec., Chemical, Cottage etc.…) | 209 | 51.99 | 449 | 41.53 | 21.69 | 23.07 |
| 6 | Total | 402 | 100.00 | 1081 | 100.00 | 94.00 | 100.00 |
Source: Commissionerate of industries, Government of A.P 2012.
Table 5:Classified resource based Industrial Units, Workforce and Capital Investments in Mulugu Division (2000-02).
| Sl. No. | Name of the Industry | Units | %age | Work force | %age | Capital Investment (RS. in Millions) | %age |
|---|---|---|---|---|---|---|---|
| 1 | Agro based | 26 | 32.91 | 308 | 55.69 | 147.24 | 66.25 |
| 2 | Forest based | 0 | 0 | 0 | 0 | 0 | 0 |
| 3 | Mineral and Cement based | 11 | 13.92 | 112 | 20.25 | 44.76 | 20.14 |
| 4 | Leather based | 0 | 0 | 0 | 0 | 0 | 0 |
| 5 | Others (Engineering, Elec., Chemical, Cottage etc.…) | 42 | 53.16 | 133 | 24.05 | 30.22 | 13.60 |
| 6 | Total | 79 | 100.00 | 553 | 100.00 | 222.22 | 100.00 |
Source: Commissionerate of industries, Government of A.P 2012.
Table 6: Classified resource based Industrial Units, Workforce and Capital Investments in Mulugu Division (2010-2012) Sl. No.
Keeping in view the backwardness of the division, which is endowed with abundant resources, a future landuse model for planning purpose has been suggested for the maximum utilization of land resources (Figure 5). The basic objectives kept in mind in preparing an optimum landuse model based on the parameters of physiography, soils, drainage, ground water potential and existing landuse pattern, is to delineate land utilization categories for their usage for which they are well suited on the basis of the above study, “Evaluation and Analysis Of Resources For Development Planning In Mulugu Division, Warangal, Telangana, India”, categories of land have been identified for certain kinds of preferred activities (Table 7). Land is the most important productive resource amongst all other available resources on the planet. An adequate and proper utilization of it can give the optimum benefit for the livelihood and sustainability of human beings on earth [14-22].

Figure 5: Action plan for suggested land use in Mulugu Division.
| Mulugu Division Optimum Land Use Plan | ||||||||
|---|---|---|---|---|---|---|---|---|
| Sl. No. | Land System | Geomorphic Unit | Rock Type | Slope | Soil | Surface Water | Present LULC | Proposed Landuse |
| 1 | The Hill System | Group of Massive Hills occupies the North-West to South-Central part of the Study Area with Broad Valley Floors accounting to 13.5%. | Peninsular Gneiss and Granites. | Varying from 15° to 45° except on the Steep Hill Submits (60°) and Valley Floors 0°. | Dark Brown, Gravelly and Deep Black Clayey Soils cover surrounding the Hilly Regions. Deep Sandy Soil spread is found along the Valleys and Surface water bodies. Skeletal Deep Reddish Brown Soils are seen along the Hills. | Zones of Heavy run off are mostly perennial and Major Three Perennial and non-perennial surface water bodies fall within this zone. | Land cover with few patches of Dry to Moist Deciduous Forest and Scrubs are also found here and there. Rest of the plain land agriculture is encroached. | Suitable for Conservation and Development of Vegetation Cover- Natural and Manmade Plantation. |
| 2 | Pediment Inselberg Complex | These are found in the North-West region along the River Basin and the Residual Hills and towards the North-Central region of the Study Area. These complexes are composed of Inselbergs, Structural Ridges, Linear Ridges and Dikes. | Granite | Moderate Slopes ranging from 5° to 20° from River basins towards Residual Hills. | Calcareous Reddish Brown and Deep Clayey Skeletal Soils are mostly found in these areas. | Zone of Run off and form drainage devices. | Mostly undulating rock out plain with small hills and crops supporting degraded vegetation mostly corresponding to Dry Deciduous Species. | Suitable for the Development of the Pastures and Poultry and Conservation Practices. |
| 3 | Pedi plain Weathered | Throughout the entire Study Area these Geomorphic Units are spread almost everywhere. Both Moderately and Swallowed Pedi plain are found. | Peninsular Gneiss and massive Granites traversed by joints, fractures and faults. | Mostly Undulating slope ranging between 15° to 60°. | Deep black clayey soils, Loamy to clayey skeletal deep Reddish brown soils and Shallow Gravelly Red soils. | Zones of Run off and form drainage pattern within the Forest areas and small patches of water tanks are seen within the Agricultural lands. | Towards the western parts mostly under agriculture. Towards the Central and eastern region of the Study Area is covered by Forest. | The central part of the forest cover is suitable for Wildlife and the surrounded degraded forest should be under conservation practices. For the cultivable regions, intensive agriculture can be practiced. |
| 4 | Flood Plain | Alluvial Plains | River borne Alluvium resting over bedrock, found as a narrow stretch Major River/ Streams. | Nearly level plains. | Alluvial Soils with fine texture and clay base. | Canal Network from the River Godavari and Natural/Artificial Reservoirs proximity to the tanks to the surrounding areas. | Intensive Agriculture under canals, mostly seen under Paddy, Cotton and Maize. | Other than Paddy and Cotton, the land is suitable for Commercial Crops like Sugarcane, Sunflower, Mulberry, Bee Keeping, other crops like Wheat, Millets, Pulses and Plantation like Banana. |
Table 7: Action plan for optimum landuse in Mulugu division, Warangal district, Telangana.
Apart from the Built-up areas and Waterbodies of the division, rest of the land resources are divided into four categories, based on the land elevation (i.e. Plain, 15° to 30°, 30° to 45°, 45° to 60°), forest coverage in varying densities and tree clad areas. Since forest lands can’t be used for crop yielding but best suited for Wildlife, Animal husbandry and Poultry farming, as, very good surface water and drainage is present there within.
From Figure 5, it can be seen that the first category of lands is covered by Deciduous Dry Dense Forest with thorn trees and the lands are elevated ranging from 30° to above 60°. So, these areas are best suited for wildlife habitats. The second categories of lands identified are mostly covered by Dense Tree Clad, Scrub Forest and Reserved Forest Plantation, wastelands scrubs on red soils where the elevation ranges from 15° to 45°. Since adequate drainage devices and surface water is available in these areas hence can be used for pastures and poultry farming. Although surface water facilities are existing nearby but because of the soil infertility these can be suggested so as. The third type of lands have 15° to 30° elevation and covered by Open Deciduous Forest. This type of canopy has grown on infertile red soil and is not suitable for cropping. Even Agroforestry can’t be suggested there because of several forest protection regulations to conserve the deforestation of Southern Plateau Deciduous Dry/Moist Open Forest. So, these lands need to be conserved for Wildlife as the forest has started shrinking because of over grazing of domestic cattle. So only poultry farming can be practiced instead of pastures. The fourth and only one category of lands are found to be spread over plain lands covered by open vegetation. These areas are mostly nearby the human settlements and the area is not much spread over as compared to the other types of land classes. These lands could also be suggested to be used for pasture grazing. Although the first three types of land classes are based on the terrain elevation, but qualitatively these are suggested under three types (First three classes) of landuse which can be seen in Figure 5.
The fourth category based on the elevation below 15° form the plains. These plains are further subdivided into six classes on the basis of soil types, existing cropping pattern and surface water. These are confined to the western part of the Division which are mostly agricultural lands.
These lands are also identified as ravine wastelands and the highly undulated with low elevation. So, no food crops can be suggested for these types of lands. Only Bamboo and Anjan grass can be suggested there. Also, Agroforestry can be suggested for the best use of these lands. The first hypothesis “Agriculture in the division depends on the minor irrigation facilities and rainfall” is accepted. The second hypothesis “The cropping pattern of the division is determined by the quality of the land soil characteristics” is accepted.