Journal of Oceanography and Marine Research
Open Access
ISSN: 2572-3103
ISSN: 2572-3103
Review Article - (2016) Volume 4, Issue 1
The Volta River and its basin form about one-third of Ghana's total land area and contributes significantly to the hydrological network of the country’s river system while River Pra basin is noted for large and small scale mining activities within it. Both river systems are important for sediment delivery for beach nourishment along Ghana’s coast. This work presents the first ever estimates of the sedimentation rates at the estuaries of these rivers using 40 cm long sediment cores. Sediment accumulation rates were estimated using the 210Pb sediment dating technique which is based on alpha and gamma emitting radionuclides. The total 210Pb concentration in the sediment was measured with an alpha spectrometer while the activities of supported 210Pb and 137Cs were measured with a gamma spectrometer with high germanium n-type detector. The unsupported 210Pb was determined by subtraction of the supported from the total at each core sediment level. Irregularities in the 210Pb activity versus depth profile, indicated variation in the net sedimentation accumulation rate during the past 96 and 182 years at the Volta and Pra estuaries, respectively. From the CRS model calculations, sedimentation rates varied markedly before (1.1 gcm-2y-1) and after (0.5 gcm-2y-1) construction of the Akosombo dam resulting in about 50% drop in sedimentation rate at the Volta estuary. Sediment accumulation rates were relatively low at the Pra estuary compared to the Volta estuary. Depositional fluxes of 210Pb were 190.1 ± 15.9 Bqcm-1y-1 and 217.8 ± 11.8 Bqcm-1y-1 in Pra and Volta estuaries respectively. 137Cs profile did not show defined peaks. However, the ages and sedimentation rates were better explained using historical events and anthropogenic activities that occurred within the catchment areas, providing a better understanding of deficit in sediment budget caused by hydric erosion processes prevailing in the Ada and Keta beaches in Ghana, due to reduction of sediment input from the Volta estuary.
<Keywords: Lead-210 dating, CRS, Keta, Sedimentation rate, Coastal erosion
Coastal zones are important and sensitive areas due to their sensitivity to global or man-induced changes which are of direct socio economic importance to coastal zone management policies [1]. The zones are built through the supply of sediment mostly by fluvial origins into the coastal waters and are then entrained by longshore drift for the building up of coastal environment. Sediment mobilization into coastal waters is therefore an important process in the development and maintenance of coastal zones including wetlands, lagoons, estuaries and dunes. Any interference with the natural supply of sediment such as channeling of river water for irrigation, creation of reservoir, damming of rivers and deforestation along the banks of the rivers often leads to modification of the flow of rivers and the amount of sediment they carry. The cumulative effect could be changes in geomorphology and hydrology leading to either accretion or erosion of the shorelines. Appeaning Addo et al. have reported over 70% of world’s shorelines are experiencing coastal erosion as a result of multiple stressors on the beaches. Coastal erosion is an evident of activities impeding supply of sediment onto the coastal zone for maintaining beach front equilibrium. Generally, shoreline changes has been documented to implicates damming of major rivers; in Africa damming of Moulouya and Sebou rivers in Morocco was pinpointed as the principal cause of coastal erosion in North West Africa; Senegal River, Niger and Volta are deemed as the prime cause of erosion in West Africa; Eastern Africa coastal erosion is attributed to damming of Tana and Sabaki rivers and erosion of Central Africa coast is solely attributed to damming of River Zambezi and Incomati [1,2]. Coastal erosion is rampant but the extent of damming is not fully investigated. In Nigeria, Victoria Beach was eroded 2 km inland since the construction of breakwaters during the extension of the port in Lagos [1]. Shoreline stability is achieved through the continuous supply of sediment into coastal zones via estuaries and contiguous coasts. The coastal marine and lacustrine sediment are repositories of excellent archives to retrieve the environmental changes [3,4]. The evaluation of sedimentation rate is a tool use to check sediment delivery and sedimentation patterns as well as helping to explain changes in shoreline due to interference with the sediment supply budget [5]. The application of specific activity profiles of lead-210 (210Pb) in bottom sediment cores allows tracing of the history of pollutants delivery and quantifying sedimentation rates in coastal and lacustrine systems [3,6]. 210Pb activity in sediment chronology has two components, supported and unsupported 210Pb.
The supported fraction is produced within the sediment through 226Ra disintegration and unsupported 210Pb is incorporated to the sediment through dry or wet deposition. Once 210Pb, adsorbed onto the particles, it is deposited in the bed sediment and its activity decays with time. There is however a continuous addition of supported 210Pb by its long-lived precursor 226Ra inside the sediment matrix. The activity of the unsupported fraction of 210Pb in the sediment can be calculated as the difference between the supported and the total 210Pb activities (IAEA, 2003). In principle the age of sediment deposition can be estimated by applying conventional dating models. Practically, two standards models connecting the unsupported 210Pb specific activity profile of sediment cores with sedimentation deposition rates; the constant initial concentration (CIC) and the constant rate of supply (CRS) models [7]. The later is the most widely used either for lakes; coastal zones or estuaries where sedimentation processes are significantly influenced by anthropogenic activities.
The evident of human intervention up streams leading to shoreline changes along the coastal zones is not fully appreciated since there is no detail data to back the evidence. Therefore, the aim of this research is to use the CRS model in determining the age and sedimentation accumulation rates in relating to the cases that sediment supply into the coastal zone have varied significantly over the years a case study of the Ghana coastline.
Site description
The Ghana coastline is about 550 km and it is divided into three zones the western, central and eastern. The study was conducted at the south-western and south-eastern coastal zones at Pra and Volta estuaries respectively (Figure 1).
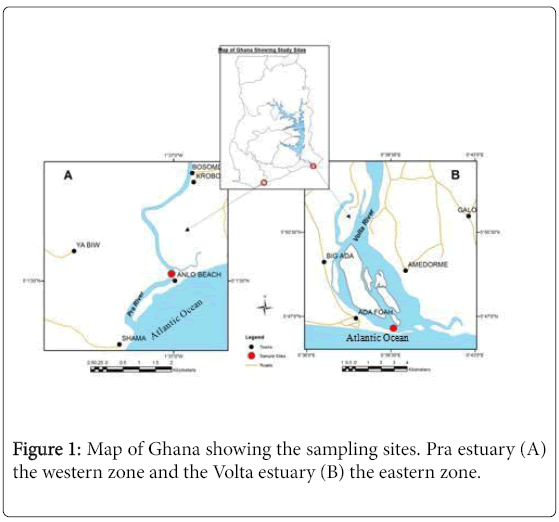
Figure 1: Map of Ghana showing the sampling sites. Pra estuary (A) the western zone and the Volta estuary (B) the eastern zone.
The Pra estuary is located in the Shama District of Ghana’s Western Region (Figure 1A) and formed the lower section of the Pra river system that originates from Birim and Offin sub-basin in the Ashanti Region of Ghana. The basin is a site for gold mining for close to a century and has the largest concentration of mines in a single area of Africa continent [8]. The drainage area is about 23,188 km2 with an estimated suspended sediment yield of 50.8 km2. The annual mean water discharge into the Atlantic Ocean is estimated at 214 m3/s loaded with about 1,139,171 tonnes of suspended sediment [9,10]. The Volta estuary on the other hand is located in the lower basin of the Volta River at Ada in the Greater Accra Region of Ghana (Figure 1B). River Volta is a transboundary system and the largest river in Ghana (total drainage area of 379,000 km2). It sources are White Volta (Bagri River in Burkina Faso), Oti River (Togo) and Black Volta (Cote d’Ivoire) in the Northern part of the country.
The river was dammed at Akosombo and Kpong in 1965 and 1984 respectively for hydro-electric power production. The construction has resulted in reducing the annual mean water flow from 1160 to 1100 m3s-1 to the Volta estuary since its commission [11].
Sample and radionuclides analyses
Two sediment cores of length 60 cm and inner diameter 8.7 cm were sampled from the Pra and Volta estuaries (Figures 1A and 1B) using Utech corer. The cores were taken at low tide by manually inserting the whole corer into the sediment and retrieved and corked at both ends. The corer and its content were stacked in a vertical position in corer rack and transported to the laboratory.
Each core was sectioned using a core slicer in the laboratory into layers of 2 cm thickness. About 0.5 cm of the outer layer of the sliced cores was discarded to minimize cross contamination among layers [12]. Wet and dry masses were determined before and after drying the samples at a constant temperature of 80°C for 48 hours in a drying oven. Bulk density of each samples were calculated using the dry weight fraction approach and equating particle density of mineral solid as 2.65 g/cm3 [13]. The samples were grounded to a fine powder using an electronic grinder and then homogenized.
The total 210Pb concentrations in the sediment were inferred indirectly by measurement of the daughter product 210Po using alpha spectrometry as described by Laissaoui et al. [14]. About 0.5 g of the homogenized sediment was weighed into a pre-acid cleaned Teflon® beaker and spiked with 50 μl of 209Po yield tracer (the certified specific activity was 0.357 ± 0.011 Bq.g-1). The samples were absolutely dissolute using a mixture of concentrated hydrochloric, nitric and hydrofluoric acid (HCl-HNO3-HF) solutions. Hydrogen peroxide solution was added for complete digesting of organic matter while heating the mixture at 80°C. The solution was further treated by repeated evaporation with HCl-boric acid solution to neutralized HF acid before filtered into a 100 ml cleaned beaker and the volume was adjusted to 80 ml with 0.5M HCl solution. Reduction of Fe3+ to Fe2+ was achieved by addition of ascorbic acid to the solution to prevent oxidized iron from interfering with the target nuclide during autodeposition. Self-deposition of polonium isotopes were carry out for four and half hours by introduction of silver disc into the 0.5M HCl acid solution and warmed at 80°C while stirring. Activities of the Polonium isotopes were measured by an ORTEC alpha-spectrometer which was interfaced with MaestroTM data acquisition software after calibration and adjustment of the energy levels to 4887 KeV (209Po) and 5.305 MeV (210Po). The gross counts and counting time were recorded for the computation of the activity of 210Po and determination of the chemical recovery.
The supported 210Pb activities, in secular equilibrium with 226Ra in each and all sections of the cores were inferred indirectly by averaging 214Bi and 214Pb activities obtained by a (n-type) high-purity germanium detector (HPGe). The activity of 214Bi was scanned at 352.9 KeV and 214Pb at 609.3 KeV photopeaks while Celsium-137was scanned at 662 KeV photopeakd. For in growth of 222Rn to attain a secular equilibrium with 226Ra, the homogenized samples were weighed and sealed in a pre-defined geometry and incubated for three weeks along with an IAEA reference material (IAEA-137). Efficiency calibration and quality control of the HPGe detector were carried out using a prepared multi-standard solution and the reference material. All the samples were counted for 24 hours and the spectra obtained were analyzed using Genie 2000 VDM software. The experimentally derived and calculated efficiency of each gamma emitting radionuclide were in close proximity with a variance between 1.8 and 3.7%. The derived polynomial equation was then employed in calculating the specific activities of 214Bi and 214Pb, both in secular equilibrium with 226Ra. The activity of unsupported 210Pb was established by subtracting supported 210Pb from the total 210Pb activities on level by level basis.
The age of each core and the sedimentation rate of the samples from the two estuarine systems were estimated by applying the CRS model to the obtained unsupported 210Pb profiles [14].
The total inventory of 210Pb (total, supported and unsupported) from each estuary is shown in (Figure 2). At the Pra estuary, the inventory of total 210Pb varies between 58.79 ± 5.47 and 16.28 ± 1.76 while supported 210Pb was between 34.22 ± 4.07 and 10.21 ± 3.00 and the unsupported 210Pb between 32.51 ± 6.5 and 0.63.23 ± 3.04 Bq/Kg (Figure 2A). The total inventories of alpha and gamma activities within the first-ten centimetres depth were fairly constant presumable due to post-depositional mixing affecting the upper layers. This could be attributed to the re-suspension and demineralization through the activity of both epifauna and infauna organisms [5]. Fishing activities within the estuary could also be possible causes of perturbation of the first-ten cm of the sediment layer. On the other hand, the total inventories of 210Pb decrease with increase in depth at the Volta estuary (Figure 2B). The total 210Pb depth profile varies between 87.01 ± 6.25 and 19.91 ± 1.61 while supported were between 25.51 ± 2.72 and 11.93 ± 1.78 and unsupported ranges between 68.75 ± 7.01 and 3.96 ± 2.94 Bq/kg (Figure 2B). Generally, the total inventories at the Volta estuary are higher than those recorded at the Pra estuary.
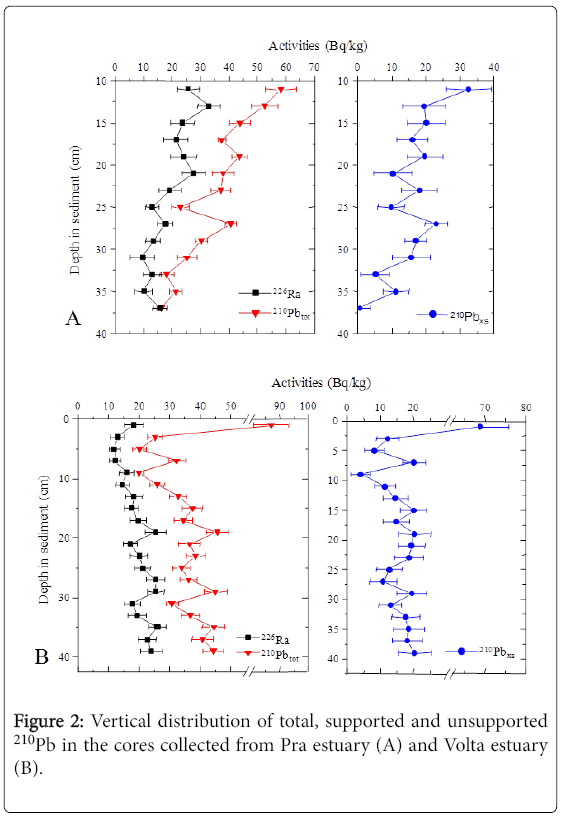
Figure 2: Vertical distribution of total, supported and unsupported 210Pb in the cores collected from Pra estuary (A) and Volta estuary (B).
The CRS model could be applied to unsupported 210Pb of the Pra estuary starting from the depth where the activity begins to decay. In this case, the highest activity of unsupported 210Pb of the Pra estuary was observed at 11 cm depth and then follows a decline in activities with depth reflecting no post-depositional perturbation or mixing of the sediment layers. This follows the general assumptions for 210Pb applications of homogeneity and steady-state conditions [7]. The CRS model also assumes that there is no diffusion and unsupported 210Pb activities decline to zero in the deepest layer.
In this way, the fist ten centimetres core activities were excluded from dating and only the rest of the profile was taken in consideration (Figure 2A right graph). Inventories of 137Cs were mostly below the limit of detection at the Pra and Volta estuaries and could not be used as a good time marker for the validation of the CRS dating results [15]. The history [3] of mining and construction of dam within Pra basin and on the Volta River were respectively used in explaining the variation in sedimentation rates.
The ages of the sediment cores at the Pra estuary span between 1829.18 ± 5.10 and 2010.14 ± 0.63 years while the Volta estuary cover between 1915.66 ± 23.75 and 2009.88 ± 0.49 years (Figure 3).
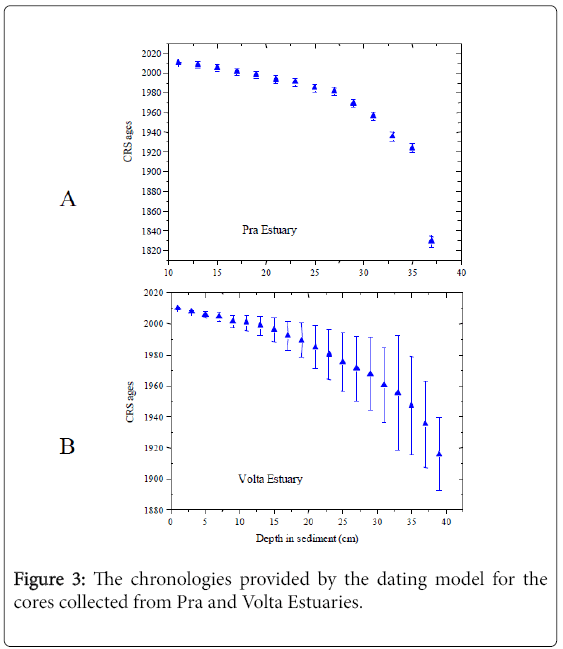
Figure 3: The chronologies provided by the dating model for the cores collected from Pra and Volta Estuaries.
The surface layer of the Pra core is about two years and the bottom (37 cm depth) is about 180 years and for the Volta the surface layer is about three years and the bottom layer (39-40 cm depth) about 94 ± 23 years old at the time of coring. The ages of the sediment layers from both locations were within similar time spans. The age intervals between the bottom layer and next layer (35 cm depth) is about 95 years and subsequent intervals were relatively uniform at the Pra estuary (Figure 3A) compare to a uniform age interval between the sediment layers at the Volta estuary (Figure 3B). The error margins between the ages of the cores from Pra estuary show much smaller and consistent while that of the Volta estuary increases from the surface and only decreased relatively in the bottom layers (Figure 3B). The gross overlapping of ages in sediment layers at Volta estuary could be attributed to the reworking of the sediment after deposition. The possibility of dredging at the entrance of the estuary in the past could not be ruled out since the estuary serve as an exit or entry point for vessels for refurbishment at Ghana Port and Harbour Highway dry dock at Ada-Foah.
The computed depositional flux of 210Pb into the sediment is 190.05 ± 15.85 Bq/cm/yr for Pra estuary and 217.78 ± 11.76 Bq/cm/yr for the Volta estuary. The average flux of radionuclides onto the sediment is 203.92 ± 20.26 Bq/cm/yr.
The sedimentation rate at the Pra estuary (mean value of 0.51 ± 0.31 g/cm2.y) is lower than the Volta estuary (mean value of 1.04 ± 0.81 g/cm2.y) (Figure 2B and Figure 4A). This is due to sheer volume of water and sediment delivery since Volta River is bigger than the Pra River. The literature on sedimentation rate in estuaries of West Africa sub-region is still limited. However, these findings are similar to the sedimentation rate within the Bang Pakong River Estuary, eastern coast of Thailand (0.69, 0.74, 0.57, 0.48 and 0.46 cm/yr) [3].
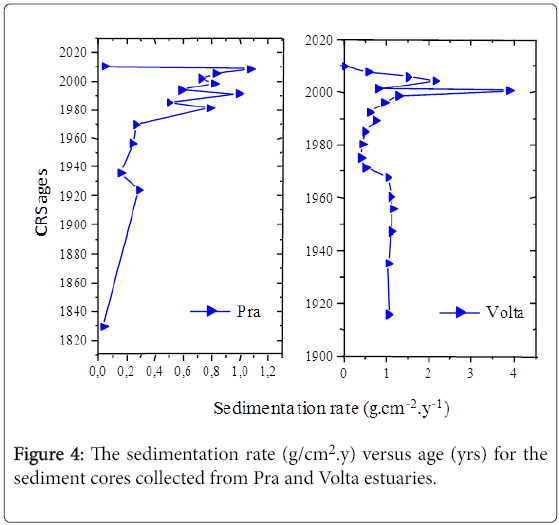
Figure 4: The sedimentation rate (g/cm2.y) versus age (yrs) for the sediment cores collected from Pra and Volta estuaries.
The sedimentation rate at the Pra estuary increases from 0.03 g/ cm2.y to about 0.29 g/cm2.y within 95year (bottom layer of the sediment core). It then decline and remain constant (0.22g/cm2.y; 1935 to 1969). In 1981, the sedimentation rates increases gradually and yields the highest (1.07 g/cm2.y) in 2009 and follows a sudden drop in 2010 (surface core). In contrast, a stable sedimentation rate at the Volta estuary (mean 1.08 g/cm2.y) occurs between 1915 and 1967 (bottom layer of the sediment core). This was followed by a sharp drop in sedimentation rate (mean 0.47 g/cm2.y) between 1971 and 1984.
The sedimentation rate from 1989 to 1998 increases gradual and yield an exceptional high rate of 3.90 g/cm2.y in 2000 (Figure 4B). This was then preceded by a decline in sedimentation rate between 2001 and 2009 to the lowest of 0.02 g/cm2.y (surface sediment core). The sedimentation rate verses time depict patterns of variations and stabilities this provides a reasonable interpretation of the data at both estuaries. This also agrees with the statement that the activities and corresponding inventories of transuransic elements in sediments strongly depend on the sedimentation rate, which is itself a function of local hydrodynamic conditions [14].
The variability of sedimentation rates within the Pra estuary is largely due to excess sediment input as a result of gold mining activities in the catchment area since 15th century [16]. The decline in sedimentation rates from 1935 to 1967 is an evidence of paucity in sediment supply which coincided with introduction and enforcement of the Mercury Law in 1933 [16]. The Mercury Law prevented the local (native) people from unauthorized digging for gold but allow British and other foreign investor to access large concessions for commercial gold mining operation in late 19th century [16]. This might trigger an increase in supply of sediment into the river system leading to an incremental in sedimentation rates between 1956 and 1981 of the Pra estuary. The fall in sedimentation rates in 1984 is caused by low water inflow due to drought in 1983 in Ghana causing most tributaries to dry up. On the other hand, the sudden exponential increment in sedimentation rates between 1984 and 2008 is due to the proliferation of small scale mining (galamse) activities as a result of enactment of artisanal mining law in 1989 [16-18]. Finally, the fall in sedimentation rate in 2010 could be due to the lack of sediment inflow as a result of siltation of streams and rivers that supplied the Pra River with sediment particles.
The sedimentation pattern at the Volta estuary depicts the activities before and after the construction of the Akosombo on the Volta River (Figure 4B). Before the construction of the dams, sedimentation rate was fairly constant (1.03-1.14 g/cm3.yr between 1915 and 1967). After the commissioning of the dam in 1965, the sedimentation rate reduced significantly and remained almost uniform (0.40-0.51 g/cm3.yr between 1971 and 1984). In 1984, there was a rise in sedimentation rate till 2000 where the highest peak was observed. This is due to increase in sediment flow by torrential rain in the mid-80s and 90s after the 1983 drought which lead to the opening of the spillway to expel excess water from the dam in 1991.
The fall in sedimentation rate after 2000 until 2009 again is due to lack of sediment inflow because of the closure of the dam’s spillway and adverse change in the rainfall pattern within the catchment area of the Volta basin. From the literature, the intensity of rainfall was so high in late 2010 leading to the second opening of the spillway of dam to save the dam from collapsing. However, this phenomenon was not registered in the sediment as movement and settling of sediment from water column assume slow processes.
The average activity of total 210Pb in Pra and Volta estuaries were 33.30 ± 2.95 Bq/kg and 37.43 ± 3.13 Bq/kg, respectively. However the Volta samples showed consistency in the profile values as compared to Pra profile which needed modification of data to fit the CRS dating model. The age of the Pra core were between 2010 and 1829 as compared to the Volta core which was between 2009 and 1915 indicating that the Pra core samples were relatively older than the Volta core. The margin of error between the ages of the cores showed that dredging activities had been carried out at the Volta estuary resulting in re-deposition of sediment core over the years. The mean sedimentation rate at Pra and Volta were 0.52 g/cm2.yr and 1.048 g/ cm2.yr, respectively indicating that Pra cores are older than the Volta cores. The mean flux of radionuclides onto the sediment is 203.92 ± 20.26 Bq/cm/yr. and could be extended to the entire coastal zone of Ghana. Though the 137Cs profiles were insufficient in validating of the dating records of the sediments, historical events such as mining activities and construction of dams as well as rainfall patterns were important in the interpretation of the ages and sedimentation rates. The damming of the Volta River has cause 50% reduction in the sedimentation rate at the Volta estuary. This will further decline due to damming of the Bagri River at Burkna Faso a major source of inflow into the River Volta.
Also, proliferation of small scale-mining is enhancing sedimentation rate and may lead to siltation of rivers and streams and with resulting impacts being flooding of riparian vegetation and adjoining communities.
The authors would like to express their gratitude to the International Atomic Energy Agency (IAEA) for funding the Regional Project RAF7009 “Supporting an Integrated Approach for Marine Pollution Monitoring Using Nuclear Analytical Techniques” within which this work was carried. The authors would like to thanks the Moroccan authorities for hosting the fellowship “Application of nuclear techniques to coastal zone management” at the Centre National de l’Energie, des Sciences et des Techniques Nucleaires. Lastly many thanks to the staff of the Department of Marine and Fisheries Sciences, University of Ghana Legon and all who helped in the sample collection especially Edem Mahu and all the technicians.