Journal of Physical Chemistry & Biophysics
Open Access
ISSN: 2161-0398
ISSN: 2161-0398
Research Article - (2022)Volume 12, Issue 3
We describe a tricomposite nanostructure based method to measure the trace amount of refractive index in aqueous solutions. It utilizes tantalum (v) oxide, silicon and graphite to fabricate the tricomposite nanostructures. The tricomposite nanostructures were prepared using hydrothermal method where the concentration of (x) of Si in Ta2O5 was varied while the concentration of graphite was kept constant. The concentration of Si in Ta2O5 was measured by Maxwell-Garnett model using volume filling factor ‘f’ (0 ≤ f ≤ 1) of Si in Ta2O5. The fabricated Ta2O5:Si:Graphite tricomposite nanostructures were characterized by SEM, XRD, UV-Vis, PL, FTIR characterization techniques. Then aqueous solution of varying refractive indices were prepared in the range 1.33-1.39 in the already prepared tricomposite nanoflower structure solution. The refractive index measurement were probed by measuring absorption spectra corresponding to each tricomposite nanostructures. The performance of the sensor was explored in terms of shift in peak absorption spectra, sensitivity and more over the limit of detection. The sensor shows sensitivity and limit of detection of (156-260) nm/RIU and 5.14 x 10⁻³ RIU respectively. A linear declining of sensitivity was observed within the refractive index range. The sensor possesses a distinguished feature of using tricomposite nanoflower structure which is an efficient method for refractive index measurement.
Silicon; Ta2O5; Graphite; Nanostructures; Tricomposite; Refractive Index; Sensor
Refractive Index (RI) is a prominent optical property of any material. It possess a very important role in optics as by using refractive index variation, one can easily investigate the optical behavior of any materials. Since it is an important parameter, therefore for designing optical systems, measurement of refractive index should be an done by simple and accurate method. By measuring the refractive index, can also measure several other parameters. Hence, several chemicals and biochemical molecules can be identified/measured using refractive index measurements [1]. Sometimes the purity of the chemical can also be checked by measurement of their refractive indices. If we consider, the measurement of any chemical then an estimation of various parameters such as its concentration, pH and detection limit can be measured by quantifying their refractive indices [2,3]. The obtained optical response corresponding to the analyte of varying refractive indices can be evaluated and thus the performance of a sensor can be analyzed. Further, in various drug industries, refractive index variations are widely used to calculate even trace amount of drug concentration. Moreover, water purity can also be checked by monitoring the refractive index of water which is being treated [4-6]. In addition to this, refractive index measurements proves to be very useful industrial processes. Since there is limited availability of refractive index function of several materials and there is strong requirement to measure the refractive index functions of newly indentified combinational nanomaterials therefore, it is very necessary to develop a highly sensitive accurate, simple and cheap refractive index sensor. The developed sensor should be such that it can significantly measure the extended range of refractive index values so as to satisfy the demand of various sensing applications. Reports have been found on various techniques, experimental procedures and instrumentation for refractive index measurements which are based on diverse physical and chemical principles. Several researchers have developed significant sensing structures for refractive index measurement. The most common refractive index sensors are those which are based optical fiber technique. Although to enhance the performance of sensor evolution have been done on the existing ones. Some researchers have used geometric arrangements to enhance the sensitivity. To further improve the performance fiber gratings were employed. Interferometry is yet another method to improve the sensing performances. Several researchers have used Surface Plasmon Resonance (SPR) technique to measure the refractive indices [7-10]. Then they employed localized surface plasmon resonance method. Various materials such as semiconductor oxide were also used to measure/improve the refractive index. Microstructured fibers and resonators have also been used [11]. These sensors offer reasonably good sensing performances but also possesses several limitations like they employ complex experimental set up, expensive fabrication, variation in output due to fluctuations in light source, temperature. Some method possesses poor mechanical strength, tedious/prolonged sample preparation. Some technique gives non-linear output response with a very limited refractive index sensing range etc. Due to these shortcomings of the existing sensors, the implementation of such sensor would be a great challenge and it provoke the further improvements in designing of such sensors for commercial/operation, highly sensitive/accurate and cheap. Hydrothermal method is an immensely simple, powerful, easy, cheap and method of fabrication. Using this method, the fabricated nanostructures are found to be pure exact. Single nanoparticles as well as composite nanostructures can be easily fabricated. The type of materials which can be fabricated using hydrothermal method may semiconductors, ceramics and metal or metal oxides etc. Also, the obtained product of nanostructures which are fabricated using hydrothermal method are found to be free from contamination because this method does not require additional preservative or precursors during fabrication process. Therefore, hydrothermal method is categories as “green technique”. The final obtained nanostructures are generally found to be highly stable and pure and are finely dispersed in solution. The agglomeration (if any) can be removed using ultra sonication. In hydrothermal process, generally flower-like or petal-like nanstructures can be easily fabricated. The process involves “Hydrothermal autoclave” instrument which is based on the principle of “pressure cooker” where temperature and pressure is given to the dispersion solution of any materials. Before doing the hydrothermal autoclave, we have to first prepare the dispersion solution of materials which we want to make nanostructures. The transparent dispersion can be prepared in deionised water by ultra-sonication of the dispersion before and after the hydrothermal process. The operating parameters in the hydrothermal process are the value of temperature and pressure within the autoclave.These two parameters should appropriately chosen so as to fabricate fine nanostructures with desired morphology and tailored size distribution. Moreover, the hydrothermally prepared nanostructures can be used without any further heat treatment as the nanostructures are synthesized in states of high temperature and pressure. In addition to nanostructures, hydrothermal process can easily prepare alloyed of different kind of materials, bimetallic, nanocomposite or combinational nanostructures of materials with different mechanical optical and thermal properties.
Lately, nanoflower structures have emerged as pioneering nanostructures which is widely used in scientific and commercial applications. Functionally, these nanostructures integrate multiple individual petals like structures into a combined form which proves to be very powerful and beneficial nanostructures with enhanced physical and chemical properties which may be otherwise unavailable.Liquid phase hydrothermal method is widely employed to fabricate nanostructures.In this process, we can prepare nanoflower of single as well as multiple materials. The distribution of several petals of different materials in a single flower can be used for various applications simultaneously. Nanostructures fabricated using sequential hydrothermal method are obtained to be highly pure with controllable dimensionality and size distribution. The obtained nanoflower structure are able to furnish productive interface [12]. The idea of fabricating nanoflower which carries petals of different types materials (with different properties) can be employed to develop a device with tailored properties of all the materials. The tailored properties of each materials provide/ enhance the overallperformance of the device. The different material which we can choose may be a metals, metal oxides, carbon materials, or semiconductors. Thus, combinational nanostructures if fabricated would be of huge importance with unparallel performances.
This work presents the fabrication of nanostructures consisting of graphite surrounded by petals of silicon and tantalum (v) oxide (Ta2O5) in liquid medium using hydrothermal process. Since graphite is naturally occurring form of crystalline carbon, it has emerged as highly promising conducting material. It is very soft in nature with very low specific gravity. Graphite possess unusual physical and chemical properties which proves to be very useful for electronics, optical and sensing applications. Combinational compounds of graphite with other materials, such as metal or semiconductor oxides further increase their application. Published reports support the applicability of graphite as suitable materials for sensing applications. Since few decades, silicon is widely used in electronic and optical application because of its good semiconducting properties, thermal and chemical stability. Therefore, to further improve the performance of the Si based devices, many improvement have been made on modifying Si. One of the efficient ways to modify the properties of Si is to combine Si with oxides materials like Ta2O5 because oxide materials possesses huge defects levels. Ta2O5 is a high refractive index metal oxide which is extensively used for the fabrication and characterization of highly sensitive plasmonic fiber-optic biosensors due to a rich enhancement of evanescent field at sensor-analyte interface. This field enhancement helps in achieving an appreciable shift in the peak absorption wavelength values which consequently improves the sensitivity of the sensor to a considerable extent. Further, the usage of Ta2O5 in the form of surrounding shell builds up a temperature insensitive surface around the central core in the core-shell geometry which improves the stability of the nanostructures. The implementation of Ta2O5 can be conveniently carried out in the form of bulk nanolayers or nanostructures of a variety of shapes to suit a particular sensing application. Moreover, Ta2O5 exhibits excellent biocompatibility which furnishes a productive scaffold for functionalization of biomolecules, and thus, projects efficient prospects for biosensing applications. Due to these attributes, Ta2O5 manifests superior opto-electronic properties, and therefore, it is extensively used to fabricate highly sensitive plasmonic fiber-optic sensors. The nanostructures of Si:Ta2O5:Graphite integrate the properties of graphite, Si and Ta2O5 culminating in the evolution of a sensor design with numerous advantages favorable for sensing applications. Using varying refractive index (1.33 to 1.39) aqueous solution of [Si(x)Ta2O5(1-x)]:Graphite nanostructures, absorption spectrum have been obtained. The absorption spectra have been carried out for all the values of ‘x’. The peak absorption wavelengths obtained for [Si(x)Ta2O5(1- x)]:Graphite nanostructures were used as the sensing signal, while the shift in peak absorption wavelengths corresponding to different refractive index solutions was employed to determine the sensitivity. In this way, present study opens up a new window to use [Si(x)Ta2O5(1-x)]:Graphite nanostructures as an efficient refractometer which can effectively and accurately measure the refractive index variations in aqueous samples.
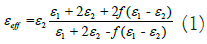
Since, the dielectric function of doped materials differs from their individual material therefore the dielectric function of Si(x)Ta2O5(1-x) (0 ≤ x ≤ 1) differs from both Si and Ta2O5 and is measured by applying Maxwell-Garnett model [13]. The effective dielectric function of Si(x)Ta2O5(1-x) (0 ≤ x ≤ 1) consider the volume filling factor ‘f’, which is obtained using the following relation:
The value of ‘x’ (0 ≤ x ≤ 1) used in Si(x)Ta2O5(1-x) (0 ≤ x ≤ 1)
nanoflower structure can be related to the value of ‘f’ by
equation (2). Let m1, d1 and V1 be mass, density and volume
of Si respectively and m2, d2 and V2 be the mass, density and
volume of Ta2O5 respectively then by the well-known relation of volume  ‘f’ can be related to ‘x’ using the following
relation [14]:
‘f’ can be related to ‘x’ using the following
relation [14]:
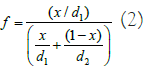
In equation (2) density of Si is 2.33 g/cm3 and that of Ta2O5 is 8.2 g/cm3. Thus the value of ‘f’ depends on ‘x’.
Fabrication of Ta2O5:Si:Graphite tricomposite nanostructure
The Ta2O5:Si:Graphite tricomposite nanostructure was fabricated using hydrothermal technique. The detailed schematic method of fabrication of Ta2O5:Si:Graphite tricomposite nanostructure is shown in Figure 1. In this method, the despersion of a particular concentration of graphite was prepared in ethanol. This graphite despersion was kept separately. Then, using equation (1) and equation (2), desprsion of Si and Ta2O5 [Si(x) Ta2O5(1-x)] for different values of 'f' was prepared. The prepared despersion considered 'f' as 0, 0.1, 0.2, 0.3, 0.4, 0.5 0.6, 0.7, 0.8, 0.9 and 1. Each suspension of Si(x)Ta2O5(1-x) was kept in autoclave at 200◦C for 24 hours. Now, already prepared graphite suspension was shacked well and mixed dropwise with the suspension of Si(x)Ta2O5(1-x) with one value.

Figure 1: Schematic of the fabrication of SixTiO2(1-x):Graphite tricomposite nanostructures.
Characterization of Ta2O5:Si: Graphite tricomposite nanostructure
The systematic characterizations of all the fabricated samples of Graphite:SixTa2O5(1-x) were performed. The measurements were carried out so as to obtain the structural, morphological and optical properties of Graphite:SixTa2O5(1-x) tricomposite nanostructures. The overall measurement of structure/morphology of Graphite:SixTa2O5(1-x)tricomposite nanostructures was performed using SEM. Finally the optical properties were examined using UV-V is, FTIR and Photoluminescence (PL) spectroscopic techniques. The composition of TiO2, Si and MWCNT was evaluated using X-ray diffraction techniques. Finally, refractive index sensing of the Graphite:SixTa2O5(1-x) tricomposite nanostructures was investigated usingpeak absorption measurements of the samples prepared in 1.33 to 1.39 refractive index solutions. This process was repeated for all the values of 'f'. Finally all the performance parameters of the samples were evaluated from the sensing signals.
Experimental set up
The schematic diagram of experimental setup for the characterization of Ta2O5:Si:Graphite tricomposite nanostructure for refractive index sensing is depicted in Figure 2. The setup consists of the halogen lamp to produce white light. Then to focus the white light, lens was fixed so that the focused beam reaches to the monochromator. To launch all the light beam inside the glass cuvette, we chose the Numerical Aperture (NA) of the lens large. Then, the glass cuvette having the samples of varying refractive was fixed to ensure the incidence of focused light beam to the solution. The glass cuvette was designed in such a way that it can be sealed while measurements. The output light beam from the cuvette reaches to the detector. The light beam coming from the detector may be weak so we aligned an amplifier to improve the output light intensity. The amplifier was then connected to the personal computer to record the absorption spectrum. The measurements were repeated for all the varying refractive index solution and for all the fabricated Ta2O5:Si:Graphite tricomposite nanoflower structure. The glass cuvette was evacuated time to time so as to remove the residual and undesirable liquids from it. The samples of varying refractive index were prepared and their absorption spectra were recorded at room temperature and pressure. The peak absorption wavelengths corresponding to different refractive indices were determined from these absorption spectra.

Figure 2: Schematic of UV-Vis experimental setup for the characterization of the fabricated Ta2O5:Si:Graphite nanoflower structure for refractive index sensing.
TFirst of all, for the morphological study of the fabricated Ta2O5:Si:Graphite tricomposite nanostructure, we carried out Scanning Electron Microscopy (SEM) at various magnification i.e., for 5 μm, 0.5 μm, 200 nm, and 100 nm. The SEM images depicted in Figures 3a-3d are Ta2O5:Si:Graphite tricomposite nanostructure for f=0.5 with above mentioned magnifications. In Figures 1a-1d, it may be noticeable that for lower magnification values i.e., from 5 μm, 0.5 μm, the bunches of nanostructures were clearly visible which confirms the presence of petal-like structures. As the magnification is increased i.e. for 100 nm shown in Figure 3c, clear image of the petals of flower can be seen. In Figure 3d, the dimension of the petals are clearly visible. Initially when f=0, only Ta2O5 was there, the nanoflower structure of graphite and Ta2O5 were formed. As the value of ‘f’ increases i.e., for f=0.1 to f=0.9 sufficient amount of Si was there so Ta2O5:Si:Graphite tricomposite nanoflower structure was formed. Finally, when f=1, there was no Ta2O5 and the nanoflowers of only Si and graphite were formed. Just for simplicity we have given the SEM images of different magnification for f=0.5.

Figure 3: SEM image of the fabricated tricomposite nanoflower structure of Si(x)Ta2O5(1-x):Graphite for f=0.5 with different magnification (3a) 5μm (3b) 0.5 μm (3c) 100 nm and (3d) particle size measurement.
Now, to get the crystallographic and structural information of the fabricated nanostructure, X-Ray Diffraction (XRD) was performed. The XRD patterns of Ta2O5:Si:Graphite tricomposite nanoflower structure is shown in Figure 4. The diffraction pattern of Ta2O5:Si:Graphite tricomposite nanostructure fabricated at room temperature for all the values of 'f ' from 0 to 1 is clearly mentioned.

Figure 4: XRD spectra of the fabricated tricomposite nanoflower structure of spectra of the fabricated tricomposite nanoflower structure of Si(x)Ta2O5(1- x):Graphite for different volume filling factor of Si in Ta2O5.
Further, to obtain the information for the optical properties of fabricated Ta2O5:Si:Graphite tricomposite nanostructure, FTIR was carried out. In Figure 5, it may be noticeable that the trend of the FTIR spectrum for all the fabricated tricomposite nanostructure were similar but the intensity of peaks increases with varying value of 'f '. The Intensity of FTIR peak increases as ‘f’ increases from 0 to 0.8. On further increasing the value of ‘f’, FTIR peak starts decreasing. In Figure 5, typical band at 3586 cm-1, 3259 cm-1, 2872 cm-1, 2505 cm-1, 2207 cm-1, 1295 cm-1, 1067 cm-1, 769 cm-1, 462 cm-1, have been mentioned. The broad band at 3535 cm-1, 3259 cm-1, 2872 cm-1, 2505 cm-1, 2207 cm-1, indicated the stretching vibration of hydroxyl group and interactions has been taken place by Ta2O5. Similarly band at 1067 cm-1, 769 cm-1, 462 cm-1 was attributed to bending vibration of Ta and O. The peak at 1295 cm-1 is due to Si vibrations either by oxygen or Ta interactions. The information of the interactions observed from the bands of FTIR spectrum indicates the overall interactions within the fabricated Ta2O5:Si:Graphite tricomposite nanostructure which give significant knowledge about their optical properties.

Figure 5: FTIR spectra of the fabricated tricomposite nanoflower structure of Si(x)Ta2O5(1-x):Graphite for different volume filling factor of Si in Ta2O5.
The more detail information about the optical properties of Ta2O5:Si:Graphite tricomposite nanostructure for all the fabricated values of ‘f’ from 0 to 1 can be obtained using Photoluminescence (PL) investigations. The PL emission spectra of Ta2O5:Si:Graphite tricomposite nanostructure were recorded and shown in Figure 6. It may be noticeable from the Figure that for f=0, PL intensity is also lowest. As the value of ‘f’ increases from f=0.2 to f=0.4 PL intensity also increases but as the value of ‘f’ further slightly increased from 0.4 to 0.5, PL intensity starts decreasing. On further increasing the value of ‘f’ from 0.5 to 0.8, PL intensity becomes constant. From the trend of the PL intensity for f=0 to 0.8, it is noticeable that maximum PL intensity is observed when f=0.4. The pictorial representation given in Figure 7 shows the reason of the obtained trend of the PL intensity and the variation of defects levels for varying values of ‘f’ is also explained. The photoluminescence is defined by the number of emitted photons due to excitations of light and the associated electrons which are coming back from conduction band to valence band during recombination. In Figure 7 it is defined that when f=0, PLI is lowest because the number of defects level (metastable states) would also be low. But for higher values of 'f' PLI is more so there would be more defects level so electrons reaches to more number of metastable states and therefore it takes more time in returning to valence band from the conduction band consequently emits more number of photons before recombination. The highest PL intensity is obtained when f=0.4 therefore it may be inferred that maximum defects levels are found at f=0.4. Similarly as PL intensity decreases the defects levels get altered in the same fashion.

Figure 6: Photoluminiscence spectra of the fabricated tricomposite nanoflower structure of Si(x)Ta2O5(1-x):Graphite for different volume filling factor of Si in Ta2O5 (f).

Figure 7: Pictorial representation of the band diagram explaining the effect of photoluminescence intensity on defects levels.
Now, experiments were performed for the Ta2O5:Si:Graphite tricomposite nanostructure for all the values of 'f' towards refractive index sensing applications. The absorption spectra of the prepared solution for f=0.4 in refractive index range of 1.33 to 1.38 is shown in Figure 8. The corresponding variation of peak absorption of Figure 8 is plotted in Figure 9. In accordance with the absorption spectra of Figure 8, peak absorption wavelength is observed to increase with an increase in the refractive index of the solution i.e., a red-shift in the peak absorption wavelength is obtained which is clearly shown in Figure 9. This is termed as the calibration curve for the refractive index sensor which governs the non-linear trend of peak absorption wavelength with refractive index. It is worthwhile to mention that the amount of wavelength shift in the absorption spectrum is very sensitive to the surrounding refractive index. For medium with lower refractive index, more energy is required to collectively excite the surface electrons to generate LSPR signal. Thus, the peak absorption wavelength values confine towards lower wavelength regime. As the refractive index of the medium is increased, comparatively smaller amounts of energy are needed to generate LSPR signal consequently, the peak absorption wavelength shifts towards higher wavelength values.

Figure 8: Absorption spectra of Si(x)Ta2O5(1-x):Graphite prepared in different refractive index solution.

Figure 9: Variation of peak absorption wavelength with refractive index values inset shows the variation of sensitivity with the refractive index. Note:  Exp point,
  Polynomial fit.
Now, from the calibration curve, sensitivity of the refractive index sensor can be evaluated. Sensitivity is a measure of the shift attained in peak absorption wavelength with respect to the change in refractive index. Mathematically, sensitivity is calculated from the slope of the calibration curve. For each refractive index value, the value of sensitivity is measured and is plotted as a function of the refractive index in inset of Figure 9. As is evident from Figure, the sensitivity curve pursue a declination trend with an increase in the refractive index. The maximum value sensitivity is determined to be ~(156- 260) nm/RIU in (1.33-1.38) refractive index range. Since the mathematical equation narrating the calibration curve is a polynomial of second degree, its differentiation yields a linear equation, and thus, the sensitivity is noticed to follow a linear trend with refractive index.
Limit of Detection (LOD) is yet another parameter to characterize a sensor. A further investigation has been made to measure LOD of the present refractive index sensor. For LOD, refractive index resolution should be measured. LOD is used to estimate the minimum possible value of refractive index that can be measured with the sensing layout.
Interpreted mathematically, refractive index resolution provides the minimum possible change in the refractive index wavelength attainable with the sensing framework. In this aspect, refractive index resolution of present sensor is evaluated. Resolution is evaluated from the below mentioned formula [15].
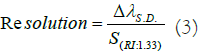
Here, ΔλS.D. denotes the standard deviation calculated in the measurement of peak absorption wavelengths for different refractive index solutions and S(RI: 1.33) represents the sensitivity attained at the minimum refractive index point (1.33). From Figure 3b, ΔλS.D. is estimated to be 0.4148 nm. Also, the sensitivity at refractive index value 1.33 is 155.56 nm/RIU. Using these values in equation (5), a refractive index resolution of 2.66 × 10⁻³ RIU is achieved.
From the obtained value of resolution, LOD of the present refractive index sensor is calculated using the formula [16].
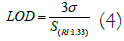
Where, σ represents the resolution which is taken as the wavelength resolution of the UV-Vis spectrophotometer used to perform absorption spectra experiments which is 0.13 nm. From equation (6), LOD of 5.14 × 10⁻³ RIU is obtained at 1.33. Since the strength of interaction between Ta2O5:Si:Graphite tricomposite nanostructure and external refractive index and consequent generation of LSPR signal depends on the volume filling factor (f) of Si in Ta2O5. Therefore, 'f' is very important to optimize in terms of the sensing performance of the Ta2O5:Si:Graphite. In this section, 'f' have been optimized by measuring the shift attained in peak absorption wavelength corresponding to Ta2O5:Si:Graphite for different values of 'f ' ranging from 0 to 1 in step of 0.1. These experiments for different values of 'f' were performed in same refractive index difference i.e., 1.33 to 1.38. The variation of shift in peak absorbance as a function of 'f' is plotted in Figure 10. It may be noticeable from Figure that as the value of 'f ' increases from 0 to 0.4, shift in peak absorbance wavelength increase. But on further increasing the value of 'f' from 0.5 to 1, shift in peak absorbance wavelength starts decreasing and become minimum at f=1. This trend is found to be in reasonable agreement with PL intensity shown and discussed previously in Figure 6. The maximum peak in PL intensity is found to be at f=0.4. Therefore it may be justified that the amount of defects level is the reason for absorption of light and hence for the shift in peak absorbance wavelength. It is worthwhile to mention here peak absorbance is observed due to the interaction of photons with that electron cloud results in the generation LSPR signal. When there is difference in refractive indices of the surrounding medium then the shift in peak absorbance wavelength is observed. This phenomenon is depicted well in Figure 11 (Table 1).
| Sensing structure | Refractive index range | Sensitivity (nm/RIU) | LOD (RIU) | Reference |
|---|---|---|---|---|
| Using intrinsic PL based on whispering gallery modes excited in ZnO microspherical resonators | 1.3395-1.3616 | 90-100 | … | [17] |
| Michelson Interferometer using cascading of down-taper with thin core fibers | 1.333-1.376 | 79.335 | 3 × 10⁻⁴ | [18] |
| 1-D silicon nitride based grating structures | 1.333-1.474 | 160 | 5 × 10⁻⁴ | [19] |
| Photonic crystal fiber based SPR sensor using GO modified with staphylococcal protein A | 1.3334-1.3731 | 4649.8 | … | [20] |
| LSPR using chiral plasmonic nanostructures and circular dichroism | 1.32-1.44 | 310 | … | [21] |
| Optofluidic plasmon-based sensor using immobilized ensembles of Au nanospheres on exposed core of microstructured fiber | 1.33-1.36 | 200 | 5 × 10⁻⁴ | [22] |
| Using concentric Si based dual-microring resonator | 1.33-1.45 | 180 | 1.1 × 10⁻⁵ | [23] |
| Plasmonic sensor based on MWCNT@Ta2O5 core-shell nanostructures | 1.33-1.39 | 240.58 | 1.62 × 10⁻³ | [15] |
| Magneto-plasmonic sensor based on hybrid Ni/SiO2/Au dimer nanodisks | 1.00-1.52 | 171 | … | [16] |
| Fabry-Perot refractometer driven by temperature fluctuation | 1.3355-1.3724 | … | 1.7 × 10⁻³ | [24] |
| Silica microfibers having transverse dimensions modified using CO2 laser induced LPGs | 1.31-1.32 | 1900 | … | [25] |
| Microstructured optical fiber sensor utilizing the concept of four-wave mixing | … | 8800 | 6 × 10⁻⁵ | [26] |
| Hydrothermally prepared Tricomposite Nanoflower of Ta2O5:Si:Graphite | 1.33-1.38 | 260 | 5.14 x 10⁻³ | Present work |
Table 1: Comparison of the performance of the present refractive index sensor with the reported ones.

Figure 10: Variation of shift in the peak absorption wavelength for Si(x)Ta2O5(1-x):Graphite tricomposite nanostructures for 1.33 to 1.39 refractive index solution. Note: ( ) Experimental points.

Figure 11: Schematic of reason for shift in absorbance for varying refractive index.
This work elucidates on the fabrication and characterization of Ta2O5:Si:Graphite tricomposite nanostructure using hydrothermal method and depicted their utility in refractive index sensors. The absorption spectra obtained for Ta2O5:Si:Graphite tricomposite nanostructure prepared in varying refractive index solutions were studied to probe their refractive index sensing characteristics. A shift equal in the peak absorption wavelength is observed for varying the refractive index of the surrounding medium from 1.33 to 1.38. The operational parameters of the sensor are volume filling factor of Si in Ta2O5 which is used to optimize for sensitivity towards refractive index sensing. Ta2O5:Si:Graphite tricomposite nanostructure displays a refractive index sensitivity in the range ~(156-260) nm/RIU in refractive index range (1.33-1.38) which excels a lot of the earlier reported values. Further, LOD achieved is 5.14 × 10⁻³ RIU which stands with various other refractive index sensing structures. The operating range of the fabricated sensor extends over a wide refractive index range from 1.33 to 1.38, which guarantees their suitability for refractive index measurement. The nanotechnology enabled sensing methodology furnishes conceptual and operational simplicity. The reported results project a novel perspective towards the applicability of Ta2O5:Si:Graphite tricomposite nanostructure as efficient framework for refractive index sensing applications.
Rana Tabassum is thankful to Department of Science and Technology (India) for INSPIRE faculty scheme with project no. [DST/INSPIRE/04/2017/000141].
Mr. Farhan Ahmad and Dr Rana Tabassum has performed all the experiments (sample preparation and characterization) and prepared manuscript. Ms. Shafaque Rahman and Dr. Aurangzeb Khurram Hafiz supported the work.
[Crossref] [Google Scholar] [PubMed]
[Crossref] [Google Scholar] [PubMed]
[Crossref] [Google Scholar] [PubMed]
[Crossref] [Google Scholar] [PubMed]
[Crossref] [Google Scholar] [PubMed]
Citation: Ahmad F, Rahman S, Tabassum R, Hafiz AK (2022) Enhanced Refractive Index Sensing Performance Using Hydrothermally Prepared Tricomposite Nanostructure of Ta2O5:Si:Graphite. J Phys Chem Biophys. 12:329.
Received: 10-Jun-2022, Manuscript No. JPCB-22-17475; Editor assigned: 13-Jun-2022, Pre QC No. JPCB-22-17475 (PQ); Reviewed: 27-Jun-2022, QC No. JPCB-22-17475; Revised: 04-Jul-2022, Manuscript No. JPCB-22-17475 (R); Published: 11-Jul-2022 , DOI: 10.35248/2161-0398.22.12.329
Copyright: © 2022 Ahmad F, et al. This is an open-access article distributed under the terms of the Creative Commons Attribution License, which permits unrestricted use, distribution, and reproduction in any medium, provided the original author and source are credited.