Journal of Plant Biochemistry & Physiology
Open Access
ISSN: 2329-9029
ISSN: 2329-9029
Research Article - (2014) Volume 2, Issue 1
β-amylase is an enzyme involved in the degradation of transitory starch in photosynthetic tissues of plants and
is expressed in high levels in the roots of Medicago sativa L. How the β -amylase gene MsBAM1 is regulated in
the roots is not clear. The aims of this study were to: isolate the core promoter of MsBAM1, decipher motifs in silico
that are associated with the elevated root specific response, and to find common motifs among core promoters
of important starch degradation genes in Medicago sativa MsBAM1 and Arabidopsis (AtGWD, AtPWD, AtMEX1,
AtBAM 1 & 3, and AtISA3). Primers were designed from homologous β-amylase genes and used in PCR with
M. sativa gDNA. Gel purified PCR band(s) were sequenced, verified and annotated. The starch genes and equal
numbers of Arabidopsis non-starch genes promoters were analyzed by the transcription factor binding site database
(PLACE). Motif frequencies between starch and non-starch genes were statistically analyzed. A TATA-box motif
was identified in the MsBAM1 core promoter. Chi-square and Fisher’s exact test analyses revealed significance of
the frequency of the motifs ROOTMOTIFTAPOX1 (RMP1) and GATABOX (GATA) between starch and non-starch
genes, but not the DOF motif. The RMP1 and GATA motifs were detected in MsBAM1 and in all the Arabidopsis
starch degradation genes but only in a few of the non-starch genes. However, the DOF motif was found in all starch
and non-starch degradation genes in similar frequencies. These motifs may work in combination with other known
cis-regulatory elements to confer root-enhanced expression in alfalfa roots and co-transcriptional regulation in the
starch degradation pathway
Keywords: Alfalfa; Arabidopsis; β-amylase; Bioinformatics; Cis-regulatory elements; Core promoter; Medicago sativa; Motifs; Roots; Starch degradation genes
BP: Base Pairs; MsBAM1: Medicago sativa β-amylase1; gDNA: Genomic DNA; AtGWD: Arabidopsis Thaliana Glucan Water Dikinase; AtBAM, Arabidopsis Thaliana β-Amylase; AtISA3, Arabidopsis Thaliana Isoamylase3; ADH: Alcohol Dedydrogenase; CAD: Cinnamyl Alcohol Dehydrogenase; RMP1: ROOTMOTIF TAPOX1; GATA: GATABOX motif; DOF: DNA Binding with One Finger Family motif; TSS: Transcription Initiation Site; CHO; Carbohydrate
Grown worldwide, Medicago sativa L. (alfalfa) is a nitrogenfixing legume, and is an important crop in the ecosystem [1]. M. sativa’s growth and development is partly due to its taproot biology that stores high amounts of starch that is utilized in times of need such as re-growth after winter or defoliation. Starch metabolism is a physiologically conserved function of virtually all higher plants and algae [2]. Evidence of the starch degradation pathway is relatively easy to model in photosynthetic tissues because the process occurs within a diurnal cycle [3]. Thus, the transitory starch that accumulates in the chloroplast during the day is subsequently degraded at night to the sugars maltose and glucose that are exported into the cytosol [3-5]. In the cytosol, these simple sugars are converted into sucrose for transport throughout the plant in order to maintain cellular metabolism. Sucrose is converted back into starch in non-photosynthetic tissues for storage purposes [3,6].
Stored starch is typically associated with the amyloplasts of nonphotosynthetic tissues. Unlike transitory starch, stored starch is degraded over periods of time such as an entire season or during periods of shoot re-growth after defoliation [7-11]. During the growth months (spring and summer) Lathyrus maritimus (beach pea) accumulates high levels of starch in the amyloplasts found in its root nodules [9]. This starch is depleted throughout the non-growth months (winter) [9]. In the taproots of M. sativa the concentration of stored starch declines and accumulates within about one month of defoliation [10]. Once sufficient amounts of leaves have been re-established, the levels of carbon and nitrogen reserves in the taproot are replenished [12-14]. This storage and recycling of nutrients play a crucial role in both winter survival and shoot re-growth [11,14-16]. Storage and breakdown of starch in M. sativa roots is a necessity for its survival [17]. The enzymes responsible for starch mobilization from the amyloplast in alfalfa taproots after defoliation have not been thoroughly characterized compared to what is known for transitory starch degradation in Arabidopsis [3,4,6,18].
β-amylase is one enzyme that plays an important role in the starch degradation pathway of transitory starch in photosynthetic tissues [3]. It is ubiquitous in plants; however, its expression varies from tissue to tissue [3,19]. Arabidopsis has nine unique β -amylase genes subdivided into four different gene families [10,20]. Currently only one β -amylase gene has been described in M. sativa (MsBAM1) [10]. The transcript for MsBAM1 disproportionately accumulates in M. sativa taproots in contrast to its leaves or stems [10]. The role of this β -amylase in M. sativa taproots is unclear and cis regulatory elements within core and proximal promoter may help provide insight as to how expression of this gene is regulated in M. sativa roots to achieve the higher transcript levels observed. Edner et al., [21] demonstrated interdependence of some Arabidopsis starch enzymatic activities encoded by genes such as: AtBAM1&3, and AtGWD. Comparisons of the cis-regulatory elements within the promoter regions of Arabidopsis starch degradation genes with that of MsBAM1 will be useful in deciphering the function of MsBAM1 in alfalfa tap roots. The objectives of this study were to: a) isolate and annotate the MsBAM1 core promoter region, b) determine if any of the motifs predicted in silico are associated with an elevated root specific response, and c) identify motifs from the MsBAM1 core promoter in this study that are common in Arabidopsis key starch degradation genes (AtBAM1&3, AtGWD, AtPWD, AtMEX1 and AtISA3).
In this report, the core promoter of MsBAM1 was identified by the presence of the canonical TATA box. The length of the first intron of MsBAM1 was determined and known motifs such as RMP1, GATA and DOF were identified. The DOF motif known to be involved in light, phytohormones and pathogen signaling [22] was found in all starch and non-starch degradation genes in similar frequencies. However, RMP1 and GATA were found to be significantly present in starch promoters compared to non-starch promoters. These motifs may work in combination with other known cis-regulatory elements to confer root-enhanced expression in alfalfa roots and co-transcriptional regulation in the starch degradation pathway.
Plant material and DNA Isolation
Plants of Medicago sativa (Pioneer cv 5454), Medicago truncatula (cv Serena), and Glycine max, (cv Williams 82) were used for this study. Seeds were sown in a soil mix containing 2:1 parts sand:silty clay loam in 1-liter pots and grown at an average temperature of 25°C in a 16 hour photoperiod. The plants were watered with deionized water as needed and minus-nitrogen Hoagland Nutrient Solution (50 mL) was administered bi-weekly. Three-week-old shoots of all three species were harvested and ground to a fine powder in liquid nitrogen using a mortar and pestle and weighed. Total gDNA was isolated with the Qiagen DNeasy kit following the manufacturer’s protocol (Qiagen, Germantown, MD). Genomic DNA was quantified using the HT-Multi- Plate Reader (BioTek, Winooski, VT). The integrity of the gDNA was checked by 1.5% agarose gel electrophoresis, and the image captured using a Fluro-S multi-imager (BioRad, Hercules, CA). The gDNAs were stored at -20°C until needed.
Bioinformatics analysis
Although the M. sativa β-amylase full-length cDNA sequence (MsBAM1, GenBank Accession number AF026217) was previously characterized by [10], its promoter region remained elusive. Therefore, a combination of bioinformatics and molecular biology strategies were employed to isolate and identify the MsBAM1 promoter region. The BLASTN algorithm was used to perform searches of sequences having homology to the MsBAM1, in the GenBank, this search revealed several plant species with similarity to the MsBAM1 cDNA. These included β-amylase(s) from Hordeum vulgare (barley), Arabidopsis thaliana, Impomea batatas (sweet potatoes), G. max (soybean), and M. truncatula. Only those with genomic equivalents were selected for further study. There were two criteria used to help limit the search: 1) selected organisms should have gDNA sequences of β-amylase with 500 or more base pairs upstream of the initiation codon to ensure that a core promoter would reside in the vicinity and 2) the selected species should have > 90% nucleotide identity to MsBAM1 to ensure that a primer designed from selected homologous β-amylases would have specificity in M. sativa.
Upon identification of candidate(s) that met the two above criteria, pair wise comparisons were done between the candidate(s) and MsBAM1 using BLASTN, with the formatting option “CDS feature” selected in order to display the amino acid sequences. This step was a direct action to more precisely define the region upstream of the initiation codon in the various selected homologous β-amylase genes. Finally, in order to identify the core promoter within the upstream regions from the selected species, Promoter Scan software was used (BIMAS). Nucleotides 800 bp upstream of their respective initiation codons were submitted for primer design.
Primer design
Having defined the putative core promoter regions of selected β-amylase candidate sequences in silico, Primer BLAST was used for primer design (Primer BLAST). Although two candidates of homologous β-amylase were selected for primer design, only primers from M. truncatula were selected for further molecular assays. These primers are listed in Table 1. The M. truncatula β-amylase sequence is found within a large unannotated DNA fragment of 291,529 base pairs in the Gene Bank (accession # AC137521.31) in the reverse orientation. Therefore reverse complement analysis was performed utilizing online tools on the sequences that corresponded to M. truncatula β-amylase in order to subject the sense strand for annotation and primer design.
| Primer | Sequence 5` - 3` | Tm | % GC | Amplicon Size (bp) |
|---|---|---|---|---|
| MtBAM2010F1 | TTGTGGATTAAGTACCCCTCCCTCC | 66.2 | 52.0 | 430 |
| MtBAM2010R1 | ATGAGGACTTACTGGGAGCATGACA | 64.6 | 48.0 | |
| MtBAM2010F2 | AAGCCCCACTTCGTGACTTCAAAGC | 66.2 | 52.0 | 450 |
| MtBAM2010R2 | CGCCTGCTGCTCGTAGTTGCA | 66.5 | 61.9 | |
| MtBAM2010F3 | ACATCAAAGCCCCACTTCGTGAC | 64.6 | 52.2 | 560 |
| MtBAM2010R3 | TCCTGGTCCCTAATACCGGAGCG | 68.1 | 60.9 |
Table 1: Designed primers from the M. truncatula β-amylase sequences and amplicon sizes.
Polymerase Chain Reaction
PCR was used to amplify gDNAs of M. sativa, M. truncatula, and G. max with the M. truncatula specific primers that were designed. The PCR reactions were assembled by adding 100 ng of a specific species gDNA (50 μg/ml), 20 μM forward and reverse primers, 200 μM dNTP, 1.5 U of TripleMaster enzyme mix (Eppendorf -5 Prime, Boulder, CO), 1X high fidelity reaction buffer, and sterile nanopure water to a final reaction volume of 50 μl. Amplifications were performed in a gradient thermal cycler (Eppendorf AG, Hamburg, Germany) with the following thermal cycling parameters: 94°C for 5 min, followed by 30 cycles at 94°C for 1 min, 55°C for 2 min, and 72°C for 2 min. A final 5 min extension step was done at 72°C with a holding temperature at 4°C. Samples were subjected to 2 % agarose gel electrophoresis in 1X TAE buffer. The gel images were captured with a Fluro-S multi-imager (BioRad, Hercules, CA). The band(s) of interest were directly purified from the agarose gel by following a standard protocol for gel extraction (Qiagen, Germantown, MD) and quantified with the HT-Multi-plate Reader (BioTek, Winooski, VT). Annealing reactions were assembled by mixing 10 ng of gel eluted DNA solution with 4 μM of a specific forward primer (MtBAM2010F2 or MtBAM2010F3) and reverse primer (MtBAM2010R2, MtBAM2010R3) (see Table 1) in 1.5 ml tubes. The sequencing was accomplished by Mount Desert Island Biological Lab (Salisbury Cove, Maine).
Annotation of putative promoter region and statistical analysis
Annotation of the promoter region of the M. sativa MsBAM1 was done in silico with the Transcription Element Site Search (TESS), and PLACE. The lists of predicted motifs from TESS and PLACE were compared to a list of motifs that [23] identified for NUCLEARENRICHED PHLOEM CAMPANION CELL (NPCC) genes that are expressed predominantly in the roots of Arabidopsis. In addition, to find motifs among key starch degradation genes in Arabidopsis in common with MsBAM1, the sequences of these Arabidopsis starch degradation genes were retrieved: AtGWD, AtBAM 1 & 3, AtPWD, AtMEX1, and AtISA3 from the Gene Bank. For negative controls, seven non-starch genes of Arabidopsis were included in the analysis (Figure 6). From each gene 300 bp upstream and 33 bp downstream from the first nucleotide of the start codon were utilized to be certain the core promoter (TATA, INR, DPE) and proximal promoter regions resided in this range of base pairs as is seen in many eukaryotic genes [24].
PLACE annotated these 333 bp sequences in a similar manner to the newly revealed β-amylase M. sativa core promoter sequences. Chi-square analysis was performed on the motifs of interest in order to determine significance of the motifs in context to starch and nonstarch degradation genes utilized in this study. To satisfy the criteria for chi-square analysis, combined total frequencies of starch gene and nonstarch gene motif, to perform a 2×2 table, were performed. The data was also analyzed by Fisher’s exact test. The calculated motif expected frequency was a 1:1 ratio for starch genes versus non-starch genes.
MsBAM1 Homologous Genes
Figures 1A and 1B highlight the BLASTN comparisons of exon I of the MsBAM1 to corresponding exon(s) of M. truncalula and G. max that show 94% and 90% similarity with MsBAM1, respectively. Figure 2 shows an illustration of the annotated promoter regions of M. truncatula and G. max. Annotations were used to focus on specific regions where primers might be designed in the search for the M. sativa core promoter.
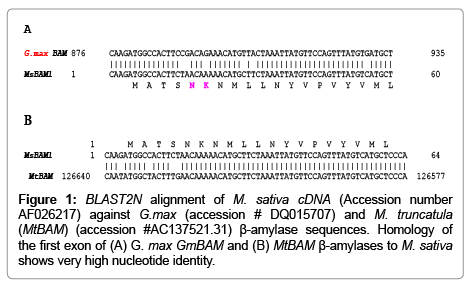
Figure 1: BLAST2N alignment of M. sativa cDNA (Accession number AF026217) against G.max (accession # DQ015707) and M. truncatula (MtBAM) (accession #AC137521.31) β-amylase sequences. Homology of the first exon of (A) G. max GmBAM and (B) MtBAM β-amylases to M. sativa shows very high nucleotide identity.
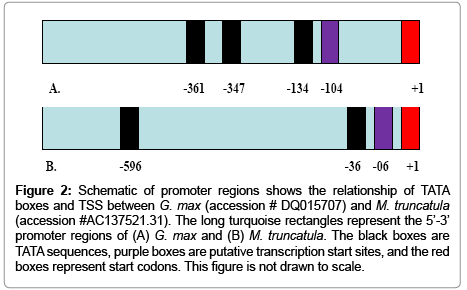
Figure 2: Schematic of promoter regions shows the relationship of TATA boxes and TSS between G. max (accession # DQ015707) and M. truncatula (accession #AC137521.31). The long turquoise rectangles represent the 5’-3’ promoter regions of (A) G. max and (B) M. truncatula. The black boxes are TATA sequences, purple boxes are putative transcription start sites, and the red boxes represent start codons. This figure is not drawn to scale.
The designed primers (Table 1) yielded single amplified bands for M. sativa and M. truncatula (Figure 3). The MtBAM2010F1/ MtBAM2010R1 primers amplified a band (~ 430 bp) only from M. truncatula gDNA (Figure 3, Lane 2). However, the MtBAM2010F2/ MtBAM2010R2 (Lanes 4 and 6) and MtBAM2010F3/ MtBAM2010R3 primer combinations (Lanes 8 and 9) amplified bands from both M. sativa (~ 450 bp) and M. truncatula gDNAs (~ 560 bp) (Figure 3). No bands appeared for any set of primers with the G. max samples (Figure 3, Lanes 3, 7 and 10). The bands in the lanes of both M. sativa and M. truncatula from the primers MtBAM2010F2/ MtBAM2010R2 and MtBAM2010F3/MtBAM2010R3 (Figure 3) were sequenced. The sequences from both amplicons were identical where they overlapped in the internal sequences. Therefore, only the sequence from the band amplified from M. sativa by the primer combination MtBAM2010F2/ MtBAM2010R2 was submitted to the GenBank because of the longer size of its upstream region. It has a GenBank accession number #JQ397635.1 with the gene name of MsBAM1.
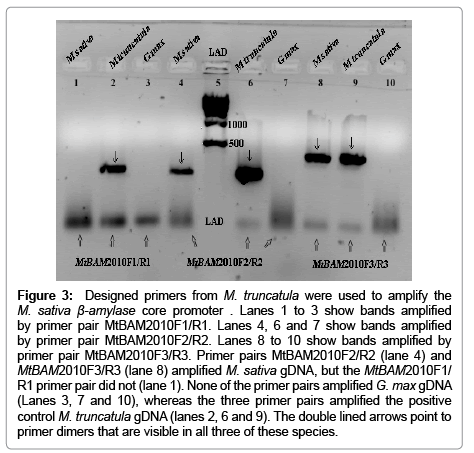
Figure 3: Designed primers from M. truncatula were used to amplify the M. sativa β-amylase core promoter . Lanes 1 to 3 show bands amplified by primer pair MtBAM2010F1/R1. Lanes 4, 6 and 7 show bands amplified by primer pair MtBAM2010F2/R2. Lanes 8 to 10 show bands amplified by primer pair MtBAM2010F3/R3. Primer pairs MtBAM2010F2/R2 (lane 4) and MtBAM2010F3/R3 (lane 8) amplified M. sativa gDNA, but the MtBAM2010F1/ R1 primer pair did not (lane 1). None of the primer pairs amplified G. max gDNA (Lanes 3, 7 and 10), whereas the three primer pairs amplified the positive control M. truncatula gDNA (lanes 2, 6 and 9). The double lined arrows point to primer dimers that are visible in all three of these species.
Characteristics of the MsBAM1 core promoter
BLASTN was used to verify the authenticity of the sequence (Figure 4; accession #JQ397635.1) derived from M. sativa gDNA using M. truncatula β-amylase designed primers. The length of 226 base pairs of non-overlapping new sequence lying upstream of the cDNA sequences from this BLASTN analysis was noted (Figure 4 and 5). Serendipitously, the first intron was identified with a length of 96 base pairs. The first intron contains the typical 5’ conserved GU intron donor splice site as well as the conserved 3’ AG acceptor splice site (Figure 4) [25]. Online promoter prediction tools revealed that the 226 base pair sequence does harbor a promoter showing the canonical TATA box (TATAAA) located at a position 42 base pairs upstream of the start codon (-42) (Figure 4) [25]. In addition, a number of variant TATA boxes are also predicted further upstream of the canonical TATA Box at positions -119, -154, -167, -184, and -224, respectively. Several CAAT boxes are predicted within this core promoter region at positions -78, -100, -192, and -196, respectively (Figure 4). Two motifs upstream of the start codon (+1) (ATG) at positions -20 and -32 both fit the description of a Transcription Start Site (TSS) consensus. Gana et al., [10] previously defined the four bases ahead of the ATG (CAAG) as part of the cDNA. The JQ397635.1 sequence shows 94% identity to the overlapping region of the M. sativa β -amylase cDNA sequence (accession # AF026217) corresponding to the entire exon 1 as well as 100% identity to a partial region of exon 2 (Figure 5).
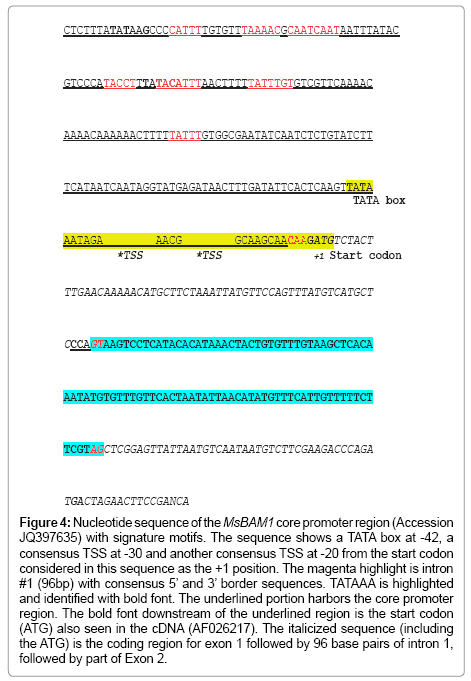
Figure 4: Nucleotide sequence of the MsBAM1 core promoter region (Accession JQ397635) with signature motifs. The sequence shows a TATA box at -42, a consensus TSS at -30 and another consensus TSS at -20 from the start codon considered in this sequence as the +1 position. The magenta highlight is intron #1 (96bp) with consensus 5’ and 3’ border sequences. TATAAA is highlighted and identified with bold font. The underlined portion harbors the core promoter region. The bold font downstream of the underlined region is the start codon (ATG) also seen in the cDNA (AF026217). The italicized sequence (including the ATG) is the coding region for exon 1 followed by 96 base pairs of intron 1, followed by part of Exon 2.
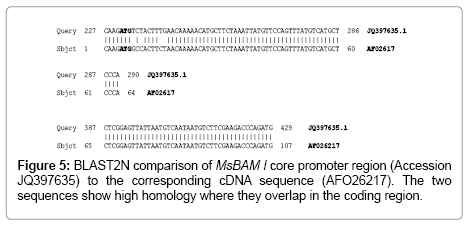
Figure 5: BLAST2N comparison of MsBAM I core promoter region (Accession JQ397635) to the corresponding cDNA sequence (AFO26217). The two sequences show high homology where they overlap in the coding region.
MsBAM1 and Arabidopsis Starch Degradation Genes have Common Motifs
In addition to the basic motifs that characterize the core promoter, as described above, specific motifs that may explain the root enhanced expression of MsBAM1 as well as motifs that are predominant in starch degradation genes compared to non-starch genes were found. PLACE predicted abundant similar motifs for the MsBAM1 core promoter region along with key Arabidopsis starch degradation genes. Specifically, PLACE predicted 48 unique motifs for MsBAM1, 49 for AtBAM1, 42 for AtBAM3, 44 for AtGWD, 53 for AtMEX1, 46 for AtPWD, and 44 for AtISA3. Table 2 shows motifs that were predicted for M. sativa that also were predicted in the starch degradation pathway genes of Arabidopsis. For example, the root specific motif RMP1 (ATATT) is located 175 base pairs upstream from the +1 start codon in MsBAM1 [26,27]. RMP1 and GATA motifs are found in higher proportion in starch compared to non-starch degradation genes (Figures 6A and C). In contrast, the DOF motif (CTTT or AAAG) is similar in frequency in all starch and non-starch genes (Figures 6 B and D). Besides the three common motifs of interest that are mentioned above, an anaerobic response element AAACAAA was predicted in M. sativa and in most of Arabidopsis starch promoters. The Arabidopsis alcohol dehydrogenase (AtADH) core promoter contains this anaerobic motif which is induced by anaerobic conditions [24,28,29]. AtADH was included in this study as one of the seven non-starch genes that was used as a negative control for comparisons to starch degradation genes.
| Plant Starch degradation Genes | CRE (motif) predicted | Factor or site name | Function in Plant Processes | Literature |
|---|---|---|---|---|
| AtGWD, AtISA3 MsBAM1 AtMEX1 AtPWD |
AAACAAA | SRY, HNF-3alpha, HNF-3beta, HNF-3gamma | Induces ADH in hypoxic, cold, and dehydration conditions | [24] |
| AtGWD, AtISA3 , AtBAM1, AtBAM3, AtMEX1, AtPWD MsBAM1 |
AAAG | MNB1a (DOF) | Gene regulation of CHO metabolic genes, defense, germination | [23] |
| AtGWD, AtISA3 , AtBAM1, AtBAM3, AtMEX1, AtPWD MsBAM1 |
GATA | GATABOX (GATA) |
Light response, germination, greening, elongation growth, flowering, | [33,34] |
| AtGWD, AtISA3 , AtBAM1, AtBAM3, AtMEX1, AtPWD MsBAM1 |
ATATT | ROOTMOTIFTAPOX1 (RMP1) | Root specific response | [23,31] |
Table 2: Motifs in some key Arabidopsis starch degradation genes in common with MsBAM1.
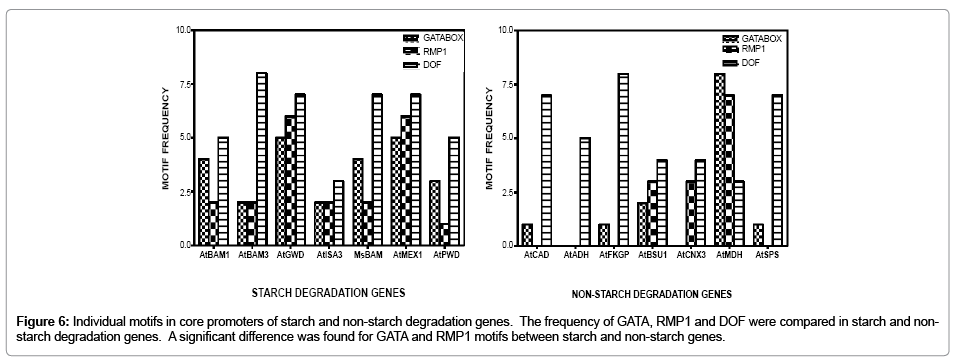
Figure 6: Individual motifs in core promoters of starch and non-starch degradation genes. The frequency of GATA, RMP1 and DOF were compared in starch and nonstarch degradation genes. A significant difference was found for GATA and RMP1 motifs between starch and non-starch genes.
Chi-square and Fisher’s exact analyses revealed that GATA and RMP1 motif frequencies (Figures 6A and C) were highly significant between starch and non-starch genes. The Chi-square (P)=0.018<0.05 and Fisher exact (P)=0.017<0.05 led to the rejection of the null hypothesis that motif frequencies are equal between starch and nonstarch genes in this study. Whereas, for the DOF motif frequencies (Figures 6B and D), Chi-square (P)=0.704>0.05 and Fisher exact (P)=0.724. Thus, the null hypothesis that frequencies are equal between starch and non-starch genes was not rejected.
The main objectives of this study were two fold. Firstly, to isolate and annotate the core promoter of MsBAM1 and to identify its motifs in silico in order to better understand enhanced expression of this gene in M. sativa roots. Secondly, to compare predicted motifs in MsBAM1 to those in key starch degradation genes of Arabidopsis in order to identify common motifs that suggest co-transcriptional expression. Such cotranscriptional expression could partly explain the cooperation among starch metabolic pathway enzymes demonstrated in the literature. The 226 bp sequence obtained from this study fits the description of a core promoter region containing the minimal DNA elements that are necessary for transcription initiation [30]. The core promoter region lies adjacently upstream of the start codon and generally contains some type of motif or cis-regulatory element including, but not limited to a TATA-Box. Most of the basic motifs often found at specific locations upstream from the TSS(s) are revealed in this study, and the β-amylase core promoter in question meets the criteria of a core promoter (Figure 4).
β-amylase transcripts are highly abundant in the roots of alfalfa where a large reserve of starch is found [10]. The RMP1 motif is present in 95% of promoter regions of plant genes that are expressed in roots [23]. Elmayan and Tepfer [31] demonstrated that the rolD promoter of Agrobacterium rhizogenes has the RMP1 motif and is active in the roots of Nicotiana tababum (tobacco). Two phosphate transporter promoters from M. truncatula have high frequencies of RMP1 motifs [32]. These promoters were demonstrated to drive root-specific expression of reporter genes [32]. The same RMP1 motif was predicted in silico in the β-amylase core promoter of M. sativa suggesting that it may play a role in the elevated levels of expression of β-amylase in root tissues. Therefore, the RMP1 motif in the MsBAM1 promoter may explain the root-enhanced expression of β-amylase compared to lower transcript accumulation in leaves and stems [10].
GATA factors are found in all eukaryotes. There are 29 different types of GATA transcription factors found in Arabidopsis [33]. The GATA motif is involved in numerous processes such as: germination, nitrogen utilization, greening, elongation growth, flowering, and light responses [21,33,34]. Edner et al. [21] demonstrated the interdependence of key Arabidopsis recombinant enzymes (BAM 1 & 3, ISA3, GWD) working in collaboration to degrade starch. The cooperation of starch degradation enzymes may be facilitated, in part, by the interaction of factors activating or repressing common motifs in their gene promoters resulting in a possible co-transcriptional regulation of starch degradation process. Since RMP1 and GATA were the only motifs predicted in silico that showed statistically significant differences in their frequencies in the core promoters of MsBAM1 and Arabidopsis starch degradation genes (Figures 6A and C) compared to non-starch genes, it is possible that these motifs may reflect such co-transcriptional regulation. Another frequently occurring motif (AAAG) in both Arabidopsis and M. sativa was DOF (Figures 6B and D). DOF (DNA binding with One Finger) proteins are plant specific transcription factors [22]. DOF is involved in light, phytohormones and pathogen signaling, seed development and germination, and photosynthetic carbon assimilation [22,35,36]. During germination, starch degradation occurs and DOF may serve as a prime candidate for co-transcriptional regulation in combination with other motifs such as GATA. The GATA element is an essential partner with other lightregulated elements in light activated gene expression [33]. Because the DOF recognition sequence is present in high frequency in the MsBAM1 core promoter it may contribute to the regulation of starch degradation in photosynthetic and non-photosynthetic tissues. However, it is questionable whether the DOF motif can function by itself in starch degradation genes because it was also found in high frequency in all of the seven negative controls (Figures 6B and D). Moreno-Risueno [36] showed DOF to be highly conserved in algae, eudicots, and monocots. Since DOF origins can be traced back to green alga, this implies conservation of some aspects of starch degradation in plants and algae [36].
Figure 7 is a proposed outcome of gene expression if DOF, GATA, RMP motifs work in combination to effect gene expression of starch degradation genes in M. sativa roots translated from information of Arabidopsis starch genes. It is possible that RMP1, GATA, and DOF motifs work in concert to regulate the starch degradation pathway in non-photosynthetic tissues. There is precedent for this hypothesis. Luo et al., [33] demonstrated that particular combinations of motifs in other plant processes play a role in gene regulation. The specific roles of the motifs in the MsBAM1 core promoter and the manner in which they may function to achieve co-transcriptional gene regulation still needs to be studied.
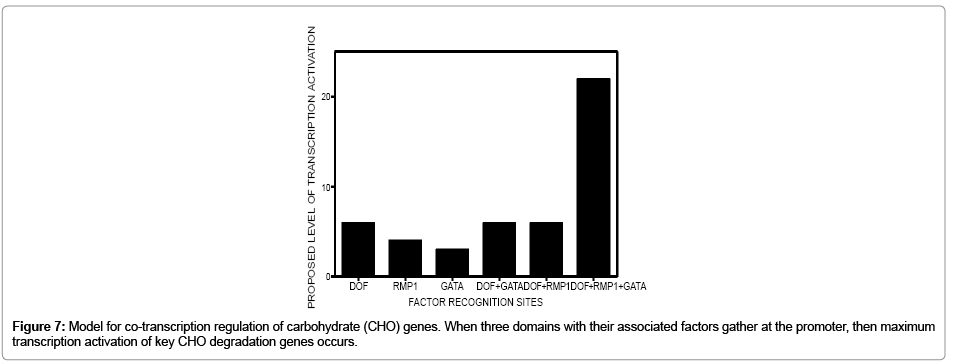
Figure 7: Model for co-transcription regulation of carbohydrate (CHO) genes. When three domains with their associated factors gather at the promoter, then maximum transcription activation of key CHO degradation genes occurs.
In summary, the M. sativa BAM1 core promoter has been identified. Three motifs (RMP1, GATA, and DOF) in this MsBAM1 core promoter region are common with those found in the core promoters of the key starch degradation genes of Arabidopsis. The root specific motif, RMP, is present in the MsBAM1 promoter and together with GATA is significantly different between starch and non-starch genes. These motifs may work in combination with other known cis-regulatory elements to confer root-enhanced expression in M. sativa roots and cotranscriptional regulation in the starch degradation pathway.
The Chicago State University Center for Teaching and Research Excellence Seed grant supported this work.