Advances in Automobile Engineering
Open Access
ISSN: 2167-7670
ISSN: 2167-7670
Research Article - (2022)Volume 11, Issue 2
These days, almost all industries in the world have undergone a change in order to reduce carbon emissions. One of the industries most affected by this change is the automotive industry. In order to obtain more efficiency on production and the products, many transformations are taking place in the automotive industry with the help of technology. Perhaps the most important part of this transformation is the electrification of vehicles. Today, fossil fuel-powered vehicles are gradually being replaced by electric-powered vehicles. This transformation takes place not only at the vehicle level; but also take place in a way that covers the entire ecosystem in order to generate, transfer, store and spend electrical energy in the most efficient way possible. It is possible to define electrification exactly in this way.
The electrification transformation has brought along many changes in vehicle architecture. While the internal combustion engines on the vehicles are replaced by electric motors; In order to provide the necessary electrical energy to the electric motor on the vehicle, batteries have been added to the vehicles. Due to this fundamental change on the power package, all systems that provide their energy from the internal combustion engine have been redesigned. Perhaps the most important of these additional systems is the steering system.
Steering systems are generally supported by the assisted forces in order to the drivers can manage the vehicle in the most comfortable way. This power assistance can be provided by hydraulic energy as well as electrical energy.
The steering system of the vehicle type we will discuss in this research work is hydraulically assisted in the internal combustion versions. With the electrification of this vehicle, which is used as a passenger bus, the need to assist the steering system with electrical energy and to optimize this energy consumption has arisen.
Within the scope of the research work; the energy consumption of the steering system of the internal combustion version of the vehicle was calculated, and data collection studies were carried out on the parameters that this energy consumption depends on. Then, taking into account the changing parameters (weight distribution, etc.) due to the electrification of the electrified vehicle, the calculation studies and the algorithm created with the collected data were applied and the results were tested.
As a result of the study, the energy consumption of the steering system of the electric passenger bus could be reduced to 2% of the total energy consumption level of the vehicle.
The steering assist force in a diesel vehicle can be driven by a mechanical system without an algorithm. The conditions needed for the assist power of the vehicle are provided by the variable flow pump. In an electric vehicle, the steering pump must be driven with electrical energy [1]. An algorithm must be designed so that the steering pump of the electric vehicle can be driven. However, the algorithm to drive the steering pump depends on many different variables, and solving this equation is a very difficult engineering problem. For this reason, it is planned to create an algorithm by utilizing the data to be collected from the vehicle already. The algorithm required to drive the electric pump in electric vehicle is aimed to be obtained from the data in the diesel vehicle. For this reason, first of all, the vehicle dynamics characteristic of the diesel vehicle has been made the same the electric vehicle [2]. Then, the algorithm obtained with the data collected from diesel vehicle was tested in the electric vehicle and the results were compared.
Vehicle specifications
As seen in Table 1, the COGs, curb weights and heights of electric E-Kent Bus and Diesel Kent C Bus are different from each other. As a result (Table 2), the vehicle dynamic behaviors of these vehicles under the same effects are also different from each other. In Table 2, the roll limits, body tilt angles and Iso lane change statistics of both buses under static and dynamic conditions are shared.
| Vehicle | Height | Load Condition | Weight | z-COG |
|---|---|---|---|---|
| Kent C | 3245 | Laden | 12510 | 1060mm |
| 3245 | Unladen | 17957 | 1109mm | |
| E-Kent | 3410 | Laden | 12510 | 1743mm |
| 3410 | Unladen | 18962 | 1562mm |
Table 1: Vehicle specifications.
| Lift-Off Limit | Roll Angle | ISO Lane Change | Tilt Table | |||
|---|---|---|---|---|---|---|
| Vehicle | G Limit | Angle Limit | Steering Angle | |||
| Kent C | 0.58G | 2.36° | 210°/4s | 0.4°/0.1G | 1.7°/0.43G | 36° |
| 0.52G | 2.1° | 190°/4s | N/A | |||
| E-Kent | 0.33G | 1.74° | 150°/4s | 0.53°/0.1G | 3.44°/0.43G | 23.7° |
| 0.39G | 2.75° | 150°/4s | 3.9°/0.43G | N/A | ||
Table 2: Vehicle dynamic characteristics.
At the beginning of the study, in order to ensure that the vehicle dynamics behavior of the diesel Kent C Bus is similar to the electric E-Kent Bus, the Diesel Kent C vehicle was modified and the vehicle scale weight, front axle and rear axle weight distributions, vehicle layouts were made similar to each other. As a result of the modifications, the COG values of the vehicles are brought to the same level and when the same inputs such as vehicle speed, steering maneuver, acceleration or braking are given; It is aimed to get similar outputs from roll, pitch, yaw moments as output.
Modifications
The basic features of both vehicles are the same. The chassis system components and their layouts are basically the same. In order to make the weight distribution of the vehicles similar, many welded constructions were carried out on the diesel vehicle and dummy weights were added.
Tests of modifications: After the modifications were completed, a number of static and dynamic tests were carried out to understand whether the vehicle dynamic characteristics of the vehicles were the same.
Within the scope of dynamic tests, diesel Kent C and electric E-Kent vehicles were tested in accordance with ISO lane change standards. The features of the track prepared in accordance with ISO lane change standards are shown in Figure 1.
In addition to the physical tests, the ISO Lane change, vehicle dynamics performances of the modified Diesel Kent C and Electric E-Kent buses were also carried out in a simulation environment.
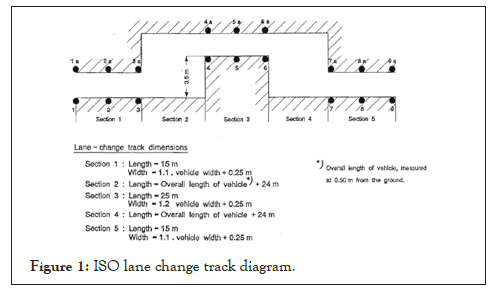
Figure 1: ISO lane change track diagram.
As can be seen in the simulation results in the Figures 2-7; the vehicle dynamic performance of the modified diesel Kent C versions of vehicle gave similar results to the electric E-Kent vehicle.
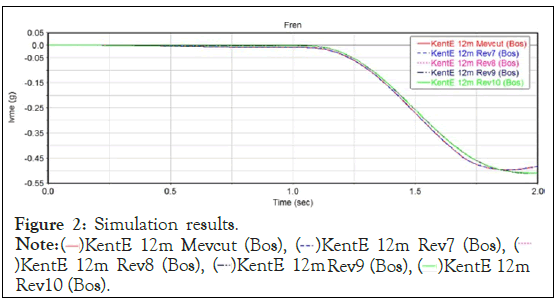
Figure 2: Simulation results.
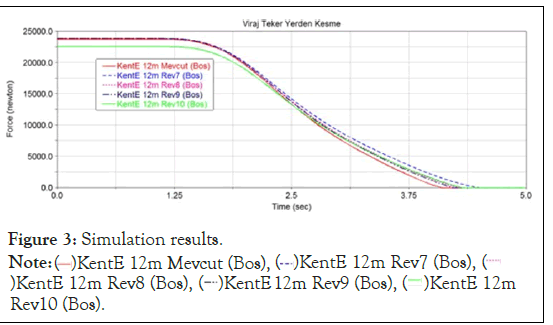
Figure 3: Simulation results.
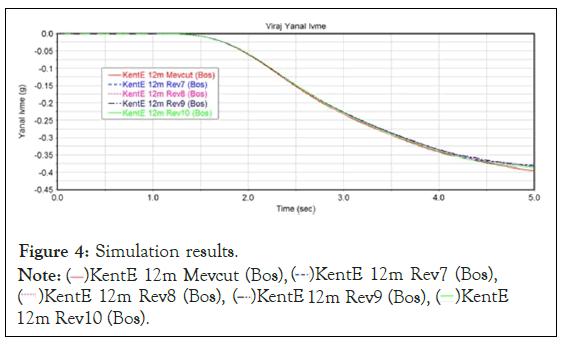
Figure 4: Simulation results.
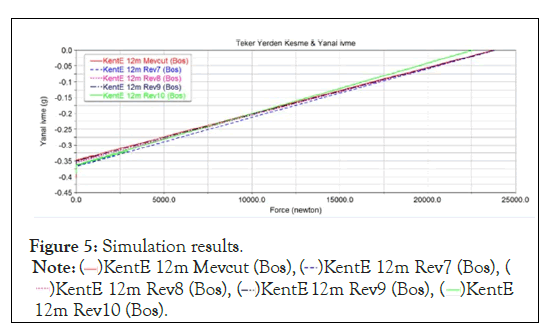
Figure 5: Simulation results.
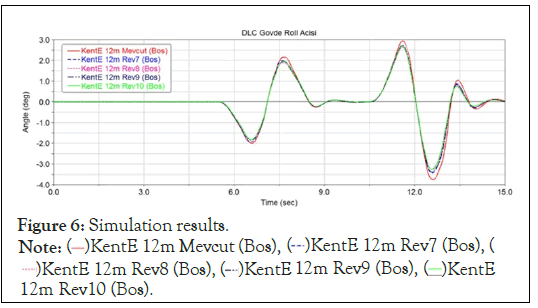
Figure 6: Simulation results.
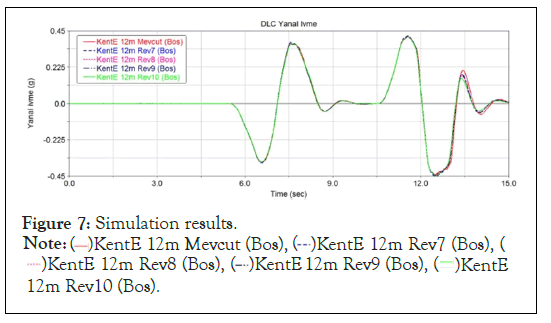
Figure 7: Simulation results.
Defining the parameters
The physical effects on the steering system are equalized for both vehicles to be tested under the same conditions. On the basis of the study is to obtain; steering pump flow rate (Q), steering pump pressure (p), vehicle speed (v), steering angle(°), front axle load (kg).
In addition to all these datas, the fuel consumption data on the vehicle was collected and the ratio of the energy consumed by the steering system to the total energy consumed by the vehicle was determined. This data will then be used to compare the total energy consumption of the electric vehicle with the energy consumption of the steering system.
Data collection
In order to collect data, the vehicles were run on Arnavutköy and Izmir routes. Both routes are real usage routes for the urban vehicle group that is the subject of the research work. On these routes, the most realistic energy consumption results have been obtained, taking into account the topographical conditions in big metropolises such as Istanbul and Izmir, which comply with UITP standards. The modified diesel vehicle was tested under different load conditions for 8 hours a day for a total of 14 days on the specified routes. The reason why data collection tests are kept so long is to ensure that the data to be collected from the vehicle covers all the usage conditions of the vehicle.
A part of the look up Table 3 created for the confidentiality of know how is shown in the table above. In the look up table, there is one steering pump flow rate corresponding to the steering angle information, front axle load and vehicle speed information in each line.
| Time (s) | Steering Angle (°) | Front Axle Load (kg) | Vehicle Speed (km/h) | Steering System Pressure (mBar) | Steering System Flow (lt/min) |
|---|---|---|---|---|---|
| 1 | 2 | 4030 | 18 | 79,63,516 | 16,098 |
| 2 | -19 | 4030 | 18 | 81,06,499 | 16,016 |
| 3 | -17 | 3965 | 19 | 82,55,698 | 17,370 |
| 4 | -17 | 3835 | 20 | 84,23,547 | 18,609 |
| 5 | -38 | 3640 | 21 | 86,28,696 | 18,385 |
| 6 | -38 | 3575 | 23 | 86,41,130 | 18,296 |
| 7 | -21 | 3510 | 26 | 86,22,479 | 18,516 |
| 8 | -12 | 3445 | 28 | 86,65,996 | 19,134 |
| 9 | -19 | 3315 | 31 | 86,16,263 | 19,287 |
| 10 | -39 | 3185 | 33 | 84,98,146 | 19,067 |
| 11 | -28 | 3640 | 35 | 83,05,431 | 19,030 |
| 12 | -31 | 3445 | 36 | 82,30,831 | 19,056 |
| 13 | -35 | 3835 | 38 | 80,75,416 | 19,209 |
| 14 | -40 | 3510 | 39 | 79,32,433 | 19,101 |
| 15 | -41 | 3835 | 39 | 78,26,750 | 19,015 |
| 16 | -41 | 3965 | 40 | 76,83,767 | 18,870 |
| 17 | -33 | 4030 | 40 | 76,34,034 | 18,654 |
| 18 | -29 | 4030 | 40 | 76,71,334 | 18,370 |
| 19 | -45 | 4030 | 40 | 76,21,601 | 18,307 |
| 20 | -34 | 4030 | 40 | 75,96,734 | 16,501 |
| 21 | -40 | 4030 | 41 | 76,52,684 | 15,538 |
| 22 | -26 | 4030 | 41 | 76,40,250 | 15,534 |
| 23 | -41 | 4030 | 41 | 76,21,601 | 14,534 |
| 24 | -41 | 3965 | 41 | 76,34,034 | 14,538 |
| 25 | -44 | 3965 | 42 | 76,15,384 | 13,769 |
| 26 | -44 | 3965 | 42 | 75,40,784 | 14,836 |
| 27 | -36 | 4095 | 41 | 74,59,968 | 14,810 |
| 28 | -36 | 4095 | 41 | 74,35,102 | 14,825 |
| 29 | -35 | 4095 | 41 | 73,35,635 | 14,821 |
Table 3: Data collected from routes.
Algorithm design
The 3D look up table created as a result of the current filtering is as in the graphic above. On the input side of this look up table, there is steering angle (°), vehicle speed (km/h), front axle load (kg) data. As an output; Flow rate (l/minute) value is included. After the flow value, since the pump displacement volume (cc) is certain, the electric motor will be switched to the speed and the steering pump electric motor will be driven in line with this speed information.
The generated block diagram is shown in Figure 8 below as a representation. As explained in the previous sections; the data already produced on the vehicle will be used as input. As a process; In return for the data line containing the value read from each data, there is a flow value as output. This flow value is the flow that the vehicle's electric power steering pump should produce. The vehicle's steering pump is a fixed displacement gear pump. The ratio of the flow rate to the displacement of the pump will give the speed of the pump.
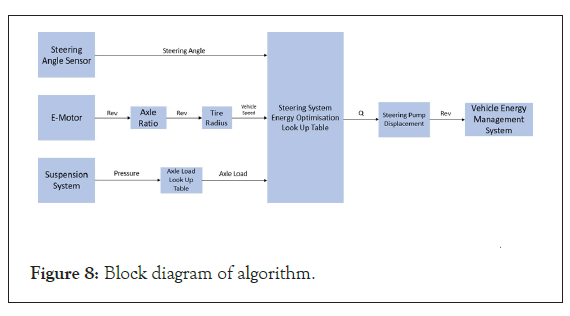
Figure 8: Block diagram of algorithm.
Applications and tests
The algorithm was loaded on the multiplexers of the E-Kent vehicle and the steering pump of the electric vehicle was started. The steering pump was first tested within the scope of safety at the test center of Otokar Otomotiv ve Savunma Sanayi A.S.'s during these tests, scope controls were made for the active force values of the vehicle's steering system within the scope of UN ECE R79 regulations. During the regulation tests, the force coming from the steering wheel of the vehicle was monitored..
After making sure the software security and meeting the regulation conditions, the vehicles were tested in the same route, scope and time period as they were tested during the data collection phase. During the test, vehicle energy consumption data, steering system energy consumption data, steering system pressure and steering pump speed information were also collected from the vehicle via the vehicle CAN Line.
In addition, the same tests were repeated for a standard diesel Kent C vehicle for the same route, scope and time. The graphs created with the data collected from Diesel Kent C and E-Kent vehicles during the tests are shown in Figures 9-14.
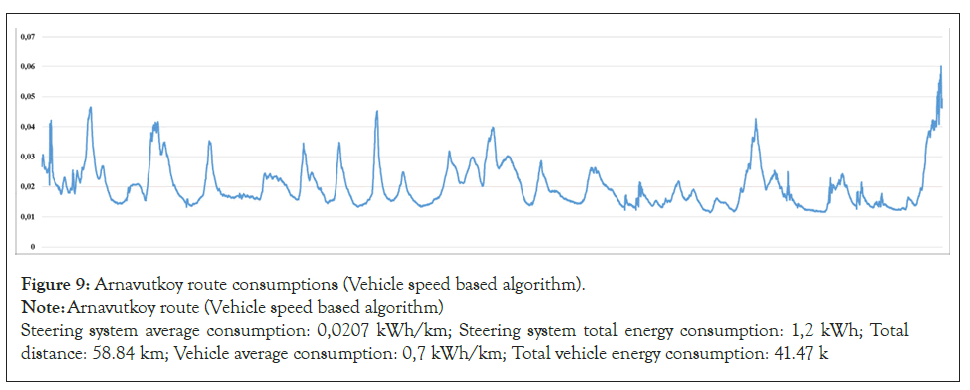
Figure 9: Arnavutkoy route consumptions (Vehicle speed based algorithm).
Note: Arnavutkoy route (Vehicle speed based algorithm)
Steering system average consumption: 0,0207 kWh/km; Steering system total energy consumption: 1,2 kWh; Total
distance: 58.84 km; Vehicle average consumption: 0,7 kWh/km; Total vehicle energy consumption: 41.47 k
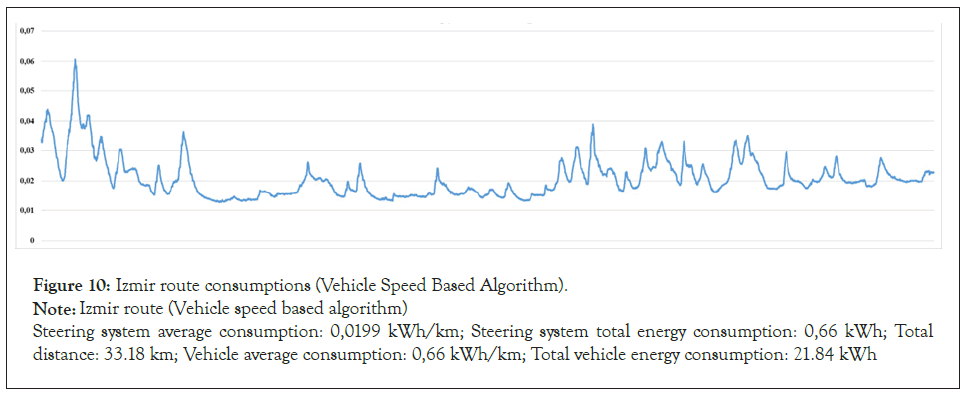
Figure 10: Izmir route consumptions (Vehicle Speed Based Algorithm).
Note: Izmir route (Vehicle speed based algorithm)
Steering system average consumption: 0,0199 kWh/km; Steering system total energy consumption: 0,66 kWh; Total
distance: 33.18 km; Vehicle average consumption: 0,66 kWh/km; Total vehicle energy consumption: 21.84 kWh
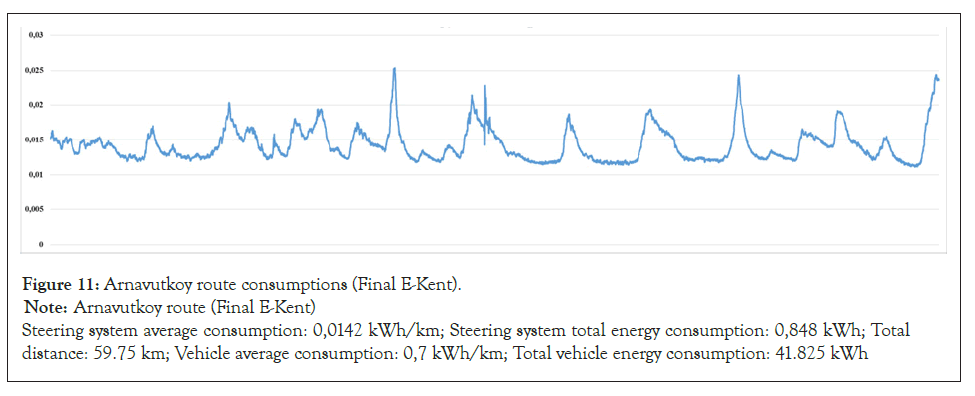
Figure 11: Arnavutkoy route consumptions (Final E-Kent).
Note: Arnavutkoy route (Final E-Kent)
Steering system average consumption: 0,0142 kWh/km; Steering system total energy consumption: 0,848 kWh; Total
distance: 59.75 km; Vehicle average consumption: 0,7 kWh/km; Total vehicle energy consumption: 41.825 kWh
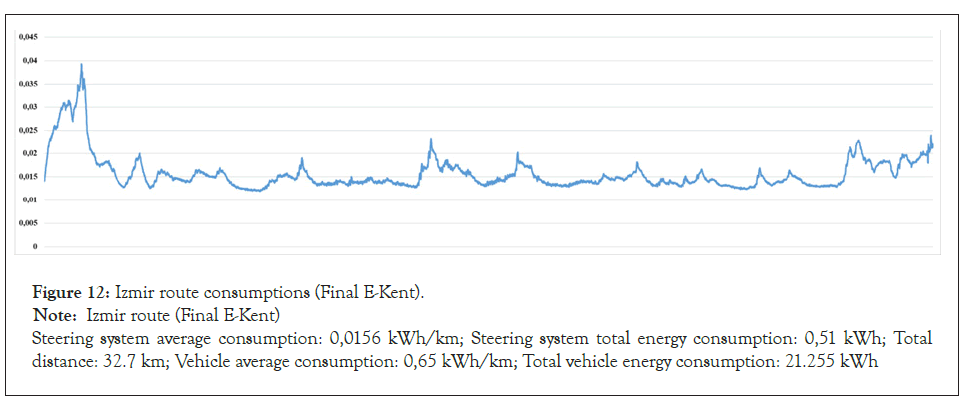
Figure 12:Izmir route consumptions (Final E-Kent).
Note: Izmir route (Final E-Kent)
Steering system average consumption: 0,0156 kWh/km; Steering system total energy consumption: 0,51 kWh; Total
distance: 32.7 km; Vehicle average consumption: 0,65 kWh/km; Total vehicle energy consumption: 21.255 kWh
Figure 13: Arnavutkoy route consumptions (Diesel Kent C).
Note: Arnavutkoy route (Final E-Kent)
Steering system average consumption: 0,0189 kWh/km; Steering system total energy consumption: 1,094 kWh; Total
distance: 57,9 km; Vehicle average consumption: 43,61/100 km; Total vehicle energy consumption: 25241
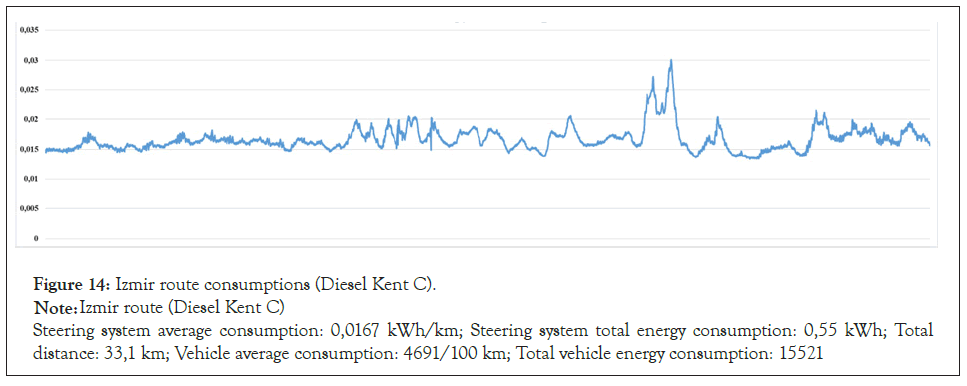
Figure 14: Izmir route consumptions (Diesel Kent C).
Note: Izmir route (Diesel Kent C)
Steering system average consumption: 0,0167 kWh/km; Steering system total energy consumption: 0,55 kWh; Total
distance: 33,1 km; Vehicle average consumption: 4691/100 km; Total vehicle energy consumption: 15521
Firstly, the electric E-KENT was tested only with the speed based algorithm. The steering system average energy consumption of the vehicle which was tested on Arnavutköy and Izmir routes was around 0.02 kWh/km. This value is approximately 3% of the vehicle's total energy consumption as shown in Figures 9 and 10.
In the next tests, the algorithm developed within the scope of the research work was loaded on the E-Kent and the vehicles were tested on the same routes. As can be seen in the graphics, the average energy consumption of the steering system can be reduced to 0.015 kWh/km with the newly designed algorithm. This value is approximately 2% of the vehicle's total energy consumption as shown in Figures 11 and 12.
Finally, the diesel Kent C was tested on the same routes. The energy consumption values (Table 4) in the diesel vehicle were calculated with the help of the steering pump flow rate and steering system pressure collected from the vehicle. As a result of the tests, it has been observed that the energy consumption of the diesel Kent C varies in a wider range. This is due to the variable operation of the vane pump on the vehicle and the high losses on the system. The average energy consumption of the Kent C steering system is approximately 0.017 kWh/km as shown in Figures 13 and 14.
|
Total Distance (km) | Steering System average consumption (kWh/km) | Steering System total energy consumption (kWh) | Vehicle average energy consumption (kWh/km) | Vehicle total energy consumption (kWh) | The ratio of the energy consumption of the steering system to the energy consumption of the all vehicle | |
|---|---|---|---|---|---|---|---|
| Vehicle speed based algorithm | Arnavutkoy | 58,84 | 0,027 | 1,20 | 0,70 | 41,47 | 2,96% |
| Izmir | 33,18 | 0,0199 | 0,660 | 0,66 | 21,84 | 3,02% | |
| Final Algorithm | Arnavutkoy | 59,75 | 0,0142 | 0,848 | 0,70 | 41,83 | 2,03% |
| Izmir | 32,70 | 0,0156 | 0,510 | 0,65 | 21,26 | 2,40% | |
| Diesel Kent C | Arnavutkoy | 57,90 | 0,0189 | 1,094 | 43,6 It/min | 25,24 It | NA |
| Izmir | 33,10 | 0,0167 | 0,550 | 46,9 It/min | 15,52 It | NA | |
Table 4: Consumption values.
Steering systems of vehicles are one of the most important systems in terms of safety, comfort and functionality. Considering the development of the automotive industry in recent years, the design of the steering system, like many systems on the vehicle, is taken again with a different perspective and engineering approach [3]. Systems on existing conventional vehicles are the output of the automotive foundation of nearly 100 years of development [4]. The systems and regulations currently used today have been configured simultaneously to this day. Within the scope of the electrification transformation we are in today, the engineering problem in this transition needs to be solved very quickly [5].
This research work focuses on solving the mentioned engineering problem with the fastest, most profitable and optimum method from an industrial point of view [6].
Vehicle steering systems are extremely complex. At the same time, since it is one of the most safety critical elements on the vehicle, it is controlled by many regulations [7]. As there are many cases that need to be solved on the functionality side of the vehicles, there are also many engineering problems that need to be overcome in safety issues. Only the design and adaptation of the steering box on the vehicle requires a great deal of engineering work [8].
With the study, which is the subject of the research work, a solution to an engineering problem, which is very complex to be solved, has been produced thanks to the algorithm that is run through the data obtained from the vehicle [9,10]. This algorithm was created with real-time data obtained as a result of tests performed on another vehicle.
In conclusion of the tests, the steering system energy consumption of the algorithm-loaded electric vehicle consumed 25% less energy than a vehicle whose vehicle speed base controlled steering system. In addition, with the new algorithm, the energy consumed by the steering system can be reduced to 2% of the entire energy consumption of the vehicle. With the currently developed algorithm, the steering system of the electric E-Kent vehicle consumes 12% less energy than the diesel Kent C vehicle.
Citation: Ergül U (2022) Electric City Buses Steering System Energy Consumption Optimisation. Adv Automob Eng. 11:183.
Received: 03-Feb-2022, Manuscript No. AAE-22-15649; Editor assigned: 10-Feb-2022, Pre QC No. AAE-22-15649 (PQ); Reviewed: 24-Feb-2022, QC No. AAE-22-15649; Revised: 03-Mar-2022, Manuscript No. AAE-22-15649 (R); Published: 10-Mar-2022 , DOI: 10.35248/2167-7670.1000183
Copyright: © 2022 Ergül U. This is an open-access article distributed under the terms of the Creative Commons Attribution License, which permits unrestricted use, distribution, and reproduction in any medium, provided the original author and source are credited.