Journal of Sleep Disorders & Therapy
Open Access
ISSN: 2167-0277
ISSN: 2167-0277
Research Article - (2014) Volume 3, Issue 2
Sleep quality is affected in patients with sleep apnea- hypopnea syndrome (SAHS) with nocturnal and diurnal consequences. Most of these patients who are treated with positive airway pressure (CPAP) return to normal sleep patterns. We could consider good sleepers those patients who present more sleep spindles in stage II, and slower wave sleep as a good sign of better sleep quality.
The objective in this research study was to compare the microstructure of stage II using the number of spindles and the increase of slow wave sleep before and after CPAP night titration.
We developed a wavelet filter using a spline cubic function from a wavelet mother, which was appropriate to be used over electroencephalographic signal. By means of this filter in a multi-resolution mode, the spindles were detected from the increase of the IV band power; the sampling rate of the device determined the filter characteristics. The staging of polysomnographic studies was made by an expert according AASM (American Academy of Sleep Medicine) and then processed by the filter to get the index of sleep spindles before-and-after CPAP during stage II as well as the relationship between fast and slow powers from the EEG signal. An increase in the power of the slow waves vs. fast activity was observed in all the cases as a feature of better sleep. The neuroprotective effect described in previous research works regarding the density of the sleep spindles seems to be detected in patients improving their sleep quality after the correction of the apnea-hypopnea syndrome using CPAP.
Keywords: Sleep spindles; Polisomnographic; Wavelets analysis; Slow wave sleep; CPAP
The Sleep Apnea-Hypopnea Syndrome (SAHS) is a disorder characterized by recurrent episodes of either a partial or complete collapse of the upper airway during sleep. The resulting reduction of the airflow leads to alterations in gas exchange as well as recurrent arousals causing sleep fragmentation.
The prevalence rate is 3-7% and 2-5% in men and women respectively [1-3]. Clinically, somnolence is the most important symptom and it depends on the sleep fragmentation caused by microarousals related to respiratory effort and intermittent hypoxemia or both. With CPAP treatment, it is possible to achieve shorter times of reaction in vigilance tests as well higher levels in talking, visual and spatial memory tasks. It is also possible to improve depression and anxiety scores.
Spindles are structures of sleep EEG with a frequency range between 12 and 15 Hz, and with a duration of more than 0.5 seconds and a minimum width of 15 mV [4,5]. In previous studies comparing frequency patterns of spindles in patients with sleep apnea vs. control subjects, there was less frequency of sleep spindles within the former group, with no increase of spindles towards the end of the night [6].
Accordingly, the aim of the present work was to study the increase of spindles in phase II and slow wave sleep power vs fast wave sleep power frequency in patients with severe sleep apnea syndrome, quantifying them by indexes, before and after modifying the breathing pattern with CPAP treatment, considering these changes features of stable sleep.
We have performed the analysis of the sleep structure in the polysomnographic studies of 10 patients at baseline situation and postcalibration of CPAP to score sleep according to AASM standards [7].
Records were taken through the following standard:
1. Three channels of EEG: Two central (C3 and C4) and one occipital (O1) referenced to the left and right mastoids (A2 and A1) (systems 10-20) with sampling frequency of 349 Hz.
2. Two EOG channels with left and right eyelid electrodes.
3. Three EMG channels, two of them in sub-chin position and the other one in tibial location with a sampling frequency of 349 Hz.
4. EKG recorded from two electrode derivations in the second right and left intercostals space in paraesternal location with a sampling frequency of 349 Hz.
5. Oronasal flow sensors. One of them, of a thermistor type, and a nasal cannula with a pressure transducer to detect flow limitation through nasal pressure measurement.
6. A thoracic and abdominal piezoelectric band to record breathing effort.
7. A body position sensor.
8. Pulse oxymetry.
All records were carried out with 18-channel ATI Praxis equipment specially designed for polysomnography. (Polysomnograph equipment, Praxis 18-Line AMP18P-Lermed s.r.l Trade Mark).
Visual assessment of the alpha band power behavior with respect to the marked micro-awakenings was performed with the software associated with the AMP 18P. The remaining algorithms required to calculate the synchronization between ECG and EEG channels were developed with the help of MatLab 7.0.
Polysomnographic tracings in NREM stage were chosen and read sequentially in order to avoid the bias produced by the simultaneous observation of EEG and breathing events. At first, the EEG scoring was performed according to AAMS standards [7]; arousals are defined as an abrupt shift of EEG frequency including alpha, theta and/or frequencies greater than 16 Hz (but not spindles) that last at least 3 seconds, with at least 10 seconds of stable sleep preceding the change. Scoring of arousal during REM requires a concurrent increase in sub mental EMG lasting at least 1 second.
The respiratory events were classified as follows:
Apneas: There is a drop in the peak signal excursion by ≥ 90% of pre-event baseline using an oronasal thermal sensor (diagnostic study), PAP device flow (titration study) or an alternative apnea sensor (diagnostic study), during ≥ 10 seconds. Score an apnea as obstructive if it meets apnea criteria and is associated with continued or increased inspiratory effort throughout the entire period of absent airflow, as central if it meets apnea criteria and is associated with absent inspiratory effort throughout the entire period of absent airflow, and an apnea as mixed if it meets apnea criteria and is associated with absent inspiratory effort in the initial portion of the event, followed by resumption of inspiratory effort in the second portion of the event.
Hypopnea: The peak signal excursions drop by ≥ 30% of pre-event baseline using nasal pressure (diagnostic study), PAP device flow (titration study), or an alternative hypopnea sensor (diagnostic study) during ≥ 10 seconds. There is a ≥ 3% oxygen desaturation from preevent baseline or the event is associated with an arousal.
Respiratory effort-related arousals, score a respiratory event as a respiratory effort-related arousal (RERA) if there is a sequence of breaths lasting ≥ 10 seconds characterized by increasing respiratory effort or by flattening of the inspiratory portion of the nasal pressure (diagnostic study) or PAP device flow (titration study) waveform leading to arousal from sleep when the sequence of breaths does not meet criteria for an apnea or hypopnea.
We have scored the severity of the disease according to the RDI (respiratory disturbance index) calculated as: numbers of respiratory events/Total sleep time x 60. More than 15 events/hour are considered an index of severity to determine the application of CPAP.
To obtain an optimal CPAP titration, we have taken into account the elimination of respiratory events or their reduction to reach a residual respiratory disturbance index not exceeding 5/h.
An adequate oxygenation and the lack of arousals partially ensure some improvement of sleep quality.
As a measure of this improvement in phase II sleep, we defined in this work the index IS=spindles number /time (minutes) and the index IW=SWP/FWP as the relationship between the power of slow and rapid waves with independence of the spindle frequency.
The wavelet transform gives us a powerful tool to analyze, from a time-frequency point of view, very diverse problems in applied sciences or pure mathematics [8-12].
A wavelet is a smooth and quickly vanishing oscillating function with good localization in both frequency and time.
A wavelet family ψa,b(t) is a set of elemental functions generated by dilations and translations of a unique admissible mother wavelet ψ(t):
ψa,b(t) = ¦a¦-1/2ψ(t-b/a)
Where a, b ? R, a ≠ 0 are the scale and translation parameters respectively and t is the time. As a increases, the wavelet becomes narrower. Thus we have a unique analytic pattern and its replicas at different scales and with variable localization in time.
Given a finite energy signal S(t), the different correlations < S, ψa,b> indicate how precisely the wavelet function locally fits this signal at every scale a. This correlation operation defines the transformation that synthesizes the numerical information obtained in this way. From a different viewpoint, the wavelets of a family play the role of elemental functions, representing the functions as a superposition of wavelets correlated with the function for different scales (different a’s). This makes it possible to organize the information in some particular structure to distinguish, for example, trends or the shape associated with long scales of the local details from corresponding short scales.
For the special selection of the function ψ and a discrete net of parameters aj = 2-j and bj,k = 2-j k, with j, k ? Z and the scale 2-j give us the shift parameter.
The subfamily
Ψj,k(t) = 2j/2 Ψ(2j (t-k))j, k ? Z
constitutes an orthonormal basis of the Hilbert space L2 (R). In this way, we can obtain discrete transformations, and it is possible to expand the signal in series of wavelets.
The discrete wavelet transform associated with ψ is simply seen as a restriction of the continuous wavelet. In this case, as it is well known, the information given by the discrete wavelet transform can be organized according to a hierarchical scheme of nested subspaces called multi resolution analysis in L2 (R).
In the present analysis, we used a multirresolution scheme based on cubic orthogonal spline functions as a mother wavelet, with a discretized version of the integral wavelet transform given by Unser (Unser, [8]). We selected this wavelet due to the fact that it forms a base in L2 (R) with a very convenient characteristic of symmetry and simplicity:
where Φ(t) is the cubic cardinal spline.
For any resolution level N<0 we can write the decomposition of the signal as:

where Cj(k )are the wavelet coefficients and the sequence {sN(k)} represents the coarser signal data at resolution level N.
The second term is the wavelet expansion.
Since the family  is an orthonormal basis for L2 (R), the concept of energy is linked with the usual notions derived from the Fourier theory. The sum
  gives us the energy of the details of S(t) at level j; and the total energy is given by
The polysomnographic system used for this research study let us obtain the raw data of each biological signal. Accordingly, we were able to develop the wavelet algorithm in the MATLAB programming environment.
We divided the EEG signals into 5 wavelet levels and we calculated a filter involving the characteristic frequencies of the sleep spindles (a burst with a spindle shape with frequencies between 11 and 15 Hz).
According to the characteristics of the multi-resolution scheme and sample rate of our equipment (349 Hz), spindles can be correlated to level 4 of a multi-resolution scheme.
Using the condition that the cubic spline functions constitute a base, each octave in which the signal is unfolded is linearly independent.
This enables us to calculate the energy of each octave independently by squaring the coefficients of the decomposition.
Using the power of the filtered signal in the band between 11 and 15 Hz as a way of viewing the spindles is both practical and graphic since the presence of a spindle is viewed as an increase of the resulting signal power.
In this manner it is simple to count spindles either manually or with peak-counting software. The software used for the wavelet analysis of the EEG signal was developed in Delphi language in order to connect it to the commercial software, with the authorization of the manufacturers and using windows to display and compare the signals.
As this multiresolution scheme let us calculate the energy of each octave independently, by squaring the coefficients of the wavelet decomposition, we define SPW summing the wavelet levels since 0.5 Hz to 8.0 Hz, and FWP summing the levels since 8.0 Hz to 30 Hz.
The one-way ANOVA test was used to evaluate the differences between the indexes RDI, IS and IW in pre and post CPAP conditions. In the same way, by using the two-way ANOVA test, we evaluated the behavior of pre and post CPAP IS during the three different periods in which we divided every night of study. In all cases, we considered a 95% confidence level (p<0.05).
Table 1 shows the demographic characteristics of the patients and the respiratory disturbance index (RDI) pre and post CPAP results of the index. Statistical differences were observed when we compared the RDI (respiratory disturbance index) before and after CPAP.
| Patient | Age | Sex | weigh | height | BMI | RDI PRE | RDI POST |
|---|---|---|---|---|---|---|---|
| P1 | 62 | M | 82 | 1,67 | 29,40 | 68 | 6,4 |
| P2 | 70 | F | 51 | 1,55 | 21,23 | 24,3 | 4,67 |
| P3 | 70 | F | 61 | 1,58 | 24,43 | 14,9 | 6 |
| P4 | 66 | F | 118 | 1,58 | 47,27 | 36,5 | 5,2 |
| P5 | 60 | M | 107 | 1,8 | 33,02 | 37,3 | 0,45 |
| P6 | 75 | M | 128 | 1,76 | 41,32 | 56,6 | 24 |
| P7 | 65 | M | 89 | 1,78 | 28,09 | 56 | 5,6 |
| P8 | 47 | F | 85 | 1,69 | 29,76 | 25,8 | 2,5 |
| P9 | 76 | F | 74 | 1,59 | 29,27 | 32,5 | 1,2 |
| P10 | 69 | M | 82 | 1,63 | 30,86 | 20,6 | 2,7 |
Table 1: Patient data, BMI: body mass index, RDI: respiratory disturbance index pre and post CPAP.
Table 2 shows, for every patient, the indexes IS and IW before and after use of CPAP for the hole night.
| Patient | ISPr | ISPo | IWpr | IWpo |
|---|---|---|---|---|
| 1 | 1.2 | 1.5 | 3,5 | 13,1 |
| 2 | 1.2 | 1.9 | 1,8 | 25,2 |
| 3 | 0.87 | 1.6 | 2,5 | 15,7 |
| 4 | 1.18 | 1.30 | 2,7 | 20,6 |
| 5 | 1.61 | 1.74 | 2,1 | 15,4 |
| 6 | 1.18 | 2.14 | 3,5 | 5,2 |
| 7 | 2. | 2.16 | 4,3 | 17,2 |
| 8 | 1.74 | 1.89 | 2,2 | 7,3 |
| 9 | 1.56 | 2.6 | 0,9 | 1,2 |
| 10 | 2.1 | 2.7 | 1 | 2,1 |
Table 2: ISPr :spindles number /time (minutes) pre CPAP, ISPospindles number / time (minutes) post CPAP. IWprand, IWporelationship between the power of slow and rapid waves pre and post CPAP.
There was an average percentage growth of the spindle rate per minute (IS) in all cases and an increase in the IW too. The use of CPAP leads to an increase in IW which is much higher than the increase of the index IS.
Statistical analysis (with α= 0.05) showed significant differences between the indexes IS before and after CPAP.
The relationship between slow wave power vs. fast waves (IW) statistical analysis of the indices (with α=0.05) showed significant differences pre and post CPAP.
To make a more detailed analysis, the nights were divided into thirds and spindles were counted in each. Table 3 shows the results for the IS index in each third of the night. Figure 1 show, plotted for the three thirds, pre and post CPAP IS indexes for each patient.
| ISPo | ISPr | |
|---|---|---|
| P1 | 1,72 | 1,3 |
| 1 | 1,27 | |
| 0,94 | 2,14 | |
| P2 | 1,53 | 1,9 |
| 1,4 | 1,96 | |
| 1,78 | 1,82 | |
| P3 | 0,73 | 1,51 |
| 1,06 | 1,76 | |
| 0,85 | 1,67 | |
| P4 | 1,2 | 1,03 |
| 1,12 | 1,39 | |
| 1,18 | 1,37 | |
| P5 | 1,54 | 1,75 |
| 1,57 | 1,57 | |
| 1,72 | 1,88 | |
| P6 | 1,2 | 2,21 |
| 0,8 | 1,73 | |
| 1,41 | 2,16 | |
| P7 | 2 | 2,78 |
| 1,8 | 2,3 | |
| 2,18 | 1,86 | |
| P8 | 1,55 | 1,7 |
| 2,02 | 1,75 | |
| 1,81 | 2,5 | |
| P9 | 1,55 | 3,28 |
| 1,53 | 2,27 | |
| 1,61 | 2 | |
| P10 | 2,13 | 2,35 |
| 2,16 | 2,75 | |
| 2,27 | 2,75 |
Table 3: ISPo/r are the ISP index with and without CPAP during each third of the sleep time, for each patient.
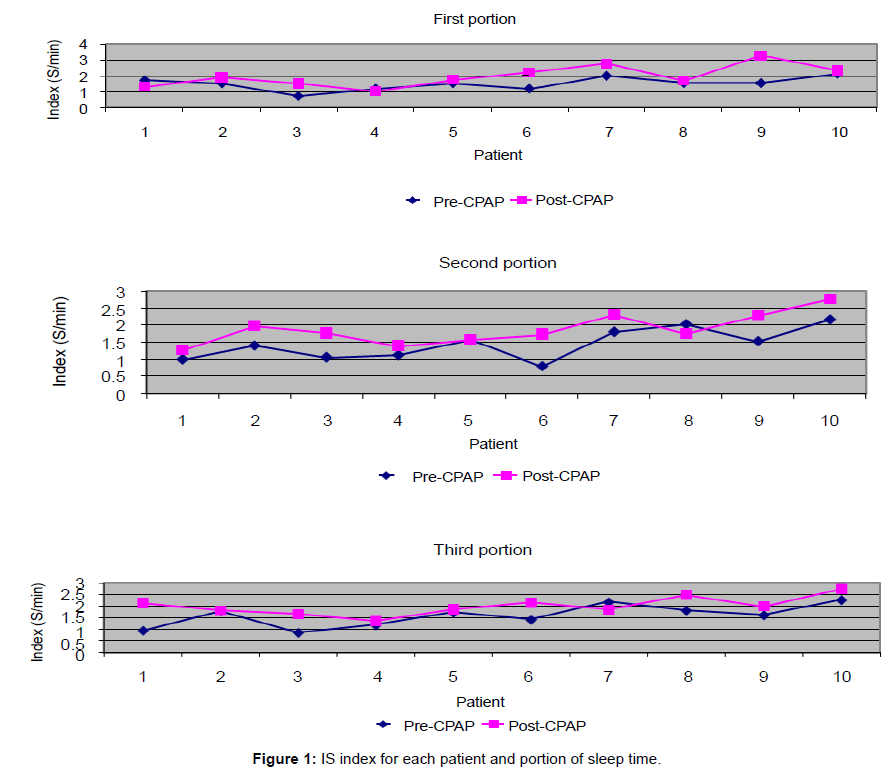
Figure 1: IS index for each patient and portion of sleep time.
In the sample used, no significant differences were observed in the three night-time periods, either with or without CPAP, using the statistical variance F to a 95% confidence level. Significative differences were found for each third, pre and post CPAP.
The new proposed indexes, IS and IW, show a coherent behavior with the traditional RDI. These new indexes represent physiological information instead only statistical. We centralized our analysis in phase II.
Both indexes represent an indication of the physiological response to the CPAP use. Both are a representation of sleep quality but as it is well known, both have different neurological sources. It is interesting that both have a coherent response.
In our study, we detected a significant increase of the spindles/time index in patients with sleep breathing disorders, before and after the night of CPAP titration. There were no significant differences in the rate of spindles/time when we took into account three different times at night. In the same sense, the increase of slow wave power vs. fast frequencies in EEG in studies with CPAP supports the hypothesis of the sleep protecting function in the transition of stage II to SWS.
The automatic spindle analysis has been technically solved with enough accuracy to detect these structures with antecedents in literature published since 1979, showing a good correlation between automatic and manual analysis and achieving 90% accuracy [13,14]. However, automatic scoring cannot take into consideration the differences in type and frequency of spindles [15]. In our study, we reached be very good results in identifying sleep structures using manual and automatic models to read polysomnographic tracings.
Old reports related sleep spindles as inhibitors of arousals and sleep preserver function; Hongo et al. [16] and Gaillard respectively [16,17] associated them with arousal inhibition. Accordingly, considering the K-complex as a possible transitory activation reaction, there is a description of an antagonistic effect with respect to the spindles, in other words, the higher the number of spindles, the fewer K-complexes. K-complexes represent an organismic state leading towards activation reaction [5]. Gora et al. [18] describe a “blunted” response to occlusion stimulus to elicit K-Complex in mild OSAS patients. We cannot detect a typical pattern in K-Complex distribution in relationship to Sleep Breathing Disorder before and after CPAP titration.
However, spindles participate in an activating effect through different ways generating thalamic activation processes for inhibiting access during NREM intrusive sounds, protecting the stability of sleep [19]. They also participate in sensory-motor processes and memory information [20].
The transition from low to high delta activity (starting in phase II with the progression from 3 to 4), which may indicate the deepness of sleep, supports the hypothesis of the relationship “sleep spindles-sleep stabilization”, and sleep protecting function [15].
Patients with SAHS showed a lower level of neurocognitive information processing, initially related to sleep fragmentation and, secondly, to hypoxia episodes [19,20]. Hence, we hypothesized that other mechanisms, like the structural alterations of sleep that we observed in this study, can act as co-factors adding to transient arousal and hypoxia.
There are special situations to consider; in children, lower levels of sleep disruption were observed. NREM 2 sleep decreases but slow wave sleep is fairly preserved [21,22]. Sleep quality in obese patients is affected independently of the presence of sleep-related respiratory disorders with increased superficial sleep stages and decreased efficiency [23,24]. Even in patients with mild SAHS, a lower rate of sleep spindles, deep slow-wave sleep (SWS) and a greater index of arousal were observed in comparison with controls [25].
Although the efficacy of positive pressure for the elimination of respiratory events is fairly acknowledged, few details about its effect on sleep structure have been evaluated.
The slow spindle frequencies in apnea patients could indicate disturbed sleep and altered neural mechanisms in the structures regulating sleep spindle activity [26].
Loredo et al. [27] studied the effect of CPAP treatment on sleep quality in patients using the device for a short term and found no differences in those compared with sham CPAP [27].
More recently, an evaluation in the long term after an average 9-month CPAP use, the increase of deep slow wave sleep observed in the patients treated was similar to the proportion of SWS seen in the control group [28]. There was more SWS in prefrontal areas both before and after CPAP treatment, and SWS increased significantly more in prefrontal than central areas during treatment; even using a central location of electrodes, significant changes were obtained in SWS proportion [29].
The decrease of the tendency to present arousals in deep slow wave sleep would be the explanation for the increased neuromechanical stability of the upper airway at this stage of sleep [30-32] even though the compensatory ventilation response in either deep slow wave sleep or stage II does not appear to be different when assessed through the use of dial-down techniques from therapeutic levels of CPAP. The only finding that establishes a difference is that in phase II, the arousal threshold is lower than in the slow sleep pattern [33].
As far as we know, there are no bibliographic references about structural changes in sleep in relation to the effect of nasal positive pressure during the titration process in the same patient. The choice of indexes of spindles/minute, or the relationship SWS/fast frequencies seems to illustrate more clearly, according to our criteria, the change of EEG frequencies rather than their absolute variations as dynamic indicators of the changes generated by the treatment, showing significant modifications in the sleep microstructure as a sign of therapeutic success in the same patient.
However, it should certainly be emphasized that in our study, we can add sleep structural modifications to sleep and oximetric stability to consider efficient CPAP titration, and with long term use of CPAP, the improvement in both the clinical and the neurocognitive courses can be achieved.
We think that a multirresolution scheme filter, using a mother wavelet cubic spline, is an appropriate tool to isolate sleep microstructures patterns. Furthermore, assessments should include the evaluation of the clinical impact of these changes in sleep structure, and the comparison of the acute effect of sleep deprivation in individuals without sleep breathing disorders.