Journal of Pollution Effects & Control
Open Access
ISSN: 2375-4397
ISSN: 2375-4397
Research Article - (2016) Volume 4, Issue 3
During the last couple of decades, the economic sector related to hydrocarbon resources has been one of the most attractive for investors. As a result of different exploration activities for crude oil, ecosystems in general and the aquatic ecosystem in particular have suffered a huge disadvantage. These industrial activities have increased the risk of water contamination and have caused serious problems for water environmental systems and their species. The intent of this paper is to introduce promising ways for solving contamination problems of aquatic environment. Although our approach is simple, but it can help to achieve a considerable change in the contamination ranks. Our study proposes an easy method to decrease the crude oil pollution by using different instrumental techniques to investigate the percentages of pollution under a control condition contamination process by checking the concentration of different cations like (calcium Ca+2, sodium Na+, potassium K+), anions like (chloride Cl-, nitrate NO3 - , sulphate SO4 -2), heavy metals like (Pb+2) , and different quality measurements such as, ionic composition, hydrogen ion concentration (PH), total dissolved solid (TDS) mg/L, and electron conductivity (EC) μS/cm of water samples collected from Darbandikhan reservoir, and crude oil samples collected from Khurmala oil field located between Erbil and Kirkuk Province. After careful investigations, it is concluded that except Pb+2 and TDS, rest of the data are at the permissible limits. The record of ranges of these data for both river (samples) and drinking water (samples) were respectively Ca+2 (1-4.5) mg/L, Na+ (2.-13) ppm, K+(0.47-0.89) mg/L, Pb+2 (0.434-1.166) mg/L, Cl- (0.0009-1.5) mg/l, SO4 -2 (40.8-87.9) mg/l, NO3 - (2.29-4.65) mg/L, EC (0-1697) μS/cm, Hardness(0.000096-0.02) mg/L, TDS(0-780.6) mg/L. Ca+2 (4.2-4.5) mg/L, Na+(6.9-7) mg/L, K+(0.07-0.15) mg/L, Pb+2 (1.16-1.24) ppm, Cl- (0.0011-0.125) ppm, SO4 -2 (79.15-87.9) mg/L, NO3 - (1.50-4.58) mg/L, EC (0-199.7) μS/cm, Hardness (0.00023-0.002) mg/L, PH (6.6-7) mg/L. tstat
Keywords: Crude oil; Contamination; Darbandikhan reservoir; Ifraz River water; Drinking water
Natural resources especially hydrocarbons have become one of the most important resources of energy for mankind. However, the process of extraction of these natural resources is very complicated and most of the time the pollutant’s products that accompany the process of oil exploration play a vital role to declare an inconsistency in the ecosystem [1]. This means an increase in the probability of environmental risk and as a result a widespread of hazardous material in the aquatic environment. An aquatic environment can be considered as one of the environments that are subjected more to the contamination by crude oil. This seems to be a big issue due to the spillage of some crude oil into the water. This spillage is due to the leakage which accompanies the process of oil exploration and transportation [2]. As a result, the aquatic environment becomes contaminated region. This situation is a big threat for the evolution of macrophyte, and for the life support balance of living organisms in that environment. Therefore, with world’s increasing dependency on the production of crude oil products, crude oil water contamination problem becomes the major factor that can alter the natural consistency of the outstanding life source in a particular environment. Therefore, in order to decrease or remedied these effects, oil companies must adopt proper measure that are helpful to minimize the contamination rate to the normal wedge. This paper investigates the effects of crude oil on aquatic environment. Different instrumental techniques have been used in the process of measuring the physiochemical and ionic characteristics of a controlled condition contaminated water samples as a part of solution that helps to achieve chemically balanced aquatic environment.
Samples collection
Three types of samples were collected: crude oil, river water, and drinking water samples from the area under consideration. The crude oil samples were collected from Khurmala oil refinery which is located between Erbil and Kirkuk Province, while the river water samples were collected from three different places within Darbandikhan Reservoir (Figure 1). These places have been clearly identified by the coordinates 35.2009°N and 45.81295°E. Furthermore, about the drinking water samples, theses samples can be collected from any source of pure drinking water. The odour and the color of the samples were examined. Different instrumental procedures were used to analyze different samples.
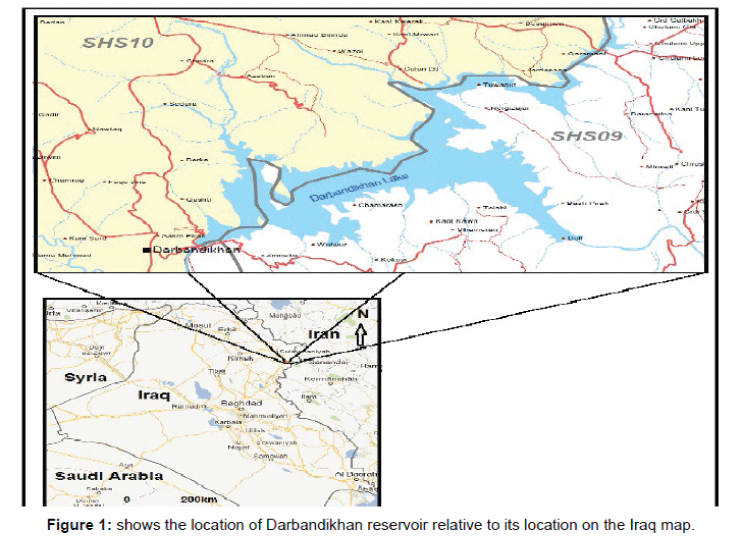
Figure 1: shows the location of Darbandikhan reservoir relative to its location on the Iraq map.
Apparatus and procedure of analysis
Field analysis: For field analysis the odor and the color of the samples were examined. The color of the derived crude oil sample was black, while the sample odor was strong similar to the normal oil odor.
Laboratory analyses: In order to reach the selected target goal, a number of instrumentation measurements were followed.
For the chloride ion concentration, Mohrs titration method was used [3]. Furthermore, for the determination of physiochemical properties of the contaminated water samples 600 modle Plaintest micro was used to determine the PH, TDS, and electric conductivity respectively (600 modle Plaintest micro, UK). While for the total water hardness, EDTA titration method was employed to establish the hardness data of the contaminated samples [4]. In addition, for the determination of the anions concentration Sulphate and Nitrate in the contaminated water samples, UV/Visible Spectrophotometer was employed (modle 6705 UV/Vis Jenway, UK) [5]. While, for the Cations concentration which are (Ca+2, Na+, K+, Pb+2) instrumental techniques were employed to determine the concentrations. These instruments are respectively flame photometer for calcium, Sodium, and Potassium determination (model PFP7 Jenway, UK), and Atomic absorption spectrophotometer for Lead Concentration (model210/211/ Buck Scientific) [6].
Main Results
In Table 1 the recorded values of the common cations in the contaminated river water samples showed a range of (1-4.5) mg/L for Ca+2, (2.-13) mg/L for Na+, (0.47-0.89) mg/L for K+, and (0.434-1.166) mg/L for Pb+2. According to the World Health Organization (WHO) the concentrations were found at the permissible limits except for Pb+2 concentrations whose maximum value was recognized to fall in a range which exceeds the WHO [7] permissible limits.
| No.of sample | Location | Calcium (Ca+2) mg/L | Sodium(Na+) mg/L | Potassium(K+) mg/L | Lead (Pb+2) mg/L | Volume of river water + crude oil mL |
|---|---|---|---|---|---|---|
| 1 | Darbandikhan Reservoir | 1 | 11.9 | 0.47 | 1.165716972 | 99.7+0.3 |
| 2 | Darbandikhn Reservoir | 4.5 | 13.1 | 0.89 | 0.4340246 | 99.98+0.2 |
| 3 | DarbandikhanReservoir | 4.2 | 2 | 0.78 | 0.596626685 | 99.99+ 0.1 |
Table 1: Shows the concentration of common cations in River water samples contaminated with crude oil (Darbandikhan Reservoir) Sulaimaniya.
In Table 2 the recorded values of the common cations in the contaminated drinking water samples showed a range of (4.2-4.5) mg/L for Ca+2, (6.9-7) mg/L for Na+, (0.07-0.15) mg/L for K+, and (1.16-1.24) mg/L for Pb+2. According to the World Health Organization (WHO) standards, the concentrations are at the permissible limits except for Pb+2 concentrations which are recognized to fall in a range which exceed the WHO permissible limits.
| No of sample | Location | Calcium(Ca+2) mg/L | Sodium(Na+) mg/L | Potassium(K+) mg/L | Lead (Pb+2) mg/L | Volume of Drinking water + Crude Oil mL |
|---|---|---|---|---|---|---|
| 1 | Darbandikhan Reservoir | 4.19 | 9.38 | 0.149 | 1.2455 | 99.7+0.3 |
| 2 | Darbandikhan Reservoir | 4.49 | 6.99 | 0.079 | 1.165 | 99.98+0.2 |
| 3 | Darbandikhan Reservoir | 4.195 | 6.89 | 0.069 | 1.245 | 99.99+ 0.1 |
Table 2: Shows the concentration of common cations in Drinking water samples contaminated with crude oil (Darbandikhan Reservoir) Sulaimaniya.
In Table 3 the recorded values of major anions in river water contaminated by crude oil showed a range of (0.001-1.5) mg/l for Cl-, (40.8-87.9) mg/l for SO4-2, and (2.29-4.65) mg/l for NO3-. According to the World Health Organization (WHO) standards, the concentrations are at the permissible limits [7].
| No of Sample | Location | Volume of river water + crude oil (ml) | Chloride (Cl-) mg/L | Sulphate (SO4-2) mg/L | Nitrate (NO-3) mg/L |
|---|---|---|---|---|---|
| 1 | Darbandikhan Reservoir | 99.7+0.3 | 1.5 | 40.80308219 | 2.296256693 |
| 2 | Darbandikhan Reservoir | 99.98+0.2 | 1.35 | 79.15924658 | 4.561059612 |
| 3 | Darbandikhan Reservoir | 99.99+ 0.1 | 0.0009 | 87.92636986 | 3.122841903 |
Table 3: Shows concentration of major anions in river water samples contaminated by crude oil from (Darbandikhan Reservoir) Sulaimaniya.
In Table 4 the recorded values of major anions in drinking water contaminated by crude oil showed a range of, (0.0011-0.125)mg/l for Cl-, (79.15-87.9) mg/l for SO4-2, and (1.50-4.58)mg/l for NO3-. According to the World Health Organization (WHO) standards, the concentrations are at the permissible limits [7].
| No of samples | Volume of river water + crude oil (ml) | Chloride(Cl-) mg/L | Sulphate(SO4-2) mg/L | Nitrate(NO3-) mg/L |
|---|---|---|---|---|
| 1 | 99.7+0.3 | 0.00125 | 87.65239726 | 1.502117175 |
| 2 | 99.98+0.2 | 0.00116 | 79.15924658 | 4.587577726 |
| 3 | 99.99+ 0.1 | 0.00116 | 87.92636986 | 4.511143162 |
Table 4: Shows concentration of major anions in drinking water contaminated samples by crude oil (Darbandikhan Reservoir) Sulaimaniyah.
In Table 5 the recorded values of the physiochemical characteristics of river water samples contaminated with crude oil showed a range of (0-1697) μS/cm for EC, and TDS(0-780.6) mg/L. According to the World Health Organization (WHO) standards, the concentrations are at the permissible limits except the TDS of the sample that was recognized to fall in a range which exceed the WHO permissible limits. The concentration of this sample was prepared by mixing 99.5 ml of river water with 0.5 ml of crude oil.
| No. of samples | Location | Conductivity μS/cm | TDS mg/L | Volume of River water+ Crude oil mg/L |
|---|---|---|---|---|
| 1 | Darbandikhan Reservoir | 0 | 0 | 99.7+3 |
| 2 | Darbandikhan Reservoir | 0 | 0 | 99.98+2 |
| 3 | Darbandikhan Reservoir | 161 | 161 | 99.99+1 |
| 4 | Darbandikhan Reservoir | 1697 | 1697 | 99.95+5 |
| 5 | Darbandikhan Reservoir | 169 | 169 | 99.97+3 |
| 6 | Darbandikhan Reservoir | 170 | 170 | 99.98+2 |
| 7 | Darbandikhan Reservoir | 171 | 171 | 99.9+1 |
Table 5: Shows Physiochemical Characteristics of River water samples contaminated with crude oil (Darbandikhan Reservoir) Sulaimaniya.
In Table 6 the recorded values of the physiochemical characteristics of drinking water samples contaminated with crude oil showed a range of (0-199.7) μS/cm for EC, (0.00023-0.001646) mg/l for Hardness, and (6.6-7) for PH. According to the World Health Organization (WHO) standards, the concentrations were at the permissible limits except the concentration of the first reading of the first and second sample of TDS that was recognized to fall in a range which exceed the WHO permissible limits. The concentration of these samples was prepared by mixing 97 ml of drinking water with 3 ml of crude oil, and 95 ml of drinking water with 5 ml of crude oil.
| No. of samples | Conductivity μS/cm | TDS mg/L | TDS after 24h mg/L | pH | pH after 24h | Volume of Drinkingwater + crude oil (ml) | |
|---|---|---|---|---|---|---|---|
| 1 | Darbandikhan Reservoir | 199.7 | 717.18 | 126.65 | 6.9 | 7.17 | 97+3 |
| 2 | Darbandikhan Reservoir | 19.1 | 725.12 | 12.21 | 7 | 7.36 | 95+5 |
| 3 | Darbandikhan Reservoir | 127 | 516.4 | 81.187 | 6.8 | 6.88 | 90+10 |
| 4 | Darbandikhan Reservoir | 96 | 0 | 61.32 | 6.6 | 6.37 | 80+20 |
| 5 | Darbandikhan Reservoir | 0 | 0 | 0 | 6.7 | 6.87 | 70+30 |
| 6 | Darbandikhan Reservoir | 0 | 0 | 0 | 6.9 | 6.67 | 60+40 |
| 7 | Darbandikhan Reservoir | 0 | 0 | 0 | 6.7 | 6.38 | 50+50 |
| 8 | Darbandikhan Reservoir | 0 | 0 | 0 | 6.6 | 5.75 | 40+60 |
Table 6: Shows Physiochemical Characteristics of Drinking water samples contaminated with crude oil (Darbandikhan Reservoir) Sulaimaniyah.
In Table 7 the recorded values of the total Water hardness of the River water samples contaminated with crude oil showed a range of (0.000096-0.02) mg/L. According to the World Health Organization (WHO) standards, the resulted concentration was under permissible standards of the WHO permissible limits [7].
| No. of samples | Location | Volume of river water + crude oil ml | Total Hardness mg/L |
|---|---|---|---|
| 1 | Darbandikhan Reservoir | 99.7+0.3 | 0.002 |
| 2 | Darbandikhan Reservoir | 99.98+0.2 | 0.002 |
| 3 | Darbandikhan Reservoir | 99.99+0.1 | 0.000096 |
Table 7: Shows the total water hardness of the River water samples contaminated with crude oil (Darbandikhan Reservoir) Sulaimaniyah.
In Table 8 the recorded values of the total water hardness of the Drinking water samples contaminated with crude oil showed a range of (0.00023-0.002) mg/L. According to the World Health Organization (WHO) standards, the resulted concentration was under permissive standards of the WHO permissible limits [7].
| No. of river water sample | Location | Volume of river water + crude oil ml | Total Hardness mg/L |
|---|---|---|---|
| 1 | Darbandikhan Reservoir | 99.7+0.3 | 0.00175 |
| 3 | Darbandikhan Reservoir | 99.98+0.2 | 0.001686 |
| 3 | Darbandikhan Reservoir | 99.99+0.1 | 0.000096 |
Table 8: Shows the total water hardness of the drinking water samples contaminated with crude oil (Darbandikhan Reservoir) Sulaimaniyah.
In Table 9 the tstat
| Chloride(Cl-) mg/L | Sulphate(SO4-2)mg/L | |
|---|---|---|
| Mean | 0.9503 | 69.29623288 |
| Variance | 0.68164527 | 628.1103397 |
| Observations | 3 | 3 |
| Hypothesized Mean Difference | 0 | |
| df | 2 | |
| t Stat | -4.720845685 | |
| P(T<=t) one-tail | 0.021029925 | |
| t Critical one-tail | 2.91998558 | |
| P(T<=t) two-tail | 0.042059851 | |
| t Critical two-tail | 4.30265273 |
Table 9: Shows t-Test: Two-sample assuming unequal variances.
In Table 10 tstat <tcritical, we are 95% confident that there is strong evidence, and therefore we accept the null hypothesis. It means that there is strong relationship between nitrate and chloride ion concentration of the samples.
| Nitrate(NO3-)mg/L | Chloride(Cl-) mg/L | |
|---|---|---|
| Mean | 3.326719403 | 0.9503 |
| Variance | 1.313507592 | 0.68164527 |
| Observations | 3 | 3 |
| Hypothesized Mean Difference | 0 | |
| df | 4 | |
| t Stat | 2.914040808 | |
| P(T<=t) one-tail | 0.021750948 | |
| t Critical one-tail | 2.131846786 | |
| P(T<=t) two-tail | 0.043501896 | |
| t Critical two-tail | 2.776445105 |
Table 10: Shows t-Test: Two-sample assuming unequal variances.
In Table 11 tstat <tcritical, we are 95% confident that there exists strong evidence so we are rejecting the null hypothesis. It means that there is no relationship between sulphate and nitrate ion.
| Sulphate(SO4-2) mg/L | Nitrate(NO3-) mg/L | |
|---|---|---|
| Mean | 84.91267123 | 3.533612688 |
| Variance | 24.84518668 | 3.096691074 |
| Observations | 3 | 3 |
| Hypothesized Mean Difference | 0 | |
| Df | 2 | |
| t Stat | 26.66523986 | |
| P(T<=t) one-tail | 0.00070172 | |
| t Critical one-tail | 2.91998558 | |
| P(T<=t) two-tail | 0.00140344 | |
| t Critical two-tail | 4.30265273 |
Table 11: Shows t-Test: Two-sample assuming unequal variances.
All in all, by checking the concentration of different water samples derived from Darbandikhan reservoir, and crude oil samples derived from Khurmala oil field, it is concluded that all the resulted data excepting Pb+2 and TDS are at the permissible limits. The record of ranges of these data for both river and drinking water are respectively Ca+2 (1-4.5) mg/L, Na+ (2.-13) mg/L , K+(0.47-0.89) mg/L, Pb+2 (0.434-1.166) mg/L, Cl- (0.0009-1.5) mg/L, SO4-2 (40.8-87.9) mg/L, NO3- (2.29-4.65) mg/L, EC(0-1697) μS/cm, Hardness (0.000096-0.02) mg/L, TDS(0-780.6) mg/L. Ca+2 (4.2-4.5) mg/L, Na+(6.9-7) mg/L, K+(0.07-0.15) mg/L, Pb+2 (1.16-1.24) mg/L, Cl- (0.0011-0.125) mg/L, SO4-2 (79.15-87.9) mg/L, NO3- (1.50-4.58) mg/L, EC (0-199.7) μS/cm, Hardness (0.00023-0.002) mg/L, PH (6.6-7). We are 95% confident and we rejected the null hypothesis, for chloride and sulphate ions , sulphate and nitrate ions. We are 95% confident that we accept the null hypothesis for nitrate and chloride ions. Furthermore, according to the standard permissible limits of irrigation water system, it was concluded that all the investigated water parameters are at the standard normal range of the irrigation permissible limits.
From the above statement and by referring to the concluded results, the data showed that the concentrations of both Pb+2 and TDS were higher than the normal permissible values of WHO standard organization. For that reason, a number of remediation procedures needs to be conducted. These procedures are demonstrated as:
Pb+2
To remediate the excessive amount of Pb+2 in water different procedures can be used such as using reverse osmosis method, using phosphate dosing, aware the residential areas of the major steps of how to identify lead in water contamination, and identify lead contamination source [8,9].
TDS
The concentration of TDS in water has a direct relationship with the percentage of different chemical constituent such as Mg, Ca, and other compounds. To remediate the higher concentration of TDS a number of remediation methods can be adopted such as salt based softeners, reverse osmosis, and ion exchange [10,11].
Authors would like to thank referees for their valuable comments and suggestions to improve the quality of this research paper. Authors are also thankful to Mr. Sathyendar Sreepada for his assistance in applying statistical tests on data obtained through experimental work.