Advanced Techniques in Biology & Medicine
Open Access
ISSN: 2379-1764
ISSN: 2379-1764
Research Article - (2015) Volume 3, Issue 3
This study was undertaken to determine the effects of two appropriate household cooking methods, steam and microwave-cooking, on proximate chemical composition, energetic values, fatty acids profiles, texture profile analysis and bacteriological characteristics of zebra blenny (Salaria basilisca) fillets from Tunisian coasts. The nutritional values of the fish fillets were improved after the two cooking methods. Fatty acid profiles of zebra blenny fillets showed that Polyunsaturated Fatty Acids (PUFA) contents are higher than those of Saturated Fatty Acids (SFA). They showed also differences between cooking methods. All textural attributes of zebra blenny fillets were influenced by cooking process. Microbiological changes [Total viable counts (TVC), Lactic Acid Bacteria (LAB), Enterobacteriaceae, Listeria monocytogenes as well as fungi] were monitored as a function of treatment and storage time. On day 5 of storage under refrigeration the number of micro-organisms is always minimal for samples heat treated comparing with those raw.
Keywords: Zebra blenny (Salaria basilisca), Cooking methods, Proximate composition, Nutritional values, Fatty acids, Textural attributes, Microbiological changes
Teleost Blenniidae is a diverse family of primarily marine benthic fishes which includes about 387 species that typically inhabit hard inshore substrata of tropical and temperate waters, with three to four species occurring in freshwater habitats [1]. Among the species within the Teleost Blenniidae family, Zebra blenny (Salaria basilisca) is a very common benthic fish in the Mediterranean region (endemic species). It is brownish-green fish widely abundant in Tunisia, including the Gulf of Gabes, and is known to reach a maximum length of 18 cm. This species was previously described as living on sea grass beds, also within the Mediterranean, where spawning occurs in water temperatures between 18ºC and 22ºC [2]. Salaria basilisca is relatively important in the fish catches of Tunisia, and is used for human consumption.
Fish is known for its high nutritional value. The significance of sea foods has gained increasing attention worldwide particularly due to their high contents of n-3 polyunsaturated fatty acids, such as eicosapentaenoic acid (EPA; C20:5 (n-3)) and docosahexaenoic acid (DHA; C22:6 (n-3)) [3]. In fact, fatty acids have a particular importance in fish since their consumption has often been reported to induce several beneficial effects, including the reduction of cardiovascular diseases and improvement of learning abilities [4,5].
Fish muscles are cooked in different ways to improve its hygienic quality, by the inactivation of pathogenic microorganisms, and enhance its taste and flavor [6]. The reactions involved are often related, depending on time and temperature treatment. Microwave ovens change regular electricity into high-frequency microwaves that water, fat and sugar can absorb, causing food particle vibration and, hence, the heating of food [7]. During cooking, chemical and physical reactions occur, which are often associated with an increase in digestibility, due to protein denaturation, and a decrease in the content of thermolabile compounds and polyunsaturated fatty acids [8].
The knowledge of the chemical characteristics of fresh fish species and the effects of different cooking methods on their chemical compositions is essential to enhance the good food behavior of consumers. Experimental data on fresh and processed fish are also useful to establish a database for consumers, nutritionists, and professionals in the fish industry and to develop principled grounds for the recommendation of appropriate cooking methods that preserve the nutritional and healthy attributes of fish muscles.
Although several studies have been performed to investigate the effects of cooking methods on the nutritive values of various marine species, including golden grey mullet (Liza aurata), African catfish, silver carp (Hypophthalmichthys molitrix), silver catfish (Rhamdia quelen), and red mullet (Mullus barbatus), little data is currently available on the effects of such cooking methods on zebra blenny fillets [9-13]. Accordingly, the present study was undertaken to determine the effects of two cooking methods (steam and microwave-cooking) on the physicochemical properties, energetic value, fatty acid profile, color, textural profile, and microbiological characteristics of zebra blenny fillets.
Raw material and processing
Zebra blenny (S. basilisca) fish samples were freshly purchased from the local fish market of Sfax, Tunisia. They were packed in polyethylene bags, placed in ice with a sample/ice ratio of approximately 1:3 (w/w), and transported to the research laboratory within 20 min. Upon arrival, the fish samples were washed, eviscerated, and filleted. They were prepared and cooked by steam and microwave cooking according to common household methods. The microwave-cooking process was carried out with a domestic microwave grill oven (WD 800L-K2; Kombi-Mirkowelle, Zurich, Germany). The experiments were performed at 1000 W for 10 min wherein the samples were uniformly placed, forming a thin layer, on the plate of the microwave. The steam cooking process, on the other hand, involved fillets that were uniformly placed, forming a thin layer, on a stainless steel steamer above a stainless steel pot of boiling water and cooked with the lid on for 10 min.
Proximate composition analysis
Cooked and uncooked zebra blenny fillets were submitted to proximate composition analyses of protein, moisture, fat, ash, and carbohydrate contents, which were performed in triplicates. The moisture and ash content were determined according to the standard methods 930.15 and 942.05, respectively [14]. The total nitrogen contents in the zebra blenny fillets were determined using the Kjeldahl method in accordance with the AOAC method number 984.13 [14]. Crude protein was estimated by multiplying the total nitrogen content by the factor of 6.25. Crude fat was determined gravimetrically after Soxhlet extraction with hexane. Carbohydrate content was calculated by the difference between 100 and the sum of the crude protein, crude fat, moisture, and ash [15]. The energetic value was determined indirectly using Rubner’s coefficients for aquatic organisms: 9.5 kcal g-1 for lipids, 5.65 kcal g-1 for proteins, and expressed in kJ g-1 wet mass as described by Eder and Lewis [16,17]. All measurements were performed in triplicate.
Cooking loss measurement
Cooking loss was measured according to the method of Niamnuy et al. and calculated from the differences in the mass of zebra blenny fillets before and after each cooking methods (steam and microwavecooking) [18]. Cooking loss was calculated using the following formula:

Determination of color
Sample color was evaluated using a Color Flex spectrocolorimeter (Hunter Associates Laboratory Inc., Reston, VA, USA) and reported as L*, a* and b* values, where L* refers to the measure of lightness, a* to the chromatic scale from green to red, and b* to the chromatic scale from blue to yellow. The sample was filled in a 64 mm glass sample cup with three readings in the same place, and triplicate determinations were taken per sample. The white tile and black glass were used to standardize the equipment.
Fatty acids analysis
Upon lipid extraction, the Fatty Acids Methyl Esters (FAME) was prepared according to the method of Metcalfe et al. [19]. FAME were analyzed by gas chromatography using a Shimadzu gas apparatus (GC-17A; Shimadzu Corporation, Kyoto, Japan) equipped with polar capillary column (DB-WAX, 3.0 m length, 0.25 mm I.D., 0.25 μm film thickness; Supelco, Bellefonte, PA, USA). The oven temperature, initially set at 150ºC (0.5 min hold), was increased to 200ºC at 6ºC min−1, then to 230ºC at 4ºC min−1, and finally held constant at 250ºC for 15 min. Nitrogen was used as a carrier gas at a flow rate of 1 ml min−1. The injection port and flame ionisation detector were maintained at 250ºC. Fatty acids were identified by comparing the retention times with those of authentic standards.
Mineral composition
Magnesium (Mg), sodium (Na), potassium (K), phosphor (P), copper (Cu), iron (Fe), manganese (Mn), zinc (Zn), and calcium (Ca) contents were analyzed using an inductively coupled plasma optical emission spectrophotometer (ICP-OES) (Model 4300 DV, Perkin Elmer, Shelton, CT, USA) according to the method of AOAC [20]. A sample (1 g) was mixed well with 1 ml of 70% nitric acid. The mixture was heated on the hot plate until complete digestion. The digested sample was transferred to a volumetric flask, and the volume was made up to 10 ml with deionized water. The solution was then submitted to analysis. The mineral concentrations were calculated and expressed as mg kg-1 or mg 100 g-1 sample.
Texture profile analysis (TPA)
Texture profile analysis (TPA) was performed at room temperature using a texture analyzer (TA-XT2i, Stable Micro Systems Ltd., Surrey England). Samples were taken from the central portion of each fish fillet. Texture analyses were performed under the following conditions: pre-test speed 2.0 mm/s, post-test speed 5.0 mm/s, maximum load 2 kg, head speed 2.0 mm/s, distance 8.0 mm, and force 5 g. Values of hardness, springiness, elasticity index, adhesiveness, chewiness, rigidity and cohesiveness were determined as described by Bourne [21].
Polyacrylamide gel electrophoresis
Sodium dodecyl sulphate-polyacrylamide gel electrophoresis (SDS-PAGE) was carried out as described by Laemmli, using 5% (w/v) stacking and 15% (w/v) separating gels. Samples were prepared by mixing the crude enzyme extract at 1:5 (v/v) ratio with the SDS-PAGE sample buffer (10 mM Tris-HCl (pH 8.0), 2.5% SDS, 10% glycerol, 5% β-mercaptoethanol and 0.002% bromophenol blue) [22]. The samples (25 μg proteins) were heated at 100ºC for 5 min before loading in the gel. After electrophoresis, the gel was stained with 0.25% Coomassie Brilliant Blue R-250 in 45% ethanol-10% acetic acid and destained with 5% ethanol-7.5% acetic acid.
Microbiological analysis
The growth of various microflora were monitored by determining Total Viable Counts (TVC), Lactic Acid Bacteria (LAB), Enterobacteriaceae, Listeria monocytogenes and fungi. Portions of 0.5 g of zebra blenny fillets were removed aseptically using a spoon, transferred to a stomacher bag (Seward Medical, Worthing, West Sussex, UK), containing 4.5 ml of sterile NaCl solution (0.9%), and homogenized using a stomacher (Lab Blender 400, Seward Medical) for 60 s at room temperature. For microbial enumeration, 0.1 ml samples of serial dilutions (1:10, NaCl 0.9%) were spread on the surface of agar plates. TVC were determined using Plate Count Agar (PCA; Merck, Darmstadt, Germany) after incubation for 3 days at 30ºC. LAB were determined on a de Man Rogosa and Sharpe medium (MRS) (Difco, Detroit, MI, USA) after incubation for 48 h at 30ºC. Anaerobic conditions were ensured by the use of Anaeropack GENbox Jars combined with Pack-Anaero oxygen absorbers (Mitsubishi Gas Chemical Company, Tokyo, Japan). For members of the Enterobacteriaceae family, a 1.0 ml sample was inoculated into 10 ml of molten violet red bile glucose agar (Oxoid code CM1082, Basingstoke, UK). A 10 ml overlay of molten medium was then added and incubated at 30ºC for 24 h. The large colonies with purple haloes were counted [23]. To enumerate Listeria in fish samples, 0.1 ml samples of serial dilutions were spread on the surface of PALCAM agar plates and incubated at 35ºC for 48 h. Presumptive colonies were counted and were considered as L. monocytogenes [24]. For the enumeration of fungi in zebra blenny fillets, 0.1 ml of each serial dilution was spread on the surface of Potato Dextrose Agar (PDA; Merck, Darmstadt, Germany) plates. The plates containing 25-250 colonies were selected and counted, and the average number of CFU ml-1 was calculated. All plates were examined visually for typical colony types and morphological characteristics associated with each growth medium. Furthermore, the selectivity of each medium was routinely checked by Gram staining and microscopic examination of smears prepared from colonies randomly selected from the media.
Statistical analysis
Statistical analyses were performed using the STATGRAPHICS centurion Pro. 16.0 statistical software packages. The data were examined analysis of variance ANOVA, and differences were considered significant at p<0.05. All tests were carried out in triplicate.
Proximate composition of zebra blenny fillets
The values of the proximate chemical composition of raw zebra blenny fillets and those cooked by the two cooking methods are shown in Table 1. The proximate composition of raw zebra blenny fillets was determined as 78.33% moisture, 2.24% fat, 13.62% protein, 5.1% ash, and 0.72% carbohydrate. The proximate composition of cooked zebra blenny fillets was, on the other hand, noted vary according to the cooking method used. In fact, the protein content recorded for the microwave-cooked fillets was significantly (P<0.05) higher (24.00%) than that of the steam cooked ones (19.66%). Significant (P<0.05) changes were also observed in fat content after steam cooking. No significant (P>0.05) differences, were, however, observed between the fat contents of the raw and microwave-cooked fish fillets.
| Proximate composition (g/100 g wet weight) |
Raw | Steam-cooked | Microwave-cooked |
|---|---|---|---|
| Moisture | 78.33±0.13a | 74.64±0.37b | 69.10 ± 0.34c |
| dry matter | 21.67±0.13a | 25.37±0.37b | 30.94±0.34c |
| Protein | 13.62±0.08a | 19.66 ± 0.46b | 24.00 ± 0.31c |
| Fat | 2.24 ± 0.16a | 2.06 ± 0.11b | 2.37±0.04a |
| Ash | 5.1±0.10a | 4.11±0.06b | 4.38 ± 0.23c |
| Carbohydrate | 0.72 ± 0.26a | 0.2 ± 0.08b | 0.2±0.25b |
| Energetic value (kJ g-1) | 4.08 ± 0.08a | 5.28±0.06b | 6.58±0.09c |
Values are given as mean ± SD from triplicate determinations (n=3)
Different letters in the same line means significant differences (P<0.05)
Table 1: Proximate composition of uncooked and cooked zebra blenny fillets.
The ash contents of all the cooked samples were noted to undergo a significant (p<0.05) decrease owing to water loss. After steam cooking, 19.42% of ash content was released by the loss of water. A decrease of about 14.12% was, however, observed for the ash content of the microwave-cooked samples. These changes were similar to those found by Koubaa et al. who reported on a decrease of 27.63% of ash content in steam treated red mullet (Mullus barbatus) fillets [13].
Furthermore, the two cooking methods were noted to yield into significantly different (p<0.05) changes in the moisture content of the cooked fillets. The moisture content of the steam and microwave cooked fillets decreased by about 4.7% and 11.79%, respectively. Similar results were previously reported by Koubaa et al. for red mullet (Mullus barbatus) fillets where microwave-cooking were noted to induce a high level of dehydration than steam cooking [13].
The nutritional value of zebra blenny fillets was, on the other hand, observed to increase with the two cooking methods under investigation. In fact, the energy values of raw, steam-cooked and microwave-cooked fillets were 4.08 kJ g-1, 5.28 kJ g-1, and 6.58 kJ g-1, respectively.
Cooking loss
The cooking loss in zebra blenny fillets was measured after each cooking treatment. The cooking loss was different depending on the cooking process. After steam and microwave cooking, the zebra blenny muscles underwent a loss in their initial weights corresponding to 17.3% and 55.12%, respectively. Heating was noted to induce the aggregation and denaturation of protein in the zebra blenny muscles, thus leading to a decrease in the water holding capacity of proteins. A drastic cooking loss was, therefore, observed.
Effect of cooking methods on fillets color
Fish are exposed to different conditions during cooking process which may, in turn, result in changes in their carotenoid content and may lead to color modifications [25]. The color values determined for the steam and microwave-cooked zebra blenny fillets were expressed as L*, a* and b*. As illustrated in Table 2, while the b* values increased significantly in the two cooked samples (p<0.05) as compared to those of raw fillets, the L* values underwent a decrease (p<0.05). These results are in agreement with the findings reported by Hakimeh et al. who observed that while the b* values increased in all cooked samples (grilling, frying and steaming), the L* values showed a decrease [11]. The microwave-cooking method displayed significantly higher L* and lower a* values, but insignificantly different b* values, as compared to the steam cooking method.
| Samples | L* | a* | b* | |
|---|---|---|---|---|
| Raw | 80.64± 0.01a | -0.68±0.03a | 11.06 ± 0.11a | |
| Steam cooked | 78.93±0.02b | -2.85 ± 0.00b | 12.10 ± 0.01b | |
| Microwave-cooked | 79.37±0.11c | -3.14 ± 0.01c | 12.03 ± 0.02b | |
Values are given as mean ± SD from triplicate determinations (n=3)
Different letters in the same column indicate significant differences (p<0.05)
Table 2: Effects of different cooking methods on the color of zebra blenny fillets.
Sikorski et al. reported that the denaturation, protein oxidation, and colored compound formations with the involvement of H2S released from amino acids in Maillard reactions could be the reasons of color changes in cooked samples. Chaijan et al. have also reported that aldehydes or carbonyl compounds produced from lipid oxidation can interact with protein amino groups via Maillard reactions [26,27].
Mineral contents
The mineral contents of raw and cooked zebra blenny fillets are presented in Table 3. The Mg, Na, K, P, Ca, Cu, Fe, Mn, and Zn levels of raw fish were found to be 850.50 mg 100 g-1, 189.13 mg 100 g-1, 252.61 mg 100 g-1, 130.20 mg 100 g-1, 39.12 mg 100 g-1, 3.99 mg kg-1, 12.83 mg kg-1, 4.95 mg kg-1, and 7.35 mg kg-1, respectively.
| Element | Raw | Steam cooked | Microwave-cooked |
|---|---|---|---|
| Mg (mg 100 g-1) | 850.50±14.91a | 817.85±21.14a | 733.49±32.19b |
| Na (mg 100 g-1) | 189.13±5.61a | 171.43±1.99b | 156.27±4.05c |
| K (mg 100 g-1) | 252.61± 19.33a | 162.08±6.47b | 144.44±7.94b |
| P (mg 100 g-1) | 130.20±3.95a | 125.40± 9.03a | 71.42 ± 4.83b |
| Ca (mg 100 g-1) | 39.12±0.5a | 37.37±1.63a | 10.99±1.61b |
| Cu (mg kg-1) | 3.99±1.62a | 3.66±0.65a | 3.19±0.24a |
| Fe (mg kg-1) | 12.84 ±0.22a | 12.52±0.38a | 12.44±0.49a |
| Mn (mg kg-1) | 4.95 ±1.7a | 4.19±1.82a | 3.58±0.76a |
| Zn (mg kg-1) | 7.35±0.98a | 5.32± 1.1b | 1.43±0.26c |
Values are given as mean ± SD from triplicate determinations (n=3)
Different letters in the same line means significant differences (P<0.05)
Table 3: Mineral contents (wet basis) of raw and cooked zebra blenny fillets.
The cooked and uncooked zebra blenny fillets were noted to show higher concentrations of Mg, Na K, and P, but lower levels of Cu, Fe, Mn, and Zn. All mineral contents of zebra blenny fillets decreased after the steam and microwave-cooking method. This result is in accordance with the report of Koubaa et al. for all mineral contents except for the Fe content [13]. In fact, the authors reported that the Fe content of red mullet fillets increased significantly after all cooking methods except for frying. The comparison of the results obtained by the two cooking methods revealed that the mineral level was highest in the steam treated zebra blenny fillets.
Fatty acids composition
The fatty acid composition of zebra blenny (S. basilisca) lipids was determined. As illustrated in Table 4, six fatty acids were highly represented in the lipidic composition of zebra blenny fillets: palmitic (C16:0), oleic (C18:1 (n-9)), linoleic (C18:2 (n-6)), Eicospentenoic (C20:5 (n-3)) (EPA), Docosahexaenoic (C22:6 (n-3)) (DHA), and lignoceric (C24:0) acids. Those fatty acids accounted for 70% to 80% of the total fatty acids of the uncooked and cooked zebra blenny fillet lipids.
| Fattyacid (%) | Raw | Steamcooked | Microwave-cooked |
|---|---|---|---|
| C8:0 | 0.21±0.02 | 0.68±0.06 | 0.17± 0.01 |
| C12:0 | 0.43±0.08 | 1.41±0.08 | 0.40±0.02 |
| C14:0 | 0.77±0.09 | 1.00±0.11 | 1.30±0.15 |
| C14:1 | 0.04±0.01 | 0.05±0.02 | 0.06±0.03 |
| C15:0 | 0.39±0.07 | 0.36±0.07 | 0.60±0.13 |
| C16:1 | 1.23±0.10 | 1.57±0.07 | 3.00±0.19 |
| C16:0 | 14.97±0.40 | 17.92±0.12 | 22.61±0.88 |
| C17:0 | 0.39±0.02 | 0.49±0.03 | 0.60 ± 0.06 |
| C17:1 | 1.11±0.07 | 1.31± 0.02 | 1.40±0.09 |
| C18:0 | 1.23±0.18 | 1.61±0.11 | 2.00±0.06 |
| C18:1 (n-9) | 9.88±0.40 | 10.73±0.85 | 11.75± 0.54 |
| C18:2 (n-6) | 7.50 ± 0.54 | 9.20± 0.09 | 10.85±0.54 |
| C18:3 (n-3) | 0.72±0.04 | 1.07±0.07 | 0.27±0.03 |
| C20:0 | 2.20±0.15 | 1.31±0.07 | 2.11 ± 0.16 |
| C20:1 (n-9) | 0.93±0.10 | 1.19±0.1 | 3.40±0.26 |
| C20:2 (n-6) | 0.72±0.06 | 1.08±0.06 | 5.30±0.38 |
| C20:3 (n-6) | 1.10± 0.07 | 1.86± 0.14 | 0.86±0.15 |
| C20:3 (n-3) | 0.52± 0.07 | 1.08±0.07 | 0.37±0.07 |
| C20:5 (n-3) | 11.43± 0.79 | 4.91±0.15 | 7.92±0.86 |
| C20:4 (n-6) | 0.74±0.12 | 1.39±0.09 | 0.57±0.05 |
| C20:4 (n-3) | 1.32±0.07 | 2.12±0.05 | 1.06±0.08 |
| C22:0 | 1.10±0.20 | 1.65±0.13 | 0.59±0.07 |
| C22:1 | 0.86±0.11 | 2.69±0.09 | 0.55±0.05 |
| C22:2 | 0.55±0.17 | 0.88±0.13 | 0.39±0.05 |
| C23:0 | 0.39± 0.10 | 1.00±0.06 | 0.37±0.09 |
| C22:6 (n-3) | 26.22 ± 0.05 | 17.77±0.91 | 12.91±0.13 |
| C24:0 | 10.25±0.12 | 10.09± 0.74 | 7.07±0.83 |
| C24:1 | 2.87±0.36 | 3.68±0.80 | 1.75± 0.61 |
| SFA | 32.31± 0.35 | 37.42±0.29 | 37.71± 0.04 |
| MUFA | 16.91±0.24 | 21.22±0.35 | 21.82±0.60 |
| PUFA | 50.78±0.11 | 41.36±0.05 | 40.47±0.56 |
| UFA | 67.70±0.35 | 62.58±0.29 | 62.29±0.03 |
| UFA/SFA | 2.10±0.03 | 1.68±0.02 | 1.65±0.00 |
| PUFA/MUFA | 3.00± 0.04 | 1.95±0.03 | 1.86± 0.08 |
| ∑n-3 | 40.20±0.81 | 26.95±0.57 | 22.53± 0.77 |
| ∑n-6 | 10.03± 0.53 | 13.53±0.39 | 17.55±0.25 |
| n-3/n-6 | 4.02±0.29 | 1.99± 0.10 | 1.28±0.06 |
| ∑n-9 | 10.80±0.50 | 11.92±0.95 | 15.11±0.28 |
SFA: C8 : 0 + C12 : 0 + C14 : 0 + C15 : 0 + C16 : 0 + C17 : 0 + C18 : 0 + C20 : 0 + C22 : 0 + C23 : 0 + C24 : 0
MUFA: C14:1 + C16:1 + C17:1 + C18:1 (n-9) + C20:1 (n-9) + C22:1 + C24:1
PUFA: C18:2 (n-6) + C18:3 (n-3) + C20:2 (n-6) + C20:3 (n-6) + C20:3 (n-3) + C20:4
(n-6) + C20:4 (n-3) + C20:5 (n-3) + C22:2 + C22:6 (n-3)
Table 4: Fatty acid composition of raw and cooked zebra blenny fillets.
In the raw zebra blenny fillets, C16:0 was the most abundant SFA. It represented 14.97% of the total Fatty Acids (FA). This value was lower than those reported for silver catfish (24.6%), red mullet (35.6%), gold band goatfish (26.61%), striped red mullet (25.21%), annular sea bream (28.79%), and salmon fillets (16.76%) [12,13,28,29]. The relative content of C16:0 was higher in the cooked than in the raw zebra blenny fillets. The contents of palmitic acid were 17.92 and 22.61% of the total fatty acids in the steam and microwave-cooked fillets, respectively.
C18:1 was the major fatty acid in the raw zebra blenny fillets, within the class of Monounsaturated Fatty Acids (MUFA), with 9.59% content of the total raw fillet FA. The oleic acid content was comparable to those of marine snail (H. trunculus) (7.56%) and (M. galloprovincialis) (8.90%) and lower than those of gold band goatfish (18.35%), striped red mullet (25.68%), and red mullet (31.86%) [13,28,30]. The total content of MUFA increased after cooking from 16.71% of total FA in raw fish fillets to 21.22% and 21.82% of total FA in the steam and microwave cooking samples, respectively.
PUFA were the predominant fatty acids, representing 50.78% of the total FA in the raw fillets. The proportions of n-3 and n-6 PUFA in the total FA were 40.20% and 10.03%, respectively. Those values were in line with the results reported for several fish species. Bayir et al. have, for instance, reported on two-banded bream contents of n-3 and n-6 PUFA in the total FA, which were 42.45% and 9.63%, respectively [29].
DHA (C22:6 (n-3)), EPA (C20:5 (n-3)), and linoleic acid (C18:2 (n- 6)) were the most abundant n-3 and n-6 PUFA, representing 26.22%, 11.43% and 7.5% of the total FA, respectively. Nevertheless, linolenic acid (C18:3 (n-3)) represented only 0.72% of the total FA. In general, lipids in marine fish species are characterised by low levels of linoleic acid (18:2 (n-6)) and linolenic acid (18:3 (n-3)) as well as high levels of long-chain n-3 PUFA [31]. Marine fish staple diets comprise mainly zooplankton rich in PUFA [32]. Therefore, EPA and DHA are the predominant n-3 FA [33]. The proportion of PUFA in the zebra blenny fillets showed a significant reduction during steam treatment (41.36%) and microwave-cooking (40.47%). This decrease of PUFA content during heat treatment could presumably be attributed to the high level of natural antioxidants present in zebra blenny fillets. The antioxidants were generally formed in the course of evolution as adaptation of their ecological niche.
Textural properties of zebra blenny fillets
TPA is one of the methods that simulate the conditions to which the food is exposed in the mouth [34]. The textural property changes, including those pertaining to the hardness, adhesiveness, chewiness, rigidity, cohesiveness, springiness, and elasticity of the cooked and uncooked zebra blenny fillets are shown in Table 5. The textural attributes investigated were generally noted to be highly influenced by the cooking process, except for the elasticity attribute where no statistically significant difference was observed at p<0.05. The steam and microwave-cooked zebra blenny fillets showed hardness values of 10.41 and 25.2 g, respectively, and were significantly higher (P<0.05) than those recorded for the raw fillets which reached 2.38 g. The increase in the hardness attribute could be ascribed to lipid oxidation. In fact, lipid oxidation yielded into a variety of products, with aldehyde being a major product. The formation of aldehyde might induce myofibrillar protein cross-linking, resulting in structural and functional changes in those proteins [35-37]. A similar trend was also recorded for the adhesiveness, chewiness, rigidity, and cohesiveness attributes. The results revealed that the cooking methods did not affect the cohesiveness of cooked zebra blenny fillets, which was 0.42 g for the steam and microwave-cooked fillets. Nonetheless, the springiness and elasticity indices of zebra blenny fillets slightly decreased after cooking. The steam cooked fillets were more elastic at 8.23 mm compared to the microwave-cooked ones (7.33 mm). This may be due to the denaturation of proteins induced by cooking as well as to the uncoiling of polypeptide chains [38].
| Physicalproperties | Raw | Steamcooked | Microwave-cooked |
|---|---|---|---|
| Hardness(g) | 2.38± 0.28c | 10.41± 1.44b | 25.20±1.57a |
| Adhesiveness (N) | 0.87±0.11c | 4.44±1.24b | 10.67±1.41a |
| Chewiness (g) | 7.34±0.32c | 46.17±0b | 83.17± 0.70a |
| Rigidity (N/mm) | 0.33±0.07c | 1.42±0.13b | 4.86±0.03a |
| Cohesiveness (g) | 0.36±0.00a | 0.42±0.06a | 0.42±0.02a |
| Springiness (mm) | 8.45±1.50a | 8.23±0.62a | 7.33±0.24a |
| Elasticity Index | 0.83±0.14a | 0.81±0.05a | 0.72±0.02a |
Values are given as mean ± SD from triplicate determinations (n = 3)
Different letters in the same line means significant differences (P < 0.05)
Table 5: Textural properties of raw and cooked zebra blenny fillets.
Electrophoresis pattern
The SDS-PAGE profiles of raw and cooked zebra blenny fillet proteins are shown in Figure 1. The results indicated that the raw zebra blenny fillet proteins (lane 1) exhibited more intense protein bands, in the range of 14.4-97.0 kDa, than the steam and microwave-cooked zebra blenny fillet proteins (lanes 2 and 3, respectively). Marcone et al reported that bands within the ranges of 20-27 and 30-39 kDa are considered as basic and acidic-type subunits, respectively [39]. This, therefore, reflected that the zebra blenny proteins were rich in both types of sub-units. Below 14.4 kDa, the cooked zebra blenny fillet proteins showed more intense protein bands. This result indicated that the two cooking methods induced changes in the structure and composition of zebra blenny proteins, which could presumably be due to the denaturation of proteins. Kaddouri et al. have, for instance, reported that the microwave treatment of whole milk caused denaturation and significant decreases in whey protein concentrations as compared to fresh whey samples [40]. This decrease could be explained by the loss of whey protein solubility. As illustrated by lanes 2 and 3 (steam and microwave-cooked zebra blenny fillet proteins, respectively), the microwave-cooking method had a practically more pronounced effect on the protein banding pattern.
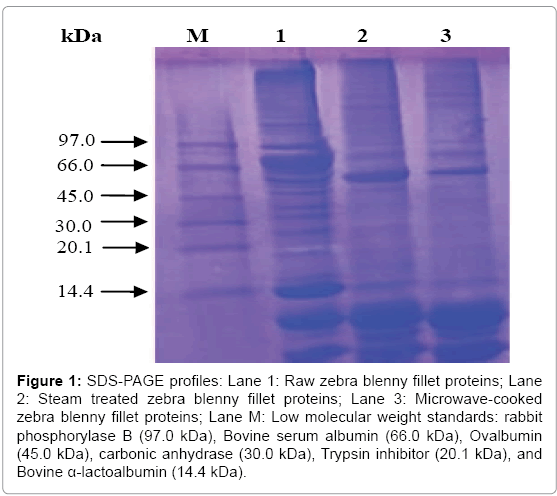
Figure 1: SDS-PAGE profiles: Lane 1: Raw zebra blenny fillet proteins; Lane 2: Steam treated zebra blenny fillet proteins; Lane 3: Microwave-cooked zebra blenny fillet proteins; Lane M: Low molecular weight standards: rabbit phosphorylase B (97.0 kDa), Bovine serum albumin (66.0 kDa), Ovalbumin (45.0 kDa), carbonic anhydrase (30.0 kDa), Trypsin inhibitor (20.1 kDa), and Bovine α-lactoalbumin (14.4 kDa).
Microbiological evaluation
The TVC, LAB, Enterobacteriaceae, Listeria monocytogenes, and fungi counts recorded for the raw, steam, and microwave-cooked (S. basilisca) fillets as a function of storage time under refrigeration (4ºC) are shown in Figure 2a-2e, respectively. The results presented in Figure 2a show that the values recorded for the mesophilic flora were lower in the heat-treated samples than the control raw fish samples. At day 1, the means of mesophilic counts in the raw, steam and microwave cooked fish were 26.6 log10 CFU ml-1, 25.79 log10 CFU ml-1, and 26 log10 CFU ml-1, respectively. After five days of storage, the total mesophilic flora counts in the raw fish samples reached a log10 of 31.83 CFU ml-1. The mesophilic bacteria counts recorded after five days of storage for the microwave-cooked and steam treated zebra blenny samples reached a log of 31.12 and 31.37 CFU ml-1 respectively.
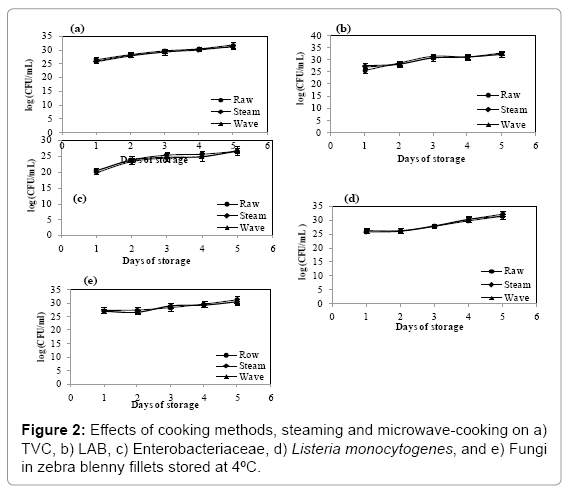
Figure 2: Effects of cooking methods, steaming and microwave-cooking on a) TVC, b) LAB, c) Enterobacteriaceae, d) Listeria monocytogenes, and e) Fungi in zebra blenny fillets stored at 4ºC.
As shown in Figure 2b, on the first day of storage, the number of LAB in the raw, steam and microwave cooked fish were 25.57 log10 CFU ml-1, 27.52 log10 CFU ml-1, and 27.18 log10 CFU ml-1, respectively. On day 5 of storage, however, the number of LAB in the raw fish reached a log10 of 32.76 CFU ml-1 and 32.34 CFU ml-1 and 32.43 CFU ml-1 in the steam and microwave cooked fish, respectively. Signs of deterioration were also noted to appear as a foul odor especially in the case of raw fish.
The data illustrated in Figure 2c show that the initial Enterobacteriaceae count in the raw samples was about 20.57 log10 CFU ml-1. The number of Enterobacteriaceae was noted to increase during the storage period but remained relatively fewer for the microwave cooked samples and especially for the steam cooked ones.
The results from the Listeria detection test illustrated in Figure 2d show that the number of Listeria bacteria in the raw samples increased during the 5 days of storage, being in the order of 26.2 log10 CFU ml-1, 26.2 log10 CFU ml-1, 27.81 log10 CFU ml-1, 30.29 log10 CFU ml-1, and 32.23 log10 CFU ml-1. The values recorded for the number of such bacteria were lower for the heat treated (steam and microwave cooked) samples.
The results presented in Figure 2d show that while the initial number of fungi in the raw zebra blenny fillets was in the order of 27.4 log10 CFU ml-1, it represented 27.18 log10 CFU ml-1 and 27.05 log10 CFU ml-1 for the steam and microwave-cooked fillets, respectively. This number was noted to undergo a daily increase, reaching of 31.45 log10 CFU ml-1 after 5 days of storage for the raw fish, a significantly high value when compared to the one recorded for the heat treated fillets.
Overall, the results showed that the number of micro-organisms was always minimal for the heat treated fish samples (microwave and steam) as compared to those recorded for the raw ones.
In this study, the proximate composition, fatty acids composition, mineral contents, textural parameters, electrophoresis profile, and bacteriological characteristics of fresh and cooked (steamed and microwave-cooked) zebra blenny fillets were determined. The results revealed statistically significant (p<0.05) differences in the changes of the proximate composition of fresh and cooked zebra blenny fillets. The fish fillets were also noted to contain high proportions of unsaturated than saturated fatty acids. Overall, the cooking methods had important effects on the textural properties of zebra blenny fillets and inhibited the growth of microbial flora kept under refrigeration storage.
This work was funded by the Ministry of Higher Education and Scientific Research, Tunisia. The authors would like to express their sincere gratitude to Mr. Anouar Smaoui from the English language unit at the Faculty of Science of Sfax, Tunisia for his constructive proofreading and language polishing services.