Journal of Osteoporosis and Physical Activity
Open Access
ISSN: 2329-9509
ISSN: 2329-9509
Research Article - (2014) Volume 2, Issue 2
Objectives: We investigated whether different durations of voluntary exercise in rats during transition from the growing period to adulthood would have any positive effects on bone structure of tibiae in adult rats.
Methods: Male Sprague-Dawley rats (5 weeks old) were divided into six groups: (1) 10SC (n=6), sedentary controls housed in normal plastic cages until age 15 weeks; (2) 10VE (n=7), housed in a voluntary-exercise (running-wheel) device equipped with housing space until age 15 weeks; (3) 30SC (n=7), sedentary controls housed in normal plastic cages until age 35 weeks; (4) 30VE (n=7), housed in the voluntary-exercise device until 35 weeks; (5) 10C20E (n=7), housed in normal plastic cages until age 15 weeks, then in the voluntary-exercise device from age 16 weeks to 35 weeks; (6) 10E20C (n=10), housed in the voluntary-exercise device until age 15 weeks, then in normal plastic cages from 16 weeks to 35 weeks. At the end of the experimental period, the right tibia from each rat was taken for peripheral quantitative computed tomographic (pQCT) analysis.
Results: The results indicate 1) cortical area and bone mineral content (BMC) in the diaphyses were significantly greater in 30VE than in 30SC; 2) trabecular bone mineral density (BMD) in the proximal metaphyses was significantly greater in 30VE than in 30SC; 3) these positive alterations in tibial bone mass parameters in 30VE were not seen in 10VE, 10C20E, or 10E20C.
Conclusions: These results suggest that prolonging voluntary exercise after the growing period could be an important way of improving tibial bone mass in adult rats.
<Keywords: Voluntary exercise; Bone mineral content; Bone mineral density; pQCT; Rat
Prevention of osteoporosis, which is a risk factor for bone fractures, is an important component of sustained lifelong health. Previous studies have examined the effects of various factors such as hormone therapy or nutritional supplementation on the development of osteoporosis [1-4]. Physical activity is effective against the development of this disease. For example, although mammalian bone mass normally decreases with age, increasing physical activity attenuates this trend in the elderly [5-11]. Furthermore, some forms of physical training during puberty can increase the mass of specific bones, which might help to prevent osteoporosis [12,13].
We previously found that the distance ran by rats that started Voluntary Wheel-Running (VWR) at five weeks of age peaked five weeks later and then progressively declined until the end of the training period at 30 weeks later [14]. This phenomenon resembles the profiles of physical activity that are most commonly associated with the human transition from childhood to adulthood in modern society. Indeed, Engstrom reported that the amount of time individuals spent on physical activity during leisure time at the age of 15 years was halved by the age of 20 years [15].
Therefore, the present study aimed to determine the effects of continuing a lower level of physical training into adulthood on bone mass in adult rats after a period of vigorous activity during growth. We also examined which periods within a prolonged training regime could most significantly influence the parameters of tibial bone mass in rats performing VWR to assess relationships between different growth phases and the effects of exercise. We considered that the findings would be useful to help prevent osteoporosis.
Animals
The Committee for the Use of Animals in Research at International Budo University approved this study. Four-week-old male Sprague- Dawley rats (n=44) were individually housed for one week in standard plastic cages (W 29×D 44×H 20 cm) to acclimatize them to the laboratory environment (room temperature and humidity, 22 ± 2°C and 60% ± 5%, respectively; 12:12-h light-dark cycle). The rats were randomly assigned to the following groups at the age of five weeks: (1) 10SC (n=6, average body weight 126 g), sedentary controls housed in standard plastic cages until the age of 15 weeks; (2) 10VE (n=7, average body weight 131 g), housed in a YVN95 voluntary-exercise (runningwheel) device equipped with a (W 20×D 30×H 20 cm) housing space (Yamashita Giken, Tokushima, Japan) until the age of 15 weeks (3) 30SC (n=7, average body weight 142 g), sedentary controls housed in standard plastic cages until the age of 35 weeks; (4) 30VE (n=7, average body weight 143 g), housed in the exercise device until the age of 35 weeks; (5) 10C20E (n=7, average body weight 146 g), housed in standard plastic cages until the age of 15 weeks, then in the exercise device from the age of 16 to 35 weeks and (6) 10E20C (detraining) (n=10, average body weight 142 g), housed in the device until the age of 15 weeks, then in standard plastic cages from the age of 16 to 35 weeks. The body weight of all rats and their food intake was measured 3~4 times weekly until the end of each experimental period. All rats were individually housed with access to food and water ad libitum throughout the study.
| Group | Body weight (g) | Food intake per day (g/day) |
|---|---|---|
| 10SC | 529 ± 39 | 29.8 ± 2.1 |
| 10VE | 500 ± 70 | 35.5 ± 4.1* |
| 30SC | 640 ± 24 | 28.3 ± 1.7 |
| 30VE | 618 ± 58 | 32.5 ± 1.4* |
| 10C20E | 616 ± 58 | 29.2 ± 1.8 |
| 10E20C | 671 ± 53 | 29.3 ± 1.9 |
Means ± SD. *p<0.05 vs. age-matched corresponding SC group. Mean body weight was determined in each group at end of housing period.
Table 1: Body weight and food intake of rats.
| Group | Total running distance (km) | Average running distance (m/day) |
|---|---|---|
| 10VE | 211 ± 160 | 3222 ± 2431 |
| 30VE | ... | ... |
| 5-35W | 241 ± 113 | 1215 ± 568 |
| 5-15W | 170 ± 100 | 2456 ± 1421 |
| 16-35W | 71 ± 27 | 551 ± 209* |
| 10C20E | 43 ± 30*† | 304 ± 217*‡ |
| 10E20C | 138 ± 88 | 1972 ± 1257 |
Means ± SD. p<0.05 vs. *10VE; †30VE (5 – 35W); and ‡30VE (5 – 15W).
Table 2: Total and average distances ran.
Voluntary exercise
The rats in the voluntary exercise groups (10VE, 30VE, 10C20E, and 10E20C) had free access to a running wheel for 24 hours per day (except for the few minutes during which they were weighed) throughout the defined periods of voluntary exercise. The electrical load on the axis of each running wheel was set at about 5% of the body weight of each rat at the start of the voluntary exercise period. Thereafter, the load was adjusted to about 5% of body weight whenever the rat was weighed. The number of wheel rotations was downloaded every minute into a personal computer throughout each voluntary exercise period. Running distances were calculated as the number of wheel rotations×wheel circumference (one meter).
Bone sampling
At the end of the experimental period, each rat was weighed and then anesthetized with an intraperitoneal injection of pentobarbital sodium (60 mg/kg body weight). After dissecting the tibia from the right leg, the fibula was removed and the whole tibia was stored in 75% ethanol at 4°C.
Measurements of bone mass parameters
Bone mass parameters were obtained for the proximal metaphysis and diaphysis of the tibia by Peripheral Quantitative Computed Tomographic (pQCT) evaluation using XCT Research SA+ (Stratec Medizintecnik GmbH, Germany) [7]. Briefly, total and trabecular cross-sectional areas, bone mineral content (BMC), and bone mineral density (BMD) in the proximal metaphysis of the tibia were measured at a site 3 mm distal from the growth plate. Total and cortical crosssectional areas, BMC, BMD, and the Strength Strain Index (SSI) in the diaphysis were measured at the halfway point along the length of the tibia. Cortical and trabecular bone areas were identified using the BMD values. That is, areas with BMD>690 and <395 mg/cm3 were defined as cortical and trabecular bone, respectively. The slice thickness and voxel size of all Computed Tomography (CT) images were 0.77 and 0.12 mm, respectively.
Statistical analysis
All data are presented as means ± SD. Data were compared among age-matched experimental groups. Significant differences between the two groups at 15 weeks were analyzed using the Mann-Whitney U-test. Significant differences among the four groups at 35 weeks were tested using one-way ANOVA. Significant F values in one-way ANOVA were analyzed using multiple-comparison Dunnett’s tests. The amounts of voluntary running by the exercise intervention groups were corrected using the mean values of the corresponding age-matched SC groups and analyzed using multiple-comparison Tukey-Kramer tests when F values were significant in one-way ANOVA. Statistical significance was set at p<0.05.
Body weight and food intake
Voluntary exercise and detraining did not apparently affect body weight since these did not significantly differ in any of the interventional and age-matched SC groups (10VE vs. 10SC, 30VE, 10C20E, 10E20C vs. 30SC).
Voluntary exercise affected daily food intake, being significantly greater in the 10VE and 30VE, than in the age-matched SC groups. Food intake did not significantly differ between the 10C20E and 10E20C groups that had periods without exercise and the 30SC group (Table 1).
Voluntary wheel-running distance
Values obtained for total and average distances ran by group 30VE (housed in the voluntary exercise device from 5 to 35 weeks of age) are given for the 5-35 (entire period), 5-15, and 16-35-week groups. Total running distance was significantly lower for 10C20E than for either 10VE or 30VE (5-35 weeks; -80% vs. 10VE, -82% vs. 30VE). However, the total distance ran by 10C20E (voluntary exercise only from 16 to 35 weeks of age) did not significantly differ from the 30VE group at 16 to 35 weeks. The total distance ran by the 10E20C group that was allowed voluntary exercise only from 5 to 15 weeks of age did not significantly differ from that ran in the 5-15W period by the 30VE group. Moreover, the total distance ran by 10E20C, 10VE, and 30VE did not significantly differ.
Average running distances (m/day) were significantly lower in 10C20E and in 30VE (16-35W) than in 10VE. Moreover, the average distance ran was significantly lower for group 10C20E than for the 30VE group (5-15 weeks). However, the average distance ran did not significantly differ between 10C20E and the later period of 30VE (16- 35 weeks). Likewise, the average distance ran did not significantly differ between 10E20C and either 10VE or 30VE (5-15 weeks) (Table 2).
Bone mass parameters
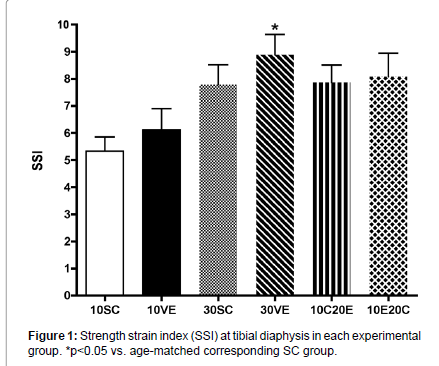
Figure 1:Strength strain index (SSI) at tibial diaphysis in each experimental group. *p<0.05 vs. age-matched corresponding SC group.
The effects of continuing voluntary exercise into adulthood on bone mass parameters in the proximal metaphysis and diaphysis were determined (Tables 3 and 4, respectively). The trabecular area in the proximal metaphysis was significantly smaller in 30VE than in 30SC (-20%), but trabecular BMD was significantly greater in 30VE that in 30SC (+29%; Table 3). However, bone mass parameters did not significantly differ between the 10VE, 10C20E, and 10E20C interventional groups and the corresponding age-matched SC groups except for total BMC, which was significantly lower in 10C20E than in 30SC (Table 3).
| Group | Total area |
Trabecular area | Total BMC |
Trabecular BMC | Total BMD | Trabecular BMD |
|---|---|---|---|---|---|---|
| (mm2) | (mg/mm) | (mg/cm3) | ||||
| 10SC 10VE 30SC 30VE 10C20E 10E20C |
27.8 ± 1.65 28.5 ± 3.17 30.3 ± 2.96 28.9 ± 2.87 25.7 ± 1.74 27.4 ± 3.90 |
14.8 ± 1.27 13.3 ± 1.65 14.8 ± 2.15 11.8 ± 2.39* 12.6 ± 0.92 14.0 ± 2.11 |
13.1 ± 1.35 13.7 ± 1.37 16.9 ± 1.58 17.4 ± 1.79 14.5 ± 1.33* 15.1 ± 1.78 |
2.97 ± 0.40 2.87 ± 0.21 2.51 ± 0.35 2.62 ± 0.64 2.01 ± 0.48 2.23 ± 0.70 |
471 ± 35.7 482 ± 14.9 560 ± 40.7 604 ± 51.4 562 ± 24.2 553 ± 36.5 |
202 ± 27.8 218 ± 14.9 172 ± 25.5 222 ± 30.6* 159 ± 35.5 157 ± 38.6 |
Means ± SD. *p<0.05 vs. age-matched SC group. BMC, bone mineral content; BMD, bone mineral density; CT, computed tomography.
Table 3: Peripheral quantitative CT parameters of proximal tibial metaphysis.
| Group | Total area |
Cortical area | Total BMC |
Cortical BMC |
Total BMD | Cortical BMD | |
|---|---|---|---|---|---|---|---|
| (mm2) | (mg/mm) | (mg/cm3) | |||||
| 10SC 10VE 30SC 30VE 10C20E 10E20C |
8.2 ± 0.45 8.9 ± 0.91 10.2 ± 1.10 11.0 ± 0.62 10.0 ± 0.68 10.2 ± 0.92 |
5.49 ± 0.31 5.76 ± 0.56 6.66 ± 0.34 7.44 ± 0.51* 6.73 ± 0.28 6.70 ± 0.42 |
7.47 ± 0.46 7.96 ± 0.79 9.38 ± 0.64 10.70 ± 0.76* 9.25 ± 0.38 9.34 ± 0.56 |
7.03 ± 0.40 7.41 ± 0.75 8.93 ± 0.43 10.06 ± 0.75* 9.01 ± 0.37 9.04 ± 0.51 |
914 ± 33.3 898 ± 42.1 924 ± 78.8 974 ± 55.6 928 ± 47.4 918 ± 52.8 |
1280 ± 17 1286 ± 10 1341 ± 18 1353 ± 20 1340 ± 11 1350 ± 16 |
|
Means ± SD. *p<0.05 vs. age-matched group. BMC, Bone mineral content; BMD, bone mineral density; CT, computed tomography.
Table 4: Peripheral quantitative CT parameters of tibial diaphysis.
The cortical area, total BMC, cortical BMC, and SSI in the diaphysis were significantly greater for 30VE than for 30SC (+12%, +14%, +13%, and +10%, respectively; Table 4 and Figure 1). However, bone mass parameters for the tibial diaphysis did not significantly differ between the other interventional groups and corresponding age-matched SC group (Table 4 and Figure 1).
Ashizawa et al. [12] found that the cortical BMC of the radial diaphysis was higher in the dominant arm of tennis players than in the non-dominant arm, but BMD did not increase at this site. Results in the humerus of tennis players and the tibiae of jumpers are similar [16,17]. These findings indicated that an increase in the size of a specific bone is influenced by high-impact exercise. However, the present results showed that the cortical BMC and area increased at the tibial diaphysis of 30VE rats (Table 4). These findings indicated that cortical bone might also be increased not only by high (e.g., jumping or tennis), but also by low (e.g., running or walking) impact exercise, when the latter is continued from growth into adulthood. Moreover, the significantly greater SSI of the tibial diaphysis in 30VE than in 30SC indicated that the increase in cortical bone size induced by prolonged VWR might have contributed to the enhanced bone strength at this tibial site.
In contrast, the amount of trabecular area at the proximal metaphysis was significantly lower in 30VE than in 30SC, although a decrease in trabecular BMC at the proximal metaphysis did not significantly differ between these groups. Moreover, trabecular BMD at this site was significantly greater in 30VE than in 30SC. Fujie et al. [18] evaluated geometric changes in tibiae using micro X-ray CT and found a significantly smaller trabecular area at the proximal tibial metaphysis in treadmill-trained, than in control rats. Bone size is a particularly important contributor to bone strength [19], but BMD is also important. Therefore, the increase in trabecular BMD at the proximal metaphysis in the 30VE group might be a compensatory adaptation to maintain bone strength against a decrease in the area of trabecular bone induced by endurance training.
The responses of bone mass parameters to prolonged VWR differed at the proximal tibial metaphysis and at the tibial diaphysis. Since others have identified site-specific responses to identical exercise stimuli in a specific bone [20-22], and our findings of the tibial sites of 30VE rats are consistent with these results. Westerlind et al. [23] demonstrated that strain energy density differs at different sites within a single bone, and this variation might produce differential and site-specific changes in bone in response to identical overall exercise stimuli.
Taken together, the present results indicate that although significant positive changes of tibial bone mass parameters in adult rats were induced by prolonged VWR, these positive changes were not induced by exercise only during the growth period or only during adulthood. We speculate that interactions among mechanical stress, continued VWR, and gains in body mass might act to effectively improve the tibial bone mass of adult rats. Although VWR did not obviously improve tibial bone mass during the growth period from the ages of 5 to 15 weeks, the osteogenic potential of bone in young rats might be increased by VWR compared with age-matched sedentary control rats. Under these osteogenic conditions, bone mass might be improved when both VWR and mechanical stresses are imposed on the tibia by increases in body weight, even if the amount of exercise declines with age. This interpretation is supported by the finding that tibial bone mass parameters did not improve in the 10E20C group that ceased VWR after the growth period compared with age-matched control rats. However, bone metabolic markers should be measured and/or osteoblast activities should be evaluated by bone histomorphometry to verify our findings.
Tibial bone mass can be improved in adult rats by prolonging VWR from the growth period into adulthood. Such improvement might be brought about in rats through continuous voluntary exercise during growth and development into adulthood, and by loading bone with mechanical stress through both VWR and increasing body weight during adulthood. If these results can be extrapolated to humans, we postulate that continuous participation in physical exercise without lapsing into extreme inactivity might enhance and/or maintain bone mass in adulthood, and thus help to prevent osteoporosis.
This study was partially supported by a research grant from the Budo Sports Research Center, an affiliate of International Budo University.