Entomology, Ornithology & Herpetology: Current Research
Open Access
ISSN: 2161-0983
ISSN: 2161-0983
Research - (2019)Volume 8, Issue 3
Understanding of mechanism for genetic polymorphisms within and among species is an important issue in ecology and evolutionary biology. A ladybug, Harmonia axyridis (PALLAS), shows extreme elytral color polymorphism, in which more than 100 types have been recognized. This polymorphism has been explained with the inheritance of 12 hypothetical alleles at a single autosomal locus. However, why such extreme polymorphism is maintained has not been clarified. Here, we show that several morphs enlarge their aggregation size during grouping before hibernation. Our results showed that the excess (or fewerness) of either one of the four color morphs from the expected values showed each a significantly positive effect on the aggregation size. A larger aggregation size resulted in better survival of all the aggregating members. These results suggest that it is beneficial for survival to aggregate with these morphs. This survival benefit during hibernation explains partly the extreme color polymorphism in this species.
Harmonia axyridis; Color polymorphism; Aggregation size
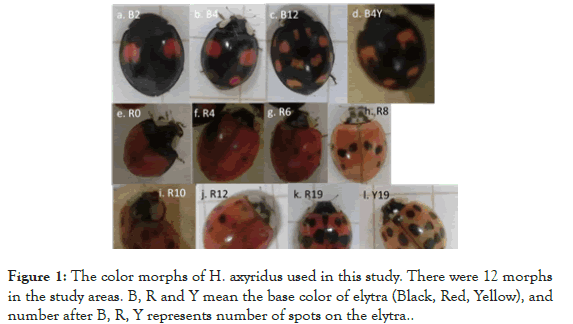
Understanding of evolution and maintenance of biodiversity in nature is one of the most important issues in ecology and evolutionary biology [1-3]. A ladybug, Harmonia axyridis (Pallas 1773), shows an extreme elytral color-pattern polymorphism in which more than 100 patterns have been recognized [4,5] (Figure 1). The inheritance mode of this polymorphism has been explained by the 12 alleles at a single autosomal locus [5]. Some morphs show different preferences for foods (aphid species) or mate's morph [6,7]. However, why this extreme polymorphism is maintained remains unclear.

Figure 1. The color morphs of H. axyridus used in this study. There were 12 morphs in the study areas. B, R and Y mean the base color of elytra (Black, Red, Yellow), and number after B, R, Y represents number of spots on the elytra.
Harmonia axyridis excretes an aggregation pheromone and aggregates with other individuals during hibernation [7,8]. If different morphs have different types of the pheromone, and some morphs are more attractive to other individuals, the aggregation would become large where the attractive morphs are present. In this case, a more polymorphic population may be more advantageous for survival during hibernation than a less diverse population.
In this study, we examined the effects of the 12 morphs collected just before hibernation on the size of aggregation under experimental conditions and discuss the possibility that the polymorphism in H. axyridis is maintained in part via the above mechanism. We collected more than 300 individuals of H. axyridis from the Hokkaido Forest Research Station of the Field Science Education and Research Center of Kyoto University during 19th-24th October, 2017. There were 2 basic types with either a black (melanic) or red (non-melanic) base color of the elytra with various numbers of spots of the other color in the collected samples in which we could recognize a total of 12 morphs based on the number of spots (Figure 1).
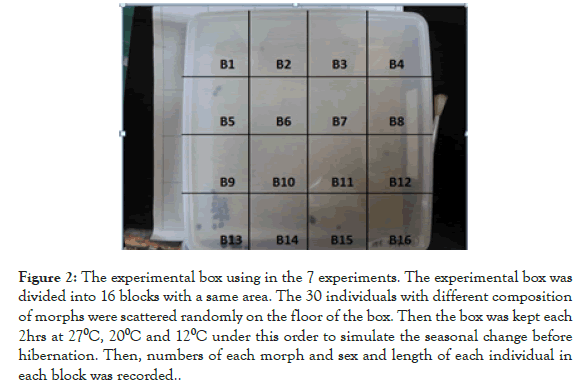
For example, a morph with the black base and 2 red spots is represented as B2, and that with a red base and 4 black spots is R4, and so on. By using this representation, we identified the following 12 morphs in the samples: B2, B4, B4Y (spots are yellow), B12, R0, R4, R6, R8, R10, R12, R19 and Y19 (base color is yellow). Two to 9 morphs were used once in 7 experiments in this study, and each group is called “the experimental group” in this article (Figure 2).

Figure 2. The experimental box using in the 7 experiments. The experimental box was divided into 16 blocks with a same area. The 30 individuals with different composition of morphs were scattered randomly on the floor of the box. Then the box was kept each 2hrs at 270C, 200C and 120C under this order to simulate the seasonal change before hibernation. Then, numbers of each morph and sex and length of each individual in each block was recorded.
In 15 November 2018, we collected an additional sample consisted of 171 individuals to confirm an extreme female-biased sex ratio observed in the 2017 sample. All the individuals used were reared under room temperature and fed with an artificial diet (for the contents of diet [9]). A plastic box (20 × 20 × 5 cm) with a cover was prepared, and the bottom face of the box was divided into 16 blocks of equal area to test the effect of blocks. First, a total of 30 individuals consisting of several (2 to 9 according to the experimental group) morphs were scattered on the bottom of the box, which was sealed with the lid and placed in a chamber (MEE CN-25A, NK System, Osaka, Japan) at 27oC for 2 hrs.
Then, the temperature setting was changed to 20oC. After the insects were kept in the incubator for 2 hrs in 20oC, the temperature was set at 12oC, and they were kept for 2 hrs at 12oC. These temperatures were used to imitate temperature changes at the hibernation site, 12oC for aggregations for hibernation, 20oC autumn temperature, 27oC summer temperature. Before each experiment, the inside of the box was wiped with 80% ethanol to remove aggregation pheromones from the previous experiment. In addition, to remove effects of the previous experiment, which might possibly remain in the box or chamber, at least a 2-hour interval has been taken between the two experiments.
The experiments were conducted under a dark condition, because these bugs aggregate at dark sites (e.g., behind of walls) during the hibernation. After these treatments, we opened the lid and took a photograph from above using a digital camera (EX-ZR20, CASIO, Tokyo, Japan). We counted the number of individuals and morphs in every formed aggregation and recorded the blocks where they aggregated. This experiment was repeated 7 times by replacing the introduced individuals. Each individual was used only once to avoid the confound effects of the pseudo replication on the results.
We analyzed the data using generalized linear models (GLMs) and a generalized linear mixed model (GLMM). First, the size of the formed aggregations was set as the dependent variable. Independent variables were set as residuals of each morph in an experimental group from the expected number predicted from relative proportion of each morph in an experimental group. The distribution of the dependent variable seemed to be a negative binomial distribution, we estimated the required parameters of the negative binomial distribution for GLM by using the glm.nb () function in the MASS package for R. We started the analyses using a full model that included the residuals of 12 morphs and their interaction terms. As several of the terms were not significant or had no information (such variables were represented as “NA” in the results in R), we removed these uninformative variables and interaction terms and repeated the GLM analyses using the remaining variables. All the statistical analyses were conducted by R (ver. 3.4.3).
First, we checked the effect of the experimental group (E; 1~7) by adding E to the above final model as an independent variable. As E was not significant in this model (estimate=-0.03418, S.E.=0.02430, t=-1.406, p=0.1626), we combined all the experimental group data. Then, we examined the effect of block on the aggregation size by adding the block number (B; 1~16) as an independent variable to the above GLM. As the estimated effect of B was significant (estimate=0.07207, S.E.=0.02489, t=2.896, p=0.0046), we constructed a GLMM model with B as a random effect. Using this GLMM, we examined the effect of excess or fewness from the expected number of morph on the size of the aggregation by controlling for the effect of block.
Next, we confirmed whether the formed aggregation sizes differ depending on the excess (or fewness) of males and females from the expected frequencies (the residuals) or not. The formed aggregation size was set as the dependent variable, male’s and female’s residuals were set as the independent variables. In addition, we examined effects of body size of individuals on aggregation size. We measured length of each individual (tip of head to end of elytra) from the photographs using Image J (ver. 1.5h). Body length difference among the morphs was tested by one-way ANOVA analyses.
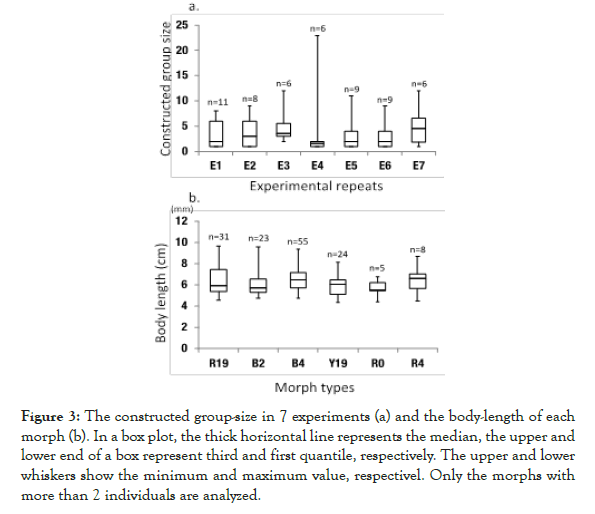
We constructed GLMs considering possible affecting factors on the aggregation size. Because we were not able to judge whether the distribution of the dependent variable was a negative binomial or a Poisson, we compared Akaike’s information criteria (AIC; [10]) between GLMs that assume one of those distributions (Figure 3). AICs were 1278.6 and 1685.3 in the model using a negative binomial distribution and a Poisson distribution, respectively. Thus, the model used a negative binomial distribution was selected as the better one. Following this result, we constructed a GLMM model using the above negative binomial distribution with the each significant morph as a random effect. From this model, we examined whether the size of morphs affects to the size of aggregations.

Figure 3. The constructed group-size in 7 experiments (a) and the body-length of each morph (b). In a box plot, the thick horizontal line represents the median, the upper and lower end of a box represent third and first quantile, respectively. The upper and lower whiskers show the minimum and maximum value, respectivel. Only the morphs with more than 2 individuals are analyzed.
Finally, we conducted a GLMM in which we set the significant factors in the above analyses on the aggregation size as random effects and estimated the fixed effects of morphs. This procedure was conducted by using the lme4 package for R. Next, the male’s and female’s residuals and their interaction showed no significant effects on the aggregation size (Table 1).
| Estimate | S.E. | t value | p value | |
|---|---|---|---|---|
| Intercept | 1.614 | 0.194 | 8.327 | <2e-16 |
| rF | -0.123 | 0.203 | -0.603 | 0.546 |
| rM | -0.173 | 0.409 | -0.424 | 0.671 |
| rF:rM | 0.048 | 0.370 | 0.130 | 0.897 |
Table 1: Results of the GLM for effects of females and males on the formed group size. All the independent variables (the residuals of female, male and their interaction term) showed no significant effects on the aggregation size.
As the body size among morphs and the constructed group size among experiments did not vary among the factors (Tables 2 and 3), differences in morph size or in experiments could neglect.
| Df | Sum of Sq | Mean square | F value | P | |
|---|---|---|---|---|---|
| Experiment | 6 | 42.50 | 7.083 | 0.420 | 0.862 |
| Residuals | 48 | 809.68 | 16.868 | - | - |
Table 2: Results of the one-way ANOVA among the constructed group size in 7 experiments. The constructed group size did not differ between the experiments.
| Df | Sum of Sq | Mean square | F value | P | |
|---|---|---|---|---|---|
| Experiment | 10 | 0.148 | 0.015 | 0.885 | 0.549 |
| Residuals | 143 | 2.390 | 0.017 | - | - |
Table 3: Results of the one-way ANOVA among the size of each morph. The lengths did not differ between the morphs.
Second, the block (B) had a significant effect on the aggregation size in the GLM (estimate=0.07207, S.E.=0.02489, t=2.896, p=0.0046). Based on these results, we conducted a GLMM with block position as the random effect.
As a result, B2, B4, R0 and R19 remained as significant independent variables along with an interaction terms (B2:R19; Table 4). All of these variables are highly significant and have positive coefficients except for the interaction term. These 4 morphs show relatively high frequencies in the present population except with R0 (Figure 3).
| Estimate | S.E. | t value | p value | |
|---|---|---|---|---|
| Intercept | 1.2938 | 0.3338 | 3.876 | 0.000106 |
| Size | 0.1003 | 0.4404 | 0.228 | 0.819831 |
Table 4: Results of the GLMM for examining the effect of the morph size on the aggregation sizes. The morph type was set as a random effect because a preliminary analysis showed that the morphs showed different effects on the aggregation sizes. Thus, we constructed the GLMM to examine the effect of morph size on the aggregation size by setting the morph types as the random effect. However, the morph size showed no significant effect on the aggregation size.
Thus, we constructed the GLMM to examine the effect of morph size on the aggregation size by setting the morph types as the random effect. However, the morph size showed no significant effect on the aggregation size.
The average body length of males and females was compared. As the distribution of body length was significantly deviated from normality in females (Shapiro-Wilk test: for male, W=0.972, p=0.881; for female, W=0.941, p=1.37e-5), we used Mann-Whitney’s u-test for this comparison. Because there is no significant size difference between sexes (Mann-Whoitney’s U test, W=933, p=0.505), we combined both the sexes in analyzing size effects. After the above procedures, we obtained the final model, which contained 4 variables (B2, B4, R0 and R19) and one interaction term (B2:R19: Table 5).
| Estimate | S.E. | t value | p value | |
|---|---|---|---|---|
| Intercept | 0.52558 | 0.12995 | 4.045 | 5.24E-05 |
| B2 | 0.32182 | 0.08057 | 3.994 | 6.49E-05 |
| B4 | 0.16894 | 0.02666 | 6.337 | 2.34E-10 |
| R0 | 0.76290 | 0.26891 | 2.837 | 0.00455 |
| R19 | 0.44392 | 0.09091 | 4.883 | 1.04E-06 |
| B2:R19 | -0.11159 | 0.03268 | -3.412 | 0.000645 |
Table 5: Results of the final GLMM considering all of the results presented above. In this GLMM, the formed aggregation size was set as the dependent variable, and the residuals of the observed number of each morph from the expected one were the independent variables, and block position was set as the random effects because the block position showed a significant effect on the constructed group size in a preliminary GLM. During the process of obtaining the final model, the variables indicated as “NA” (meaning this variable has no information for the model) or those that were non-significant were removed from the following analysis.
Our results show that the 4 morphs of H. axyridis (B2, B4, R0 and R19) have positive effects on the aggregation size for hibernation. The larger aggregation size affects the overwintering survival of individuals in the aggregation. At the sampling site, their habitats could be as cold as below -10℃. Although they hibernate at hidden sites at which temperature seems to be higher than outside, in such an environment, morphs that hibernate in a large aggregation would better survive and persist in populations. In the present population, B2, B4 and R19 are the most frequent morphs (Figure 4). One may imagine that the relatively frequent morphs also tend to appear in the formed aggregation at high frequencies. However, our analyses conducted in considering difference in absolute difference in frequency by using the residuals of the observed frequency of each morph from the expected frequency in each experimental set. Thus, our results of statistical analysis rule out random appearance of morphs in aggregation.
Figure 4. The relative frequencies of the 12 morphs used in the experiments. These frequencies were set to reflect those in the collected samples. The black bars represent melanic morphs, and the orange bars represent non-melanic morphs.
A previous study showed that there is a geographical cline in the frequencies of the morphs in H. axyridis [11]. The melanic types are more frequent in the northern area in Japan and vice versa [11]. Although an old book reported a reverse trend [12] we followed a new report in this article. The non-melanic morphs (R0 and R19) also showed a positive effect on the aggregation size, and their slopes (Estimate in Table 5) seemed to be steeper than those of the melanic morphs (Table 5). Thus, although the non-melanic morphs are inferior in low-temperature environments, they may have an advantage in forming large aggregations for hibernation. Therefore, the non-melanic morphs persist in the cold areas in the observed geographic cline. Another study showed that in the first reproductive season (spring), H. axyridis individuals prefer non-melanic morphs as mates, but in the second season (summer), they prefer melanic ones [6]. As the melanic morph undergoes more stress during the hot season, this change in mate preference seems to be reasonable. These suggest that the extreme polymorphism in H. axyridis may be maintained through morphs' differential adaptation to thermal environments. Our results partially support this hypothesis [13-15].
In H. axyridis, an aggregation pheromone has been detected. If the degree of the effect of the pheromone differs among morphs, a more diverse aggregation may be more attractive to other conspecific individuals. This possibility is partly suggested by our experiments because the different morphs have different degrees of effects on forming aggregations. However, several other factors have affected the various ecological characteristics of H. axyridis. Therefore, more studies are required to elucidate the mechanism maintaining this extreme polymorphism in this species.
We thank Dr. Kazuya Kobayashi for providing the samples and for facilitating the use of the Hokkaido Forest Research Station of the Field Science Education and Research Center of Kyoto University. This study was partly supported by Grants-in-Aid from the Ministry of Education, Culture, Sports Science and Technology of Japan to E.H. (nos. 26440228 and 15H04420).
Citation: Murakami Y, Hasegawa E, Watanabe S (2019) Effects of Color Morph on Aggregation Formation for Hibernation in an Extremely Color Polymorphic Ladybug, Harmonia axyridis (Pallas) (Coleoptera: Coccinellidae). Entomol Ornithol Herpetol. 8:219. DOI: 10.35248/2161-0983.19.8.219.
Received: 29-Oct-2019 Accepted: 12-Dec-2019 Published: 19-Dec-2019 , DOI: 10.35248/2161-0983.19.8.219
Copyright: © 2019 Murakami Y, et al. This is an open-access article distributed under the terms of the Creative Commons Attribution License, which permits unrestricted use, distribution, and reproduction in any medium, provided the original author and source are credited.