Journal of Hematology & Thromboembolic Diseases
Open Access
ISSN: 2329-8790
ISSN: 2329-8790
Research Article - (2015) Volume 3, Issue 2
Objective: Iron deficiency still remains the most common nutritional deficiency throughout the world and is the leading cause of anaemia in children. Early recognition of iron deficiency, even before the development of anaemia is crucial to prevent the systemic complications of this disease. Methods: Ninety-seven school children between 5 and 16 years were stratified into prelatent iron deficiency (10 cases), latent iron deficiency (14 cases), overt iron deficiency anemia (13 cases), and controls (60 cases). All hemograms were performed on the same day of collection using the same Sysmex XE-2100 analyzer with reticulocyte indices included. Biochemical markers such serum iron, total iron binding capacity and percent saturation (calculated) in addition to serum ferritin and serum transferrin receptors were simultaneously measured. Data analysis was done using ANOVA test, generalized linear regression, and ROC curve. Results: Our study indicates that a panel based on hematologic parameters including reticulocyte hemoglobin at a cut off of ≤27 and ≤25.6, serum transferrin receptors at a cut off >0.48 and >0.68, red cell distribution width at a cut off >13.8 and >16.8 may provide an alternative to the traditional biochemical panels for the diagnosis of latent iron deficiency and overt iron deficiency anemia respectively. Conclusion: Whenever iron deficiency is thought of, a hemogram including reticulocyte hemoglobin and serum transferrin receptors would be the adequate diagnostic panel obviating the need for a more extensive one. These parameters should always be interpreted in the clinical context involving dietary habits, social standard as well as family history.
Keywords: Iron deficiency; School children; Reticulocyte hemoglobin
Iron deficiency (ID) still remains the most common nutritional deficiency throughout the world and is the leading cause of anaemia in children. Iron deficiency occurs in stages starting with a non-anemic phase which was described as early as 1968 by Heinrich [1] as prelatent and latent stages with the former being characterized by depleted iron stores with normal serum iron and transferrin levels, reflecting the body’s versatile ability to compensate. Latent ID on the other hand reflects a more advanced stage where depletion of iron starts to show peripherally with lowering of serum iron and microcytosis, thus reflecting a state of iron deficient erythropoiesis. Clinical iron deficiency or iron deficiency anaemia is a further deterioration when the body eventually succumbs to the limited resources especially in the face of increased demand as is the case with growing children and adolescents.
Although anaemia can be reversed with iron supplementation, the alteration in cognitive performance observed in children with iron deficiency may not be fully correctable [2]. Iron deficiency even without anemia is also associated with adverse effects on neurocognitive development [3] and evidence that these effects may be permanent is mounting [4,5]. For example, children who had chronic iron deficiency in infancy had poorer mental and motor functioning when compared with their non–iron-deficient counterparts more than 10 years later [6]. Early recognition of iron deficiency, even before the development of anaemia is therefore crucial to prevent the systemic complications of this disease. Consequently, replenishment of the body’s iron stores will take not only less time and therefore be cost effective, but also will limit the time patients are exposed to the unpleasant side effects of iron therapy and consequently ensure better adherence to therapy.
The diagnosis of simple iron deficiency has been traditionally based on a panel of biochemical indicators of iron metabolism, which includes the determination of serum or plasma iron, transferrin, transferrin saturation and ferritin. However these are liable to biological variability, such as diurnal variation, fluctuation with dietary intake, and as acute phase reactants, alteration in inflammatory states. Hematological tests are more widely used to screen for iron deficiency. Hemoglobin is the most commonly used hematological screening test, but it is derived from the entire population of red blood cells, each with a lifespan of about 120 days, and therefore takes some time to be altered by iron deficiency. Consequently, relying on hemoglobin for screening will delay the detection of iron deficiency in infants who are not yet anemic but for whom adverse neurological consequences may have already begun to occur. More recently measurements of soluble transferrin receptors (sTfR) and reticulocyte cellular indices have been added to the diagnostic menu [7-10].
To compare the true predictive value of reticulocyte hemoglobin (RetHe) to the standard haematological and biochemical parameters in the early detection of iron deficiency and to set local Ret He cutoff values for delineating iron deficient states.
A cohort of 97 school children presenting to the pediatric clinic, age ranging from 5-16 were included in the study, consisting of 58 Qataris, 39 non-Qataris, male/female was 43/54. To all cases complete blood count and iron study were ordered as part of the routine investigation. Known thalassemic patients or those showing thalassemic indices, those on iron therapy, those with combined B12/folate deficiency, with signs of infection or who have received blood transfusion within the previous 4 months were excluded.
Study design
Samples were collected for the routine investigation ordered by the physician. Serum separated from the amount of blood left-over in the tubes after performing the requested tests was divided into aliquots and kept at -70°C for later assessment of serum transferrin receptors (sTfR).
All samples were collected from 7-11 am to avoid the effect of diurnal variation on iron status.
All complete blood pictures were performed on the same day of collection using the same automated analyzer (Sysmex XE-2100, software # 00-33, Sysmex, Kobe, Japan) with reticulocyte indices included. The counter is calibrated initially and checked daily according to the manufacturer’s instructions and with materials provided by the manufacturer.
Biochemical markers such serum iron, total iron binding capacity and percent saturation (calculated) were processed on automated Hitachi Modular B-800 (Roche Diagnostics, Indianapolis, IN, USA). Serum ferritin was measured by on the Architect iSR2000 (Abbott Laboratories, Abbott Park, Illinois, U.S.A.).
SerumTfR were measured in serum using the Cobas® STFR kit, a particle enhanced immunoturbidimetric assay processed on the Hitachi/Roche Cobas c501 analyzer (Roche Diagnostics, Indianapolis, IN, USA)
Ninety-seven children were enrolled in the study, of whom 43 (44.3%) were males. The median age of participants was 9 years. Cases were classified into 3 main groups. Those with a normal CBC and iron status study falling within the normal limits were termed “Controls” (60 cases).
The remaining cases were divided according to percent saturation of iron into prelatent IDA (≥15%) (10 cases) and iron deficiency (<15%).
The latter group was further subdivided according to drop of hemoglobin and reduction of mean corpuscular volume into latent (14 cases) and overt IDA (13 cases) (Figure 1).
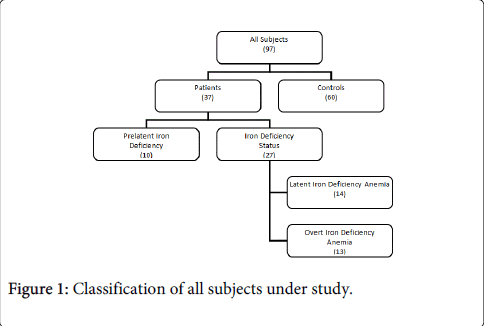
Figure 1: Classification of all subjects under study.
Statistical analysis
We used SAS version 9.1.3 (SAS Institute Inc., Cary, NC) and DTREG version 6.1. to conduct the analysis. We checked the data for normality and outliers. If the normality assumption was violated, we log transformed the variables as necessary. Spearman correlation coefficients were used to assess the relationship between continuous variables, and one-way analysis of variance (ANOVA) was conducted for comparison of group means (Kruskal-Wallis test was used if normality assumption was violated). We used Spearman’s correlation coefficients to assess the correlations between categorical variables, and Chi-square analysis to test for differences in proportions (Fisher’s exact test, if the assumptions underlying chi-square were violated).
We used generalized linear regression models to test for significant predictors iron deficiency indices and if it varies by gender, age, nationality.
We used area under the receiver operating characteristic (ROC) curve to determine a cutoff point of RetHe that could be used as predictor of iron deficiency anemia (IDA). We considered the ROC curves acceptable if AUC was >75%, negative likelihood ratio<0.5, and positive likelihood ratio>2. We defined the negative predictive value (NPV) as the probability of being non-anemic among those classified as non-anemic by the chosen cut off point i.e. the number of truly non-anemic divided by the total number of non-anemic by the cut off point (the sum of true and false negative) multiplied by 100.
The test positive predictive value (PPV) was defined as the probability of being an anemic among those classified as anemic by the chosen cut off point i.e. the number of truly anemic divided by the total number diagnosed as anemic by the cut off point (the sum of true and false positive) multiplied by 100.
The study included 97 subjects (60 controls, and 37 patients). Patients represented different iron deficiency stages, including prelatent (10), latent (14), and overt (13) (Figure 1).
The median age of study participants was 9 years (inter-quartile range 7-12). Iron deficiency status did not vary by gender (X2=0.17, p=0.920) or age (X2=1.85, p=0.174). Reticulocyte hemoglobin content, transferrin receptors, and red cell distribution width did not significantly vary by nationality or gender (p>0.05). Reticulocyte hemoglobin content (p=0.043) but not transferrin receptors and red cell distribution width (p=0.085, 0.124 respectively) significantly varied by age.
Levels of reticulocyte hemoglobin content (Tables 1-4 and Figure 2a), transferrin receptors (Table 1 and Figure 2b), and red cell distribution width table and Figure 2c), significantly varied by iron deficiency status (p<0.001).
| Iron Deficiency Status | |||||||||||
| Controls | Pre-latent | Latent | Overt | ||||||||
| Median | IQR | Median | IQR | Median | IQR | Median | IQR | ||||
| Age | 9 | 6.0-11.5 | 7.5 | 7.0-9.0 | 7.5 | 7.0-11.0 | 13 | 6.8-16.0 | |||
| % saturation | 21.4 | 16.3-29.2 | 16.9 | 15.4-19.4 | 10.2 | 8.2-12.3 | 5.1 | 5.1-7.5 | |||
| Hemoglobin (g/dl) | 12.7 | 12.2-13.1 | 12.1 | 11.2-12.5 | 11.8 | 11.6-12.3 | 9.4 | 9.3- 10.1 | |||
| Haematocrit % | 38.2 | 37.1-40.4 | 36.71 | 34.8-39.3 | 36.1 | 35.2-37.4 | 32.4 | 31.8-34.3 | |||
| Immature reticulocyte fraction | 3.4 | 2.0-4.9 | 2.71 | 2.4-3.9 | 4.4 | 3.7-6.7 | 9.3 | 6.5-9.9 | |||
| Mean corpuscular hemoglobin concentration | 32.8 | 32.2-33.5 | 31.9 | 31.5-32.9 | 32.4 | 31.6-32.8 | 29 | 29.0 30.0 | |||
| Mean corpuscular hemoglobin | 26.3 | 25.4-27.5 | 26.4 | 24.0-27.0 | 24.3 | 23.3-26.7 | 19.9 | 18.3-20.6 | |||
| Mean corpuscular volume | 80.5 | 78.0–83.0 | 78.9 | 77.6-82.2 | 81.1 | 78.3-82.6 | 68.6 | 64.8-69.3 | |||
| IQR: inter-quartile range | |||||||||||
| Iron Deficiency Status | |||||||||||
| Controls | Pre-latent | Latent | Overt | ||||||||
| Median | IQR | Median | IQR | Median | IQR | Median | IQR | ||||
| Red blood cell count (106/ul) | 4.8 | 4.6-5.1 | 4.6 | 4.6-5.1 | 4.6 | 4.4- 5.1 | 4.7 | 4.75.0 | |||
| Red blood cell distribution width% | 13.4 | 12.8-13.8 | 15.1 | 13.7-15.4 | 15 | 14.3-15.3 | 18.2 | 17.4-19.0 | |||
| Reticulocytes | 53.8 | 45.2-65.5 | 46.7 | 41.4-53.8 | 51.2 | 41.4-57.1 | 45.8 | 41.5-49.1 | |||
| Reticulocyte hemoglobin content | 29.4 | 28.0-30.7 | 28 | 27.6-29.9 | 26.3 | 25.6-27.9 | 18.7 | 18.6-22.2 | |||
| Reticulocytes % | 1.1 | 0.9-1.4 | 1 | 0.9-1.1 | 1.1 | 0.8-1.16 | 1 | 0.8-1.0 | |||
| Serum ferritin | 28.5 | 20.5-37.5 | 7 | 5.0-8.0 | 5.5 | 4.0-7.0 | 2 | 2.0-5.3 | |||
| Serum iron | 13 | 11.0-18.0 | 11 | 11.0-13.0 | 7 | 5.0-9.0 | 4 | 4.0-5.5 | |||
| Transferrin receptors | 0.4 | 0.3-0.4 | 0.5 | 0.5-0.6 | 0.6 | 0.5-0.6 | 0.8 | 0.8-1.0 | |||
| Total iron binding capacity | 60.5 | 55.5-66.5 | 64.5 | 62.0-68.0 | 70 | 64.0-74.0 | 78 | 74.8- 80.0 | |||
| IQR: inter-quartile range | |||||||||||
Table 1: Characteristics of study population by iron deficiency status.
| Status Comparison | Difference Between | Simultaneous 95% Confidence Limits | ||
| Means | ||||
| Prelatent-Latent | 2.14 | 0.11 | 4.4 | |
| Prelatent-Overt | 8.17 | 5.88 | 10.46 | *** |
| Latent-Control | -2.99 | -4.86 | -1.13 | *** |
| Latent-Overt | 6.02 | 3.6 | 8.45 | *** |
| Overt-Control | -9.02 | -10.95 | -7 | *** |
| Control-Prelatent | 0.85 | -1.01 | 2.71 | |
| Comparisons significant at the 0.05 level are indicated by *** | ||||
Table 2: Comparison of reticulocyte hemoglobin content among different iron deficiency status.
| Status Comparison | DifferenceBetweenMeans | Simultaneous 95% Confidence Limits | ||
| Prelatent-Latent | -0.06 | -0.2 | 0.08 | |
| Prelatent-Overt | -0.36 | -0.5 | -0.22 | *** |
| Latent-Control | 0.2 | 0.1 | 0.29 | *** |
| Latent-Overt | -0.3 | -0.42 | -0.17 | *** |
| Overt-Control | 0.49 | 0.4 | 0.59 | *** |
| Control-Prelatent | -0.13 | -0.25 | -0.02 | *** |
| Comparisons significant at the 0.05 level are indicated by *** | ||||
Table 3: Comparison of serum transferrin receptors among different iron deficiency status.
| Status Comparison | Difference Between Means | Simultaneous 95% Confidence Limits | ||
| Prelatent-Latent | -0.3 | -1.4 | 0.8 | |
| Prelatent-Overt | -3.45 | -4.58 | -2.33 | *** |
| Latent-Control | 1.62 | 0.83 | 2.42 | *** |
| Latent-Overt | -3.16 | -4.19 | -2.13 | *** |
| Overt-Control | 4.78 | 3.96 | 5.6 | *** |
| Control-Prelatent | -1.32 | -2.24 | -0.41 | *** |
| Comparisons significant at the 0.05 level are indicated by *** | ||||
Table 4: Comparison of red blood cell distribution width% among different iron deficiency status.
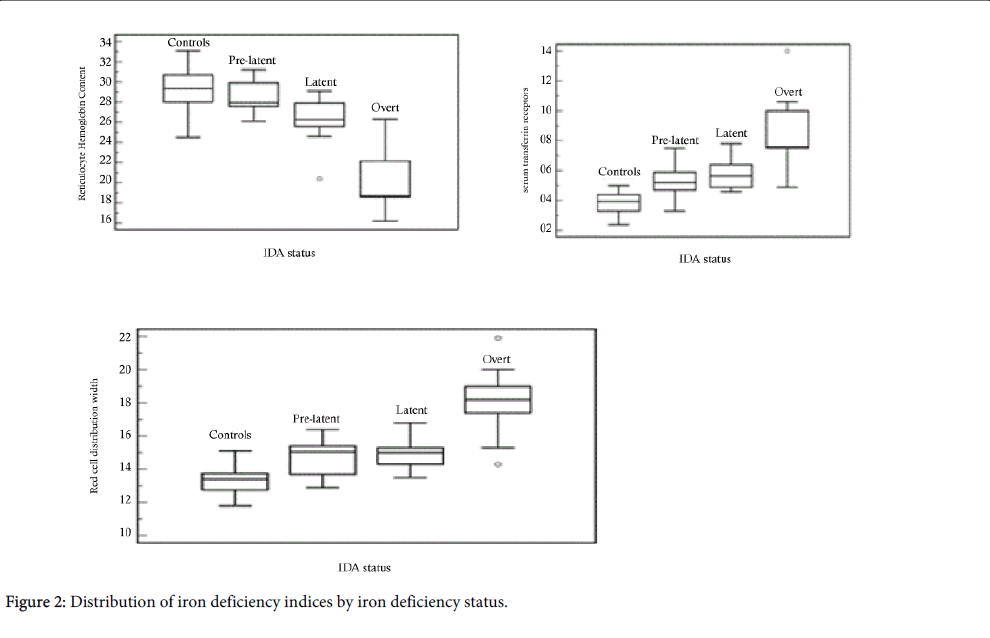
Figure 2: Distribution of iron deficiency indices by iron deficiency status.
In contrast, reticulocyte hemoglobin content, transferrin receptors and red cell distribution width did not significantly vary by nationality or gender (p>0.05). Reticulocyte hemoglobin content (p=0.008) but not transferrin receptors and red cell distribution width (p=0.084, and 0.124 respectively) significantly varied by age.
Reticulocyte hemoglobin content
Reticulocyte hemoglobin content did not yield ROC curves with area under the curve (AUC) >75%, thus no cutoff points were considered strong enough to predict pre-latent IDA.
However, reticulocyte hemoglobin content significantly predicted latent IDA (AUC=85.9% (95% CI 76.6-92.5%), with a cutoff <27, sensitivity=0.7 specificity=0.86, PPV=0.43, NPV=0.95, +LR=5.00, and -LR=0.33) and overt IDA (AUC=98.1% (95% CI 93.0-99.8%), with a cutoff <25.6, sensitivity=0.9 specificity=0.94, PPV=0.70, NPV=0.99, +LR=15.50, and -LR=0.08) (Figures 3-5).
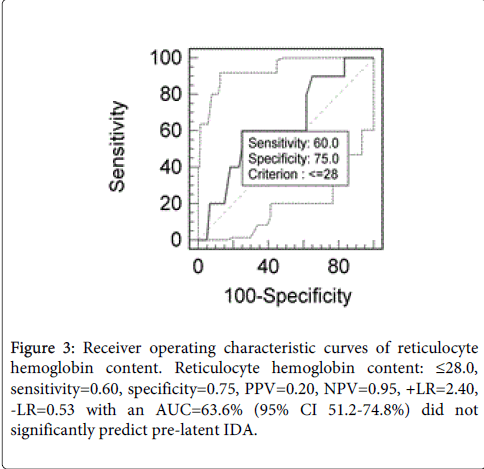
Figure 3: Receiver operating characteristic curves of reticulocyte hemoglobin content. Reticulocyte hemoglobin content: ≤28.0, sensitivity=0.60, specificity=0.75, PPV=0.20, NPV=0.95, +LR=2.40, -LR=0.53 with an AUC=63.6% (95% CI 51.2-74.8%) did not significantly predict pre-latent IDA.
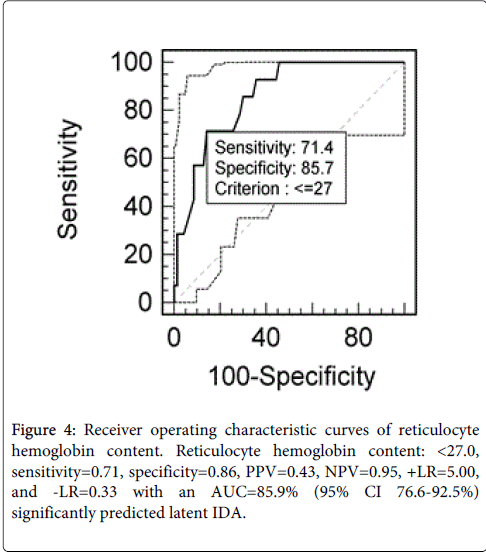
Figure 4: Receiver operating characteristic curves of reticulocyte hemoglobin content. Reticulocyte hemoglobin content: < 27.0, sensitivity=0.71, specificity=0.86, PPV=0.43, NPV=0.95, +LR=5.00, and -LR=0.33 with an AUC=85.9% (95% CI 76.6-92.5%) significantly predicted latent IDA.
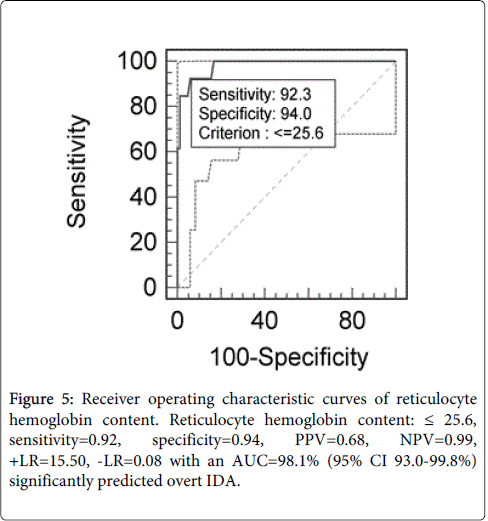
Figure 5: Receiver operating characteristic curves of reticulocyte hemoglobin content. Reticulocyte hemoglobin content: ≤ 25.6, sensitivity=0.92, specificity=0.94, PPV=0.68, NPV=0.99, +LR=15.50, -LR=0.08 with an AUC=98.1% (95% CI 93.0-99.8%) significantly predicted overt IDA.
Transferrin receptors
Transferrin receptors significantly predicted pre-latent IDA (AUC=83.6% (95% CI 72.8-91.4%), with a cutoff >0.48 sensitivity=0.70, specificity=0.98, PPV=0.87, NPV=0.95, +LR=42.00, and -LR=0.31), latent IDA (AUC=93.7% (95% CI 84.8-97.2%), with a cutoff >0.48, sensitivity=0.86, specificity=0.89, PPV=0.53, NPV=0.98, +LR=7.50, and -LR=0.16) and overt IDA (AUC=96.2% (95% CI 90.2-99.0%), with a cutoff >0.68, sensitivity=0.85, specificity=0.96, PPV=0.77, NPV=0.98, +LR=23.69, and -LR=0.16) (Figures 6-8).
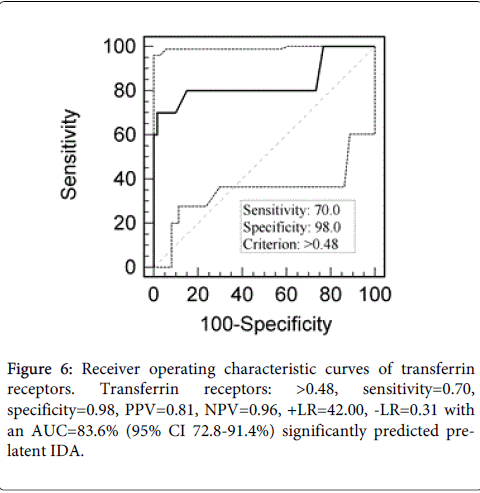
Figure 6: Receiver operating characteristic curves of transferrin receptors. Transferrin receptors: >0.48, sensitivity=0.70, specificity=0.98, PPV=0.81, NPV=0.96, +LR=42.00, -LR=0.31 with an AUC=83.6% (95% CI 72.8-91.4%) significantly predicted prelatent IDA.
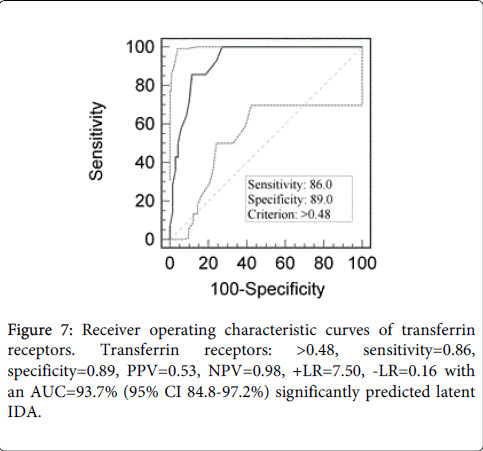
Figure 7: Receiver operating characteristic curves of transferrin receptors. Transferrin receptors: >0.48, sensitivity=0.86, specificity=0.89, PPV=0.53, NPV=0.98, +LR=7.50, -LR=0.16 with an AUC=93.7% (95% CI 84.8-97.2%) significantly predicted latent IDA.
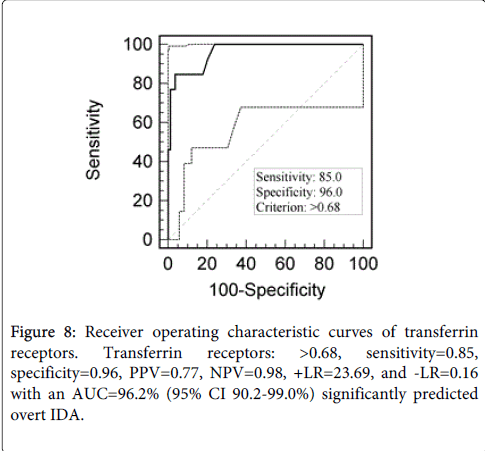
Figure 8: Receiver operating characteristic curves of transferrin receptors. Transferrin receptors: >0.68, sensitivity=0.85, specificity=0.96, PPV=0.77, NPV=0.98, +LR=23.69, and -LR=0.16 with an AUC=96.2% (95% CI 90.2-99.0%) significantly predicted overt IDA.
Red cell distribution width
Red cell distribution width significantly predicted pre-latent IDA (AUC=80.8% (95% CI 69.6-98.2%), with a cutoff >13.8 sensitivity=0.70, specificity=0.78, PPV=0.35, NPV=0.94, +LR=3.23, and -LR=0.38), latent IDA (AUC=93.4% (95% CI 86.8-100%), with a cutoff >13.8, sensitivity=0.93, specificity=0.78, PPV=0.39, NPV=0.98, +LR=3.25, and -LR=0.10) and overt IDA (AUC=97.4% (95% CI 91.1-99.6%), with a cutoff >16.8, sensitivity=0.85, specificity=1.00, PPV=1.00, NPV=0.98, and -LR=0.15) (Figures 9-11).
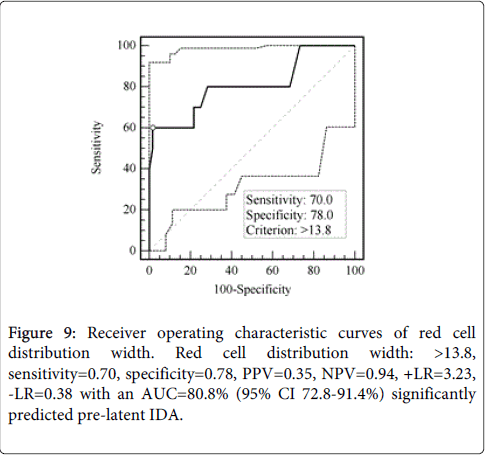
Figure 9: Receiver operating characteristic curves of red cell distribution width. Red cell distribution width: >13.8, sensitivity=0.70, specificity=0.78, PPV=0.35, NPV=0.94, +LR=3.23, -LR=0.38 with an AUC=80.8% (95% CI 72.8-91.4%) significantly predicted pre-latent IDA.
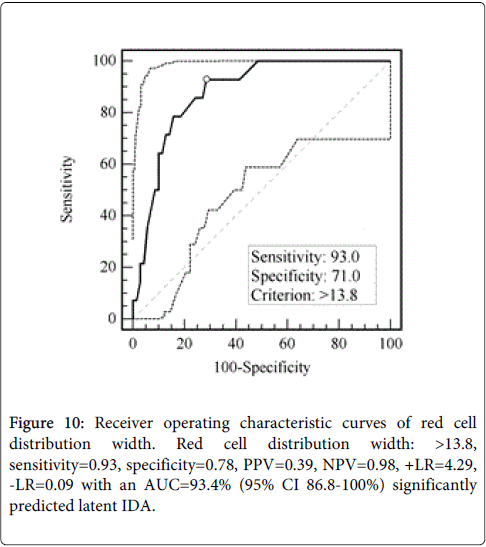
Figure 10: Receiver operating characteristic curves of red cell distribution width. Red cell distribution width: >13.8, sensitivity=0.93, specificity=0.78, PPV=0.39, NPV=0.98, +LR=4.29, -LR=0.09 with an AUC=93.4% (95% CI 86.8-100%) significantly predicted latent IDA.
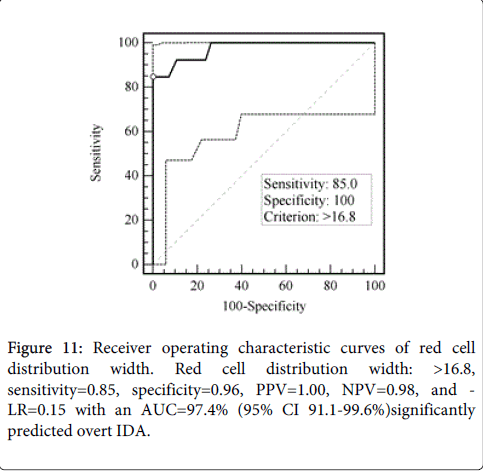
Figure 11: Receiver operating characteristic curves of red cell distribution width. Red cell distribution width: >16.8, sensitivity=0.85, specificity=0.96, PPV=1.00, NPV=0.98, and - LR=0.15 with an AUC=97.4% (95% CI 91.1-99.6%)significantly predicted overt IDA.
ROC curve comparison
We compared whether reticulocyte hemoglobin content is a better predictor of IDA status compared to transferrin receptors and red cell distribution width.
Transferrin receptors ROC curve was a better than reticulocyte hemoglobin content ROC curve and red cell distribution width in predicting pre-latent IDA (z=1.90, p=0.057; and z=2.20, p=0.028 respectively). In contrast, there was no significance difference between the three curves in predicting latent IDA (z=1.20, p=0.213; z=0.30, p=0.764 respectively) or overt IDA (z=1.20, p=0.229; z=0.38, p=0.705 respectively).
The present study reflects how technological evolution in automated haematology analyzers over the last 2 decades would help in the diagnosis of iron deficiency and iron deficiency anaemia, commonly seen in children and adolescents worldwide. Introduction of new physical principles for cellular analysis and the progressive evolution of software resulted in improvement in analytic efficiency and an increase in the information provided. Reticulocyte parameters provided by the Sysmex XE 2100, and previously on the Advia analyzer is one example. Our study further reinforced the value of RetHe in the diagnosis of both latent and overt iron deficiency. Traditionally, the diagnosis of iron deficiency relies on the hematological markers (hemoglobin, mean corpuscular volume (MCV), mean corpuscular hemoglobin (MCH), red cell distribution width (RDW) and biochemical markers (serum ferritin (SF), serum iron (SI), transferrin saturation (TS), total iron-binding capacity (TIBC) [11,12]. Our study shows that retHe is superior to this panel of tests in the detection of iron deficiency as early as its latent stage. This is in accordance with previous reports [13-16], which showed that determination of the reticulocyte hemoglobin content may allow real-time evaluation of iron deficiency and concluded that it is to be used as a marker of iron deficiency. Failure of RetHe to predict the prelatent stage of iron deficiency can be overcomed by a close look at the RDW CV % which is significantly increased compared to normal controls (p<0.0005). When there is insufficient iron for normal haemopoiesis, the circulation contains a mixture of normal cells and microcytes, so the RDW-CV% increases rapidly, well before the overall levels of MCV and Hb drop below the normal range. Few clinicians and public health workers know about this parameter in spite of the fact that extensive studies have pointed to its value as an early predictor of iron deficiency [17-19]. Patients at the prelatent stage are easily missed since they are usually asymptomatic and probably discovered by chance when their haemogram is done as part of a routine check up or as pre-operative investigation. Clinicians should be attracted to the increased RDW when all other parameters fall within the normal range since diagnosing iron deficiency at this very early stage can be rapidly corrected by short courses of iron supplementation while sparing the patients both the cost and the unwanted side effects of therapy. Short courses will also help patients’ adherence to therapy and thence a successful outcome.
Serum transferrin receptor (sTfR) originates mostly from erythroblasts and lesser from reticulocytes. The usefulness of sTfR has been implicated in several clinical situations, mainly as a marker of accelerated erythropoiesis or iron deficiency [20]. The assessment of sTfR may be useful in the period of rapid growth during infancy, childhood and adolescence. It has the advantage of being a valuable non-invasive tool for the diagnosis of iron depletion and an attractive supplement to more conventional laboratory tests in the detection of depleted iron stores [21]. Our data show that the level of sTfR receptors is a sensitive diagnostic tool of ID in school children as early as the prelatent stage. This in accordance with various studies which showed that circulating sTfR level was a sensitive indicator of iron depletion [22-28].
We demonstrated in the current study that RetHe and sTfR are as sensitive in the detection of both latent and overt IDA with sTfR being superior to RetHe in the prelatent stage. However, RetHe still retains the advantage of being measured as a by-product of routine haemogram at a little increment of cost within the same EDTA-blood sample with the result gained in less than an hour. Conversely, sTfR assay is run as separate test requiring specific reagents, another blood sample, and using a different analyzer with all its requirements.
A diagnostic approach based exclusively on hematologic parameters obtained by the complete blood cell count and the reticulocyte analysis is likely more appealing for both its direct assessment of iron metabolism and its potential cost-effectiveness. A significant reduction in the expense and the amount of blood needed for testing is an ideal combination especially when medical laboratories consider the best and newest specifications when procuring new analyzers. It is true that new technologies call for bigger budgets, however this can be neutralized when estimating cost-effectiveness and a multi-dimensional approach that involves at its very end the benefits of early diagnosis, shorter therapeutic courses and limited patients’ follow up both at the clinic and lab wise.
Early detection of iron deficiency is crucial to proper management and cost effectiveness. Care givers are aware of the unpleasant side effects of iron therapy which may interfere with patients’ adherence to therapy that will eventually lead to poor response, financial exhaustion and possibly late detrimental effect on physical and cognitive health especially in this group of fast growing school children and adolescents. Physicians have to abandon overuse of clinical labs by the proper use of all information available in the values of red cell indices. A single sensitive test may provide the same information obtained by an extensive panel.
The authors would like to thank the Qatar National Research Fund (QRNF) at Qatar Foundation for supporting this study through the Undergraduate Research Experience Program (UREP) (project ref. no. UREP 07-011-3-003). The study was approved by the Medical Research Center & Research Committee at Hamad Medical Corporation, Qatar.