Journal of Aeronautics & Aerospace Engineering
Open Access
ISSN: 2168-9792
ISSN: 2168-9792
Research Article - (2017) Volume 6, Issue 4
Pressure drag and aeroheating stirred by the shock wave is the main challenge of hypersonic flight, and blunt body is always the principle configuration at hypersonic flow regime for heat distribution, but it would induce substantial drag. Therefore, both aerospikes and aerodisks can be efficiently utilized as a mean for drag reduction. In this work, we investigate the effect of different geometric shapes of aerospikes with various disk gap widths on drag reduction. Accordingly, a series of numerical simulation work was implemented to find the behaviour as to hypersonic flow over aerospiked blunt bodies. Moreover, the drag reduction efficiency of spiked blunt bodies would be optimized via the Kriging method. For the models we studied, we found that the drag on the spiked blunt bodies is much lower than the spike off one. The drag reduction efficiency especially would be predominated by the scale of recirculation zone, which increases as both the spike length and the gap size of aerodisk increase. Hence, the performance of drag diminution will depend on the design parameters such as main body configurations, aerospike length, and tip geometric shapes.
<Keywords: Hypersonic; Blunt body; Aerospike; Aerodisk; Drag reduction; k-ω turbulence model; Kriging method
Hypersonic flow has some unique and important physical phenomena including thin shock layer, entropy layer, viscous interaction, high-temperature effect, and low-density effect [1]. These physical effects can happen to both hypersonic airplanes and re-entry vehicles. Furthermore, the compositions of atmospheres do dominant the complexity of gas chemistry and related chemical reactions (e.g., Venus: 96.5% CO2, Mars: 95.97% CO2, and Saturn: 96.3% H2) [2]. The reduction in wave drag and aerodynamic heating is the key part of the design of hypersonic bodies and the research on which began in the early 1940s. Since the blunt nose configurations are better for heat distribution, thus when the blunt hypersonic bodies re-enter into the atmospheres from outer space, the high levels of pressure drag and heat transfer will be excited on the vehicles, which is the feature of bluff bodies. Thereby the engineers must to investigate the methods to conquer these problems and there are mainly three types of drag reduction approaches that are used nowadays, including aerospike, counterflow, and energy deposition. It is the first aerospike approach that causes our interest in current work.
The aerospike also known as spike is originally used as “flow separation spike”, which is caused by the adverse pressure gradient in the boundary layer region near the aerospike. However, the effect of drag and heat transfer reduction depend on the flow conditions, blunt body shape, and spike geometry. In addition, the drag of the hypersonic body with aerospike can be reduced from 20 to 60 percent [3]. There are many studies as to the investigation of the reduction of drag and heat transfer in the blunt bodies, Crawford [4] measured the drag and heat transfer amounts of hypersonic hemisphere cylindrical bodies coupled with pointed spikes in laminar and turbulent flows at Mach number equals 6.8. Huebner et al. [5] studied the drag and heat transfer distributions on a hemisphere-capped cylinder in a turbulent hypersonic flow (M∞=6.06). In addition, Milicev and Pavlovic [6] investigated the aerodynamic performance of the spiked hemisphere cylindrical body. From the outcome, they found that the rounded tip aerospike is better in drag reduction than the pointed tip one. Later their consequences were duplicated numerically by Asif et al. [7]. Gnemmi et al. [8] proved that the flat aerodisk can produce the minimum drag, comparing with spherical and biconical disks under the same aerospike length. Besides, Konstantin and Federico [9] conducted the numerical simulations with respect to it. Kalimuthu et al. [10] conducted the experiment about drag reduction, using blunt bodies with hemispherical, flat and pointed aerodisks in hypersonic flow condition. Their results were also validated by Mehta [11]. About the same time, Ahmed and Qin [12] identified the influence of effect body on the drag reduction of hypersonic spiked bodies and found the design limits with respect to the minimum drag force.
Generally speaking, drag and heat transfer reduction depends on the shapes of the bodies such as aerospike length, shape, and aerospike nose configuration and the drag reduction approaches. Thus, aerospikes accompanied with aerodisks can be made allowances for the efficient drag reduction means, and is the focal point of current research. In this work, we would investigate the reduction of drag in different aerospike and aerodisk geometric configurations under certain hypersonic flow condition (i.e., P ∞=1951 Pa, T∞=58.25 K and M∞=6.06,) via the CFD simulations. In our numerical computation, we would utilize ANSYS Fluent software to implement the numerical simulations. To begin with, we would do the validation cases, which are examined in detail earlier by Roberto [13] and later by Schnepf [14]. Subsequently, different cases of this research work would be carried out. Furthermore, we also derive the optimised aerospike configuration via Kriging method.
Geometric configurations
In the validation cases, we coped with the hypersonic body flying at zero angle of attack, and thus we only need to consider one quarter of the geometric configuration in the flow domain in order to save the computational resources. The geometric configurations of validation cases are shown in Figure 1 and the detail of each dimension is shown in Table 1 [13].
| Variables | Values |
|---|---|
| DAerodisk | 0.02936 m |
| LAerodisk | 0.00734 m |
| αAerodisk | 53.496° |
| DSting | 0.00953 m |
| LSting | 0.29012 m |
| DSeeker | 0.07620 m |
| LCylinder | 0.00635 m |
| αShoulder | 0° |
| DMissile | 0.10160 m |
Table 1: The dimensions of validation cases.
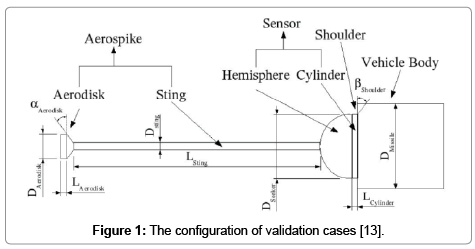
Figure 1: The configuration of validation cases [13].
In the numerical investigation work, the plain blunt body with a variety of both aerospikes and aerodisks was employed in the CFD simulation. The geometric configurations of spiked blunt bodies are based on the prototype as shown in Figure 2. Furthermore, the design parameters of the aerodisk are indicated in Figure 3 and the dimensions with respect to the prototype are shown in Table 2. In Figure 3 the areas within the blue lines represent the gaps in the aerodisk, and S1 represents the gap width. Since the blunt bodies fly horizontally, thus the model only needs to be analysed in one quarter domain in our computational practice.
| Variables | Values |
|---|---|
| D | 0.07620 m |
| d | 0.03048 m |
| L1/D | 1.5, 2.0, 2.5, 3.0, 3.5, 4.0 |
| L2 | 0.01048 m |
| S1/L2 | 0, 0.2, 0.4, 0.6 |
| S2min | 0.002095 m |
| θ | 15° |
Table 2: The dimensions of investigation cases.
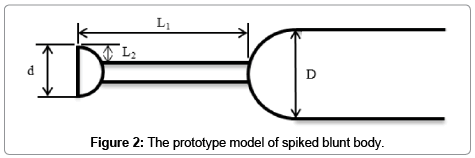
Figure 2: The prototype model of spiked blunt body.
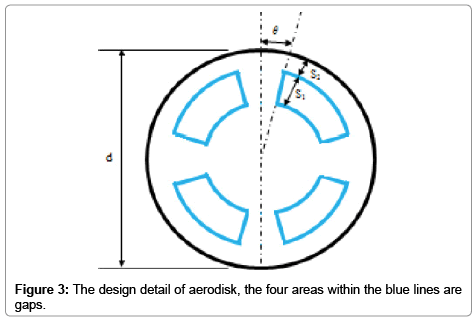
Figure 3: The design detail of aerodisk, the four areas within the blue lines are gaps.
Governing equations
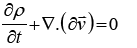
In this work, the governing equations we used are the equations of continuity and the full set of Navier-Stokes equations, which are subject to the conservation laws of mass, momentum and energy, respectively, as shown in Equations 1, 2 and 3.
 (1)
(1)
 (2)
(2)
 (3)
(3)
 (4)
(4)
 (5)
(5)
In continuity equation, ρ and  denote density and velocity, respectively. In Equation 2, the third term (p) and the fourth term (
 ) are static pressure and stress tensor, respectively. The energy equation of compressible flow is shown in Equation 3, since the flow regime we concerned is hypersonic (i.e., M∞>5), hence we use the energy equation to deal with the heat transfer calculation. The first two terms on the right-hand side of Equation 3, which are heat transfer owing to heat conduction and dispersion of viscosity, respectively. indicates the total energy and the detail of which is shown in Equation 4, where h denotes specific enthalpy. The effective thermal conductivity (Keff) is defined in Equation 5, where K is thermal conductivity and Kt is the turbulent thermal conductivity.
Numerical modeling
The computation work was executed via ANSYS Fluent CFD code, due to the flow regime we cope with correspond to the hypersonic flow, thus we utilize the shear-stress transport (SST) k-ω model in both the validation cases and the investigation cases, which is a blending two equation model contains the standard k-ω model near the wall and the high-Reynolds-number version of k-ε model outside the boundary layer; this method is developed by Menter [15] for engineering simulation, where k indicates the turbulence kinetic energy and ω indicates the specific dissipation rate. All the above quantities are derived from the following transport Equations 6 and 7:
 (6)
(6)
 (7)
(7)
where Gk indicates the generation of turbulence kinetic energy caused by mean velocity gradients Gω represents the generation of specific dissipation rate ω. Γk and Γω denote the effective diffusivity of k and ω, respectively. Yk and Yω indicates the dissipation of k and ω due to turbulence, respectively. Dω indicates the cross-diffusion term. Also, we treat the gas as the ideal gas and the viscosity is set by the Sutherland law.
Furthermore, due to the flow patterns we studied is the hypersonic flow in steady state, so the implicit scheme and Advection Upstream Splitting Method (AUSM) would be used. Secondly, since the flow type is hypersonic such that the density-based solver is used. Also, in the spatial discretization, we use the Green-Gauss node based in gradient, second order upwind method in flow, turbulent kinetic energy, and specific dissipation rate. Furthermore, all of the criteria of convergence are set as 10-4, apart from energy one which set as 10-6.
In the validation cases we set the following parameters via Fluent. In the flow domain, first the gauge pressure and operating pressure are set as 1951 Pa and 0 Pa, respectively. Second, the free stream is hypersonic flow with M∞=6.06 and the temperature of free stream is equal to 58.25 K, the above settings is duplicated from the experiment executed by Huebner et al. [5]. Last, the boundary condition of the body and spike walls is assumed as adiabatic. The following is the setting of Fluent boundary conditions. To begin with, the pressure far field is manipulated for flow domain. Secondly, the symmetry wall and the wall conditions are employed for the symmetry planes and both the main body and spike, respectively, as shown in Figure 4.
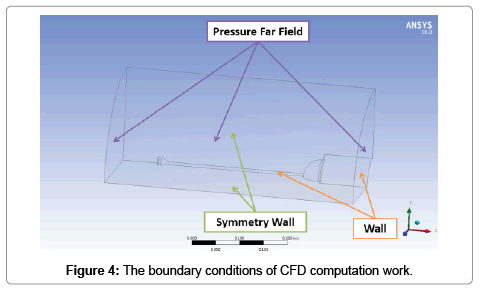
Figure 4: The boundary conditions of CFD computation work.
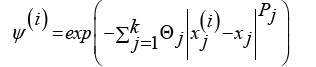
The Kriging method, a kind of surrogate-based optimization scheme, and have used quite efficiently in recent aerodynamic design arena [16,17]. In this work it was utilized to predict the drag coefficient of unknown spiked blunt body by an archive of configuration design parameters and drag coefficients. The basis function of Kriging method is shown in Equation 8, in this case, x denotes the L1/D (i.e., sample data) and y denotes the total drag coefficients (i.e., observed responses). In this prediction, θ and p would be set as 0.425 and 2, respectively.
 (8)
(8)
The Kriging prediction function is demonstrated as Equation 9.
 (9)
(9)
Where
 (10)
(10)
Accuracy of the Kriging model is depending on the numbers of the sample data. As our experience show: if the sample points are enough, then we can find more accurate Kriging model [17]. As in the same single objective case, multi-objective must find the sample points first, and then use Kriging model to find the maximum or minimum values.
Validation cases
We validated the numerical results of aerospike off and aerospike on cases and compared with the outcome from Roberto [13] and Konstantin and Federico [8] as well as the experimental results from Huebner et al. [5]. For understanding and comparing the phenomena behind the aerospike-assisted hypersonic bodies, we would do the computation work of the aerospike off and on validation cases. The first validation case is the spike off blunt body at 0-degree angle of attack. Besides, the static pressure, the static temperature, and the Mach number of free stream are defined as 1951 Pa, 58.25 K, and 6.06, respectively.
The normalized pressure distribution along the body arc-length (s) is shown in Figure 5. From this Figure, we could find the three types of meshes, Mesh 1, Mesh 2 and Mesh 3, are predominated by the number of mesh elements and the quality of mesh. Moreover, we could find the overall pressure distributions in our results (FLUENT CFD SST k-ω), other numerical simulation results, and the experimental data correspond quite well. Most important, the pressure curves are smooth decrease from the nose portion tip, or stagnation point, Besides, our results generally agree with the CFD results of Roberto [13] such as the static pressure would undershoot to P/P∞=10 at S=1.8 in, and both the pressure and temperature would be aroused near S=2.38 by the shock ahead of the collar induced separation region as shown in Figures 5 and 6, respectively [5], and caused the flow separation.
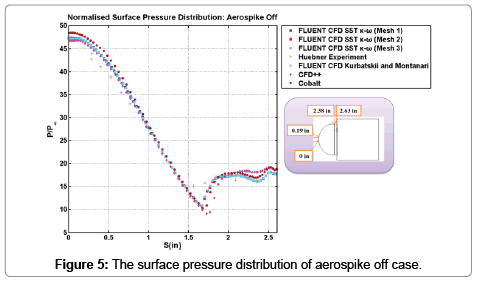
Figure 5: The surface pressure distribution of aerospike off case.
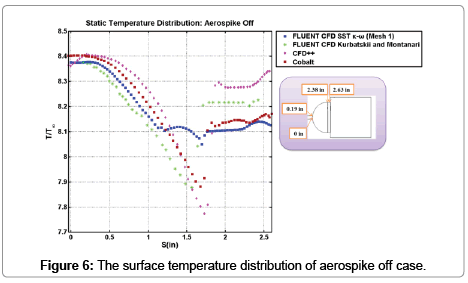
Figure 6: The surface temperature distribution of aerospike off case.
Accordingly, we could find the pressure distributions of these three mesh types are similar and the mesh elements of each type are as follows: 3,163,445 for Mesh 1, 3,375,330 for Mesh 2, and 3,423,321 for Mesh 3. Since the computation ability and time cost, so the meshing scheme of least mesh elements (i.e., Mesh 1) would be chosen to implement the computation work. In addition, the temperature is agreed with the CFD results, apart from which locates in the vicinity of S=1.25–1.75 in, it is perhaps induced by computation schemes (e.g., turbulence model) and wall Y plus [13].
The second validation case is the blunt body equipped with a spike at 0-degree angle of attack. The normalized pressure distribution along the body arc-length is shown in Figure 7 and the pressure contours is shown in Figure 8. For the sake of case validation, there are also three mesh types to work on the CFD simulation. The differences between them are the number of mesh elements and the quality of mesh, the cell element numbers of mesh 1, mesh 2 and mesh 3 are 3,158,309, 3,300,467 and 3,519,250, respectively. From Figure 7, we could find overall pressure distributions of our results (FLUENT SST k-ω) are quite agreed with other simulation results (CFD++), and the experimental result. However, our results of the boundary separation location along the spike are same as which of CFD++ Case 2 and Huebner experiment. Moreover, different turbulence parameters and models give rise to different results of pressure and temperature distributions.
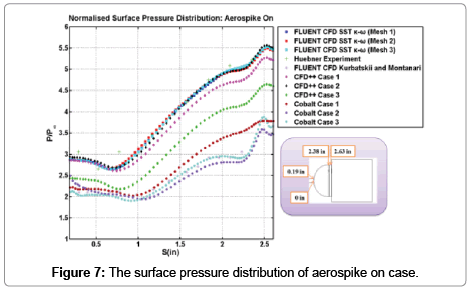
Figure 7: The surface pressure distribution of aerospike on case.
From Figure 8, we could find the static temperature along the body arc-length and the temperature contour, respectively, and the overall values of temperature ratio (T/T∞) almost hover near 8.0 along the arclength. Besides, the temperature distribution is almost agreed with the validation. In addition, the temperature is agreed with the CFD results due to the wall Y plus of our result is quite fine (i.e., Y plus<5 × 10⁻⁴). It is important to note that the recompression oblique shock would interact with the weak expansion waves emanating from the boundary layer near the aerospike. Consequently, the recompression oblique shock and shear layer could blend mutually and stir the reattachment shock wave near the hemispherical body. In addition, for the accurate temperature and pressure distributions along the body surface, a finer Y plus is needed [13].
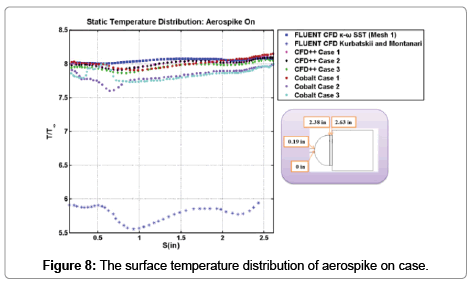
Figure 8: The surface temperature distribution of aerospike on case.
Blunt body without aerospike
When a flow moves at an extremely high speed (i.e., hypersonic speed), then which would contribute a substantial heat transfer and wave drag to the bodies, since the bow shock induced ahead of the blunt bodies could bring about the kinetic energy loss of the flow and an abrupt deceleration. In the drag analysis, we define the drag consists of pressure drag and viscous drag (i.e., friction drag) in the hypersonic flow regime. The characteristic length and area of both blunt bodies with and without aerospikes are 0.0762 m and 0.004560367 m2, respectively. It is interesting to note that for our hypersonic speed the total drag is mainly dominated by the pressure drag, which accounts for approximately 99.2%; however, the viscous drag is the minor part for the drag force, that is, the pressure drag is the predominant role to rule the drag force as shown in Table 3.
| Values | Pressure | Viscous | Total |
|---|---|---|---|
| Forces (n) | 49.791158 | 0.394448 | 50.185606 |
| Coefficients | 0.217852 | 0.001726 | 0.219578 |
Table 3: The values of pressure and viscous forces and related coefficients.
From the pressure contours of spike-off blunted body as shown in Figure 9, we could find the strong bow shock was aroused near the nose part of the blunt body, and flow speed would tremendously decrease when hypersonic flow passes through the bow shock, thus the highest pressure occurs at the stagnation point due to the speed of the flow at this point is equal to zero, and all kinetic energy would be changed into the internal energy of gas that is demonstrated by Figure 10. The analytic solution of stagnation pressure at the nose tip is 93311.5399 Pa, thus the ratio of which to the freestream pressure is equal to 47.8275 that is quite close to the result obtained by the numerical simulation (i.e., P/P∞=47.7373).
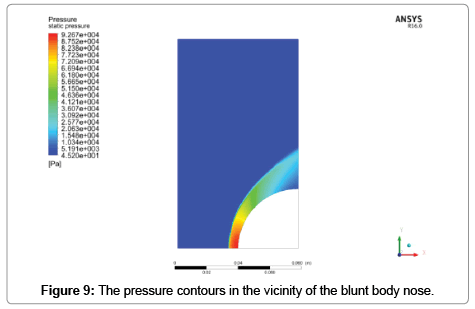
Figure 9: The pressure contours in the vicinity of the blunt body nose.
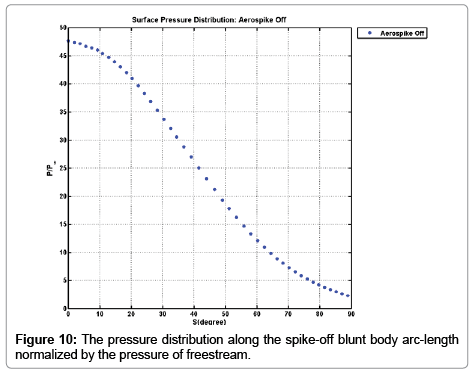
Figure 10: The pressure distribution along the spike-off blunt body arc-length normalized by the pressure of freestream.
Blunt bodies with aerospikes
The design parameters of the spiked blunt body configurations are twofold. First, the aerospikes would vary with different length-tomain- body-diameter ratios (i.e., L1/D=1.5–4.0). Second, several gapsize- to-disk-length ratios (S1/L2) for the gaps amongst the aerodisks would range from 0 up to 0.6. The total drag coefficient and related two components are shown in Figure 11. We found the total drag of same L1/D would decrease as the S1/L2 increase, in addition, the difference between the drag coefficients of two different spike length sizes would diminish on account of the effect of increasing the spike length on drag reduction is fallen gradually, which are shown in Figure 11a. Besides, the pressure drag coefficients are shown in Figure 11b, which demonstrates the total drag force is most occupied by pressure drag force, and it is obviously that the total drag coefficient distributions with different spike configurations correspond to the distributions of pressure drag coefficients. However, the viscous drag with respect to these models is sophisticated and fluctuation would take place (i.e., S1/L2=0.2–0.4) perhaps due to the gaps excavated in the aerodisks as shown in Figure 11c and which is relatively small in value compare to pressure drag.
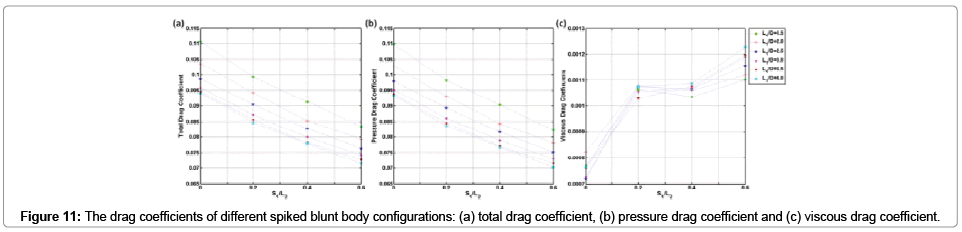
Figure 11: The drag coefficients of different spiked blunt body configurations: (a) total drag coefficient, (b) pressure drag coefficient and (c) viscous drag coefficient.
The drag reduction would be generated by the introduction of recirculation area as shown in Figures 12a-12f, and the scale of which can predominate the extent of drag reduction. The recirculation zone accompanied with low pressure and temperature levels, which enclosed by the shear layer emanating from the separation point to the reattachment point, would cover most of the main body surface result in the reduction of drag and heat transfer would be accomplished same as depicted by Ahmed and Qin [12], which is illustrated in Figures 13a-13f. This is because the adverse pressure gradient adjacent to the main body as well as the friction on aerospike surface would make the boundary layer detach from spike surface at a distance ahead of the main body surface.
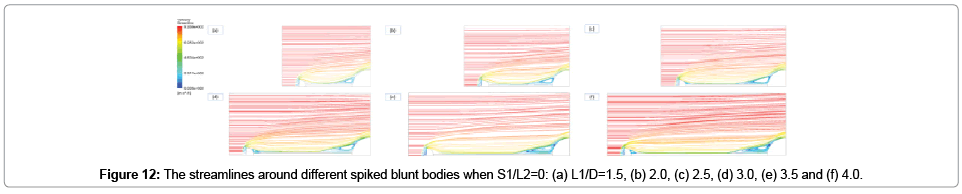
Figure 12: The streamlines around different spiked blunt bodies when S1/L2=0: (a) L1/D=1.5, (b) 2.0, (c) 2.5, (d) 3.0, (e) 3.5 and (f) 4.0.
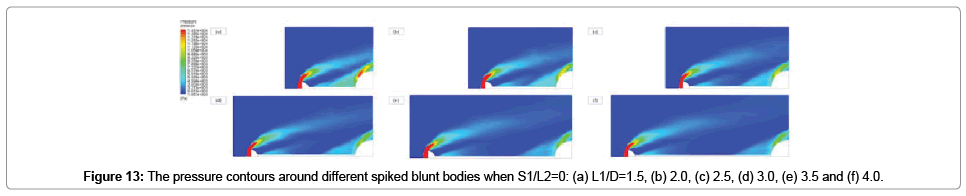
Figure 13: The pressure contours around different spiked blunt bodies when S1/L2=0: (a) L1/D=1.5, (b) 2.0, (c) 2.5, (d) 3.0, (e) 3.5 and (f) 4.0.
It is very interesting to note that the longer spike length could lead to the flow separation point away from the main body surface and most importantly, both the compression wave (Figure 14) and the flow recirculation zones enlarge as the aerospike length increases, thus the larger portion of the main body surface would be cloaked by them, consequently, the total drag of longer spiked blunt body would be lower than which of previous relatively shorter one. Figures 14a-14d shows that the pressure drops at the beginning and reaches the minimum value at the degree of the main body surface from approximately 17° to 20° for S1/L2=0–0.6, respectively. This phenomenon attributes to the interaction between main body and spike root; the local lowest pressure would be induced in this area as shown in Figure 13. Subsequently, the pressure would increase to peak value and then plunge, which are stirred by the compression and expansion waves in the vicinity of main body, and furthermore, the peak pressure would lower by the length of aerospike grows.
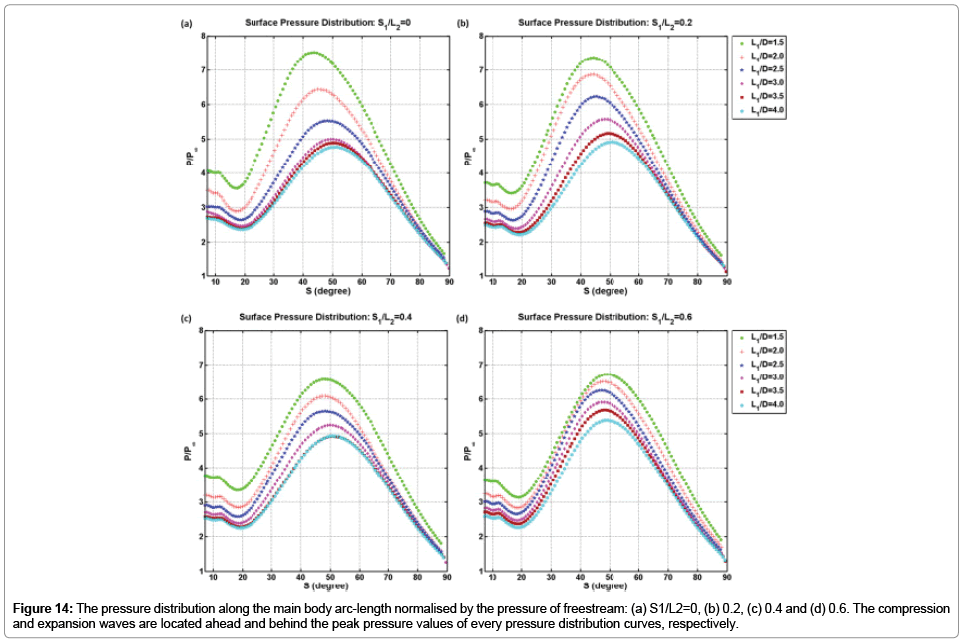
Figure 14: The pressure distribution along the main body arc-length normalised by the pressure of freestream: (a) S1/L2=0, (b) 0.2, (c) 0.4 and (d) 0.6. The compression and expansion waves are located ahead and behind the peak pressure values of every pressure distribution curves, respectively.
In addition, as shown in Figure 14d, the compression area decreases as L1/D increases (i.e., from L1/D=2.0 to 2.5), and the reattachment point could be slightly shifted upstream for maintaining the stability of the dividing streamline. Since when the flow field at equilibrium state, the pressure field in the reattachment zone would affect the touch point of reattachment with the aim of assuring the steady state would be obtained.
With the purpose of reducing the pressure drag in different gap widths, the aerodisks with varying dimensions of gap would be fixed atop the aerospikes of the hypersonic blunt bodies would be also another crucial design point. The chief capability of aerospike coupled with aerodisks is to give rise to the separation flow and reduce drag force via dispersing the strong shock wave into much weaker shock wave.
The total drag coefficient and two drag components are indicated in Figure 15. We found the total drag coefficients of same S1/L2 would plunge as the L1/D rise same as the trend of spiked blunt bodies with different aerospike lengths. Furthermore, the difference between the drag coefficients of two different gap sizes would decay due to increase of the spike length on drag reduction is fallen step by step are shown in Figure 15a. From Figures 15b and 15c, we found that the pressure drag predominates the total drag for all blunt bodies, whereas the viscous drag concerning these models climb bit by bit as the spike length increase, apart from the value for S1/L2= 0 and 0.2 for L1/D=2–2.5 and L1/D=2–3.5, respectively. Thus, the viscous drag is mainly controlled by the gap size. It is interesting to note that the viscous drag would decrease, when the aerodisk without gap and the diameter of disk increases [12], thus this phenomenon is completely opposite to blunt body with gapped aerodisk. Consequently, the viscous drag is indeed much smaller than the pressure.
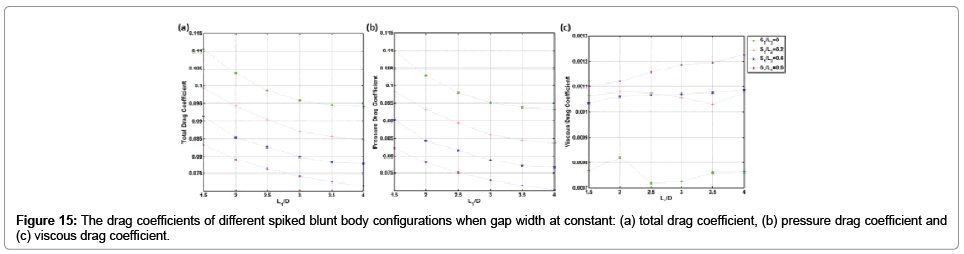
Figure 15: The drag coefficients of different spiked blunt body configurations when gap width at constant: (a) total drag coefficient, (b) pressure drag coefficient and (c) viscous drag coefficient.
The drag reduction of spiked blunt body with different disk parameters is induced by flow recirculation region as well, which is shown in Figure 16 and the level of which can dominate the amount of drag reduction. From Figures 16a-16d, we could find that the recirculation zone for same spike length would increase as the gap width increases. Hence, the flow recirculation in the vicinity of main body for the spiked blunt body with S1/L2=0 would be the smallest one relative to same spike length but bigger gap width ones. The implication is same as the higher the disk diameter, the bigger the recirculation screening on the main body surface; consequently, the pressure drag would be reduced [12]. As shown in Figures 17a-17d, when the gap width broadens, the adverse pressure gradient around the main body would be enhanced. Besides, the flow emits from the gap would affect the location of separation point and alter the separate shock wave and result in the intensity of peak pressure as shown in Figure 14.
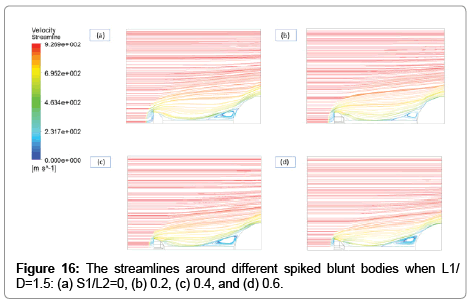
Figure 16: The streamlines around different spiked blunt bodies when L1/ D=1.5: (a) S1/L2=0, (b) 0.2, (c) 0.4, and (d) 0.6.
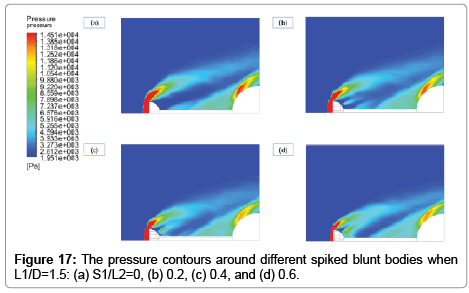
Figure 17: The pressure contours around different spiked blunt bodies when L1/D=1.5: (a) S1/L2=0, (b) 0.2, (c) 0.4, and (d) 0.6.
Optimization case
For the sake of design, we would like to acquire the total drag coefficient of spike blunt body with L1/D=5 and S1/L2=0.6, thus we can make use of the matrices X and Y from the length-to-main-bodydiameter ratio (L1/D) and total drag coefficient (CD), respectively. From the results, we obtained the total drag coefficient of the prediction model is 0.06954 and the error relative to the CFD simulation one is 0.008629% as show in Figure 18 and the drag reduction efficiency is up to 68.4%, that is, the performance of which is better than the spiked blunt body with L1/D=4 and same gap dimension because the recirculation zone for L1/D=5 is larger than which for L1/D=4. Since the estimated value gained by Kriging method is much closer to simulated one, thereby Kriging method is indeed a reliable and practical optimization approach.
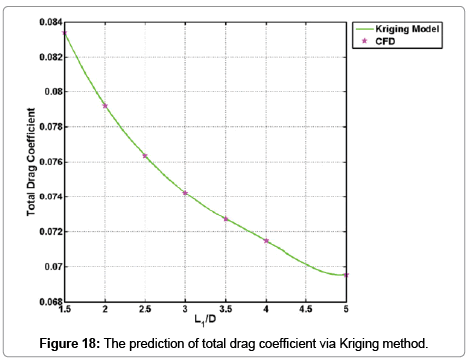
Figure 18: The prediction of total drag coefficient via Kriging method.
Thereby, we could identify that the numerical simulation results agree with the validation cases very well and something interesting that happened to the pressure and temperature distributions. For spike off, the total drag is much higher than spike on case as a result of the presence of strong bow shock. In addition, the temperature distribution of spike off is much higher than spike on one. On the other hand, an innovative gap on the aerodisk was proposed in this research and from the outcome, we argued that the minimum drag comes about at the max gap (i.e., S1/L2=0.6) under same aerospike length. Besides, the mechanism of drag reduction can be predominated by effective body and the effect of recirculation. More importantly, the efficiency of drag reduction would decrease as the sizes of spike and gap increase.
From the results obtained, we found the drag could be influenced by the flow patterns including strong bow shock waves, expansion fans, shear layers, flow separation, recirculation regions, compression wave, etc. The bow shock (i.e., conical shock or foreshock) emits from the aerospike and covers the whole hemispherical body. The separation point along the aerospike will influence the pressure and temperature distributions along the main body surface, which counts on the turbulence model and related parameter settings. In terms of the drag components, the pressure drag is the predominant role in both the aerodisk and the blunt main body; however, the viscous drag would be the minor part in the total drag of all spiked blunt bodies. For models with same spike length, then the broader the gap width, the less the total drag.
In this work, we found that the maximum drag reduction for same spike length would be found at widest gap. Thereby, the drag reduction performance attained by both the aerospike and aerodisk would rely on the trade-off between the spike length and the gap width.