Research - (2022)Volume 7, Issue 4
In order to compare the gene mutation profiles of patients with or without a KRAS mutation, the clinicopathological data of 858 patients and NGS test results of 1697 patients with colorectal cancer were used in this analysis. In 858 patients, only 2 out of 349 (0.5%) KRAS mutant patients had a BRAF mutation, while 25 out of 422 (5.9%) KRAS wild-type patients had a BRAF mutation (p<0.0001). The NGS results showed that in RAS mutant patients, genes with a high mutation rate mainly included APC, TP53, PIK3CA, Smad4, and Fbxw7, and in RAS wild-type patients, genes with a high mutation rate mainly included TP53, APC, LRP1B, MYC, and BRAF. The mutation rates of BRAF and EGFR in the RAS wild-type group were 15% and 9%, respectively, while they were only 3% in the RAS mutant group. The mutation rate of PIK3CA in the RAS mutant group was 31%, while that in the RAS wild-type group was 14%. The mutation rate of APC was 72.2% (i.e., 687/952). The mutation rate of the gene, RNF43, in the APC wild-type group was 5.23 times higher than that in the APC mutant group, and the gene, NSD1, in the APC wild-type group was 0.07 times higher than that in the APC mutant group. The mutation rate of TP53 was 78.2% (i.e., 744/952). The mutation rate of MLH1 in the TP53 wild-type group was 8.42 times higher than that in the TP53 mutant group, which was significantly higher than that in the TP53 mutant group. Generally, the gene mutation profiles were significantly different between KRAS mutation and wild-type colorectal cancer patients. A single gene mutation may be sufficient to cause the dysfunction of a signal transduction pathway, and APC, TP53, or RAS are not necessary for the carcinogenesis of sporadic colorectal cancer.
Colon cancer; KRAS mutation; Patients; Chemotherapy
The incidence of Colorectal Cancer (CRC) in China is rising despite significant advances in its diagnosis and management. According to the National Cancer Center of China, it is the fifth most common cancer and the leading cause of cancer-related deaths in China [1]. Cancer development is commonly regarded as a multistep process involving an initial mutagenic event called tumor initiation. In colorectal cancer, the adenoma-carcinoma sequence is regarded as a classic model of sporadic colon cancer [2]. In this process, many signal transduction pathways are involved such as Mitogen-Activated Protein Kinase (MAPK), Wnt/β-catenin signaling cascade, and apoptosis signaling cascade [3]. APC gene mutation was found to be the initiating event in the classic adenoma-carcinoma sequence [4]. In cells harboring a mutated APC gene, due to the absence of the inhibitory effect exerted by Wnt signaling, β-catenin accumulates, and after its translocation in the nucleus, acts as a co-activator of T-Cell Factor (TCF)-Lymphocyte Enhancer Factor (LEF). The β-catenin/TCF-LEF complex acts, in turn, as a transcriptional activator of the key cell cycle regulatory genes, cyclin D1 and c-Myc, to promote tumor genesis [5]. In this model, APC suppression determines the formation of adenomas in the colon (i.e., intestine); then, in the presence of additional mutations, such as in the TP53 and KRAS genes, these tumors are induced to progress into colon cancers [6-8].
In 1987, using a combination of DNA hybridization analyses and tissue sectioning techniques, researchers demonstrated that RAS gene mutations occurred in over one-third of human colorectal cancers and that the mutations usually preceded the development of malignancy [9]. Subsequent studies further proved that the prevalence of KRAS mutations ranged from 25% to 52%, and these mutations were typically located at codons 12 and 13 in exon 2 of the coding region of the KRAS gene [10]. Single base substitutions in codons 12 and 13 affect glycine residues in the GTP-binding pocket critical for GTPase function; thus, these KRAS mutations lead to stabilization of protein in their prolonged active state, thereby amplifying the downstream signaling pathways [11]. The main downstream signaling pathways are the MAPK and AKT pathways, which allow tumor cells to proliferate in the absence of growth factors and increase their survival [12]. In addition, KRAS can stimulate Wnt signaling through inhibition of GSK-3beta, regulate vascular endothelial growth factor (VEGF) gene expression, and promote tumor progression by cooperating with Wnt signaling [13].
KRAS not only plays a key role in the occurrence and development of colorectal cancer, but it also affects the treatment of colorectal cancer. KRAS gene mutations are important predictors of response to cetuximab or panitumumab therapy in patients with colorectal cancer [14-17]. Patients bearing a mutated KRAS cannot benefit from cetuximab or panitumumab, whereas patients with wild-type KRAS can benefit from these drugs [18,19]. Meanwhile, some studies reported that KRAS mutation was a negative prognostic factor for Overall (OS) and Recurrence Free Survival (RFS) [20].
It is obvious that KRAS plays an important role in the carcinogenesis of colorectal epithelial cells and the treatment of patients with colorectal cancer; however, KRAS mutations are only present, at most, in approximately 50% of patients. In other words, approximately 50% of patients have the wild type. It can be speculated that patients with mutant or wild-type KRAS may have different gene mutation spectrums and, thus, show different biological characteristics. Therefore, comparing the gene mutation profiles of patients with or without a KRAS mutation may help researchers better understands the occurrence, development, and treatment of colorectal cancer.
Patients’ data
Two data sets of patients with colorectal cancer were included in this study. The first data set consisted of the clinical and pathological data of 858 patients from the Affiliated Hospital of Jiangnan University, and the second data set was composed of the NGS tests of 1697 patients from the Data Bank of the GENE+ Company (Beijing, China).
Data set 1
From May 2012 to December 2015, 858 colorectal cancer patients underwent colorectal resection of their primary cancer at the Affiliated Hospital of Jiangnan University (Jiangsu Province, China). The medical records of these colorectal cancer patients were carefully reviewed. The following data were collected retrospectively: age, sex, stage, site, and gene mutation status (KRAS, B-raf, Her-2, Ki-67, and MMR). Mutational analyses on KRAS and BRAF were performed using genomic DNA extracted from microdisected tumor tissue with the DNA Mini Kit (Qiagen), and gene mutation status was analyzed using the ADx-ARMSTM mutation test kit (Xiamen). The KRAS mutation status was analyzed using the Human KRASGene 7 Mutations Fluorescence Polymerase Chain Reaction (PCR) Diagnostic Kit (ADx-ARMSTM); testing for the BRAFV600E hotspot mutation in exon 15 was performed using the Human BRAF (V006E) Gene Mutations Fluorescence Polymerase Chain Reaction (PCR) Diagnostic Kit (ADx-ARMSTM). The expression of MMR (MLH1, PMS2, MSH2, and MSH6), Her-2, and KI-67 were analyzed by immunohistochemistry according to routine methods. These analyses involved an initial hematoxylin and eosin slide review by a pathologist to confirm the diagnosis, delineate the percentage of tumor present, and demarcate tumor from normal tissue. Specimens were required to contain at least 50% tumor within the sample.
Data set 2
A total of 1697 patients with colorectal cancer were enrolled in this analysis. There were 798 cases with wild-type RAS and 899 cases with a mutant RAS (i.e., KRAS: 864 and NRAS: 35). Six hundred and thirty-seven patients underwent chemotherapy, 952 patients did not accept chemotherapy, and 108 patients’ treatment histories were unknown. Details on the methods of DNA extraction and quality control, target capture and next-generation sequencing, and sequencing data analysis can be found in Reference [21]. Briefly, based on second-generation sequencing technology, four types of mutations (including point mutation, small fragment insertion or deletion, copy number variation, and currently known fusion genes) of 1021 genes related to tumor genesis and development were detected. Among them, all exon regions of 312 genes, introns, primers and fusion regions of 38 genes, and partial exon regions of 709 genes were detected.
Statistical analysis
The chi-square test was used to investigate the relationships between KRAS mutation status and other clinicopathological factors. To estimate the effect of KRASon overall survival, Kaplan-Meier curves were plotted and compared using the log-rank test. All reported p-values were two-sided, and p<0.05 was considered statistically significant.
Clinical characteristics
In 858 patients in the first data set, 436 patients had a mutant KRAS and 422 patients had wild-type KRAS. The mutation rate of KRAS was 50.8% (i.e., 436/858). Of the 858 patients, a total of 771 patients were tested for BRAF. Among them, only 2 out of 349 (0.5%) KRAS mutant patients had a BRAF mutation, while 25 out of 422 (5.9%) KRAS wild-type patients had a BRAF mutation. The difference between them was highly statistically significant (p<0.0001). In addition, 432 patients were tested for NRAS. Among them, 5 out of 196 (2.6%) KRAS mutant patients had a NRAS mutation, while 18 out of 236 KRAS wild-type patients had a NRAS mutation. The difference between them was statistically significant (p=0.0193). With the exception of BRAF and NRAS, there were no differences in the mutation rate of KRAS in patients with different clinicopathological characteristics (Table 1).
| Number of patients | P-value | ||
|---|---|---|---|
| KRAS (mutation) | KRAS (wild type) | ||
| Gender | 0.8448 | ||
| male | 245 | 256 | |
| female | 177 | 180 | |
| Year | 0.2893 | ||
| <60 | 139 | 129 | |
| >=60 | 283 | 307 | |
| Stage | 0.1535 | ||
| I | 58 | 59 | |
| II | 172 | 148 | |
| III | 143 | 164 | |
| IV | 49 | 65 | |
| Site | 0.8845 | ||
| Right colon | 118 | 95 | |
| Left colon | 361 | 284 | |
| NRAS a | 0.0193 | ||
| wild | 191 | 218 | |
| mutation | 5 | 18 | |
| BRAF(V600E) | <0.0001 b | ||
| wild | 347 | 397 | |
| mutation | 2 | 25 | |
| MMR | 0.8983 | ||
| dMMR | 40 | 52 | |
| PMMR | 159 | 213 | |
| Her-2 | 0.8132 | ||
| Negative (-, +) | 90 | 123 | |
| Positive (++, +++) | 95 | 124 | |
| Ki-67(%) | 0.2262 | ||
| <=60 | 24 | 42 | |
| > 60 | 176 | 221 | |
Note: a: NRAS, BRAF, HER-2, dMMR, and Ki-67 were not tested in all 858 patients, so the analysis was done only in patients who received test. b: Fisher test.
Median overall survival (OS) of patients with or without a KRAS mutation
Patients were treated according to NCCN guidelines. In short, patients in stage I were mainly treated with surgery alone; patients in stage II and III were treated with capecitabine monotherapy, 5-Fu/LV, or a FOLFOX regimen according to their tumor stage, risk classification and MSI status after surgery; patients in stage IV were treated with a FOLFOX/FOLFIRI+/- Bevacizumab or Cetuximab regimen (left colon, RAS and BRAF wild type). The deadline for follow up was September 30, 2019, and the median follow-up time was 38.6 months for all 858 patients. Seventy-seven patients were lost to follow up. The median OS of 436 patients with a mutant KRAS (56 patients lost to follow up) was 83.47 months, and the median OS of 422 patients with wild-type KRAS (21 patients lost to follow up) was not reached. The hazard ratio (log-rank) was 0.8147 (95% CI: 0.6271-1.051; p=0.1153) (Figure 1).
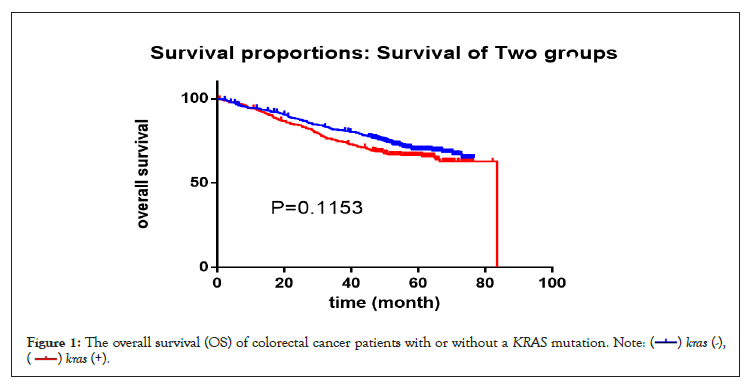
Figure 1: The overall survival (OS) of colorectal cancer patients with or without a KRAS mutation.

Differences in the gene mutation profiles of patients with or without an RAS mutation by NGS test
To rule out the effects of chemotherapy on gene mutation, we only compared the gene mutation profiles of patients who had not received chemotherapy. A total of 952 patients did not receive chemotherapy at the time of the NGS test, of which 487 had wild-type RAS and 465 had a mutant. The RAS mutation rate was 48.8% (i.e., 465/952). In RAS mutant patients, genes with a high mutation rate mainly included APC, TP53, PIK3CA, Smad4, and Fbxw7 (Table 2 and Figure 2). In RAS wild-type patients, genes with a high mutation rate mainly included TP53, APC, LRP1B, Myc, and BRAF (Table 2 and Figure 3). Comparing the mutation rate of genes between RAS mutation and wild-type patients, there were 40 genes with different mutation rates (defined as a difference in the mutation rate between the two groups greater than 1%) (Table 3 and Figure 4). There was no difference in the mutation rate of APC between the two groups, but genes, such as BRAF, EGFR, PIK3CA, SOX9, and SMAD4, were significantly different between the two groups. The mutation rates of BRAF and EGFR in the RAS wild-type group were 15% and 9%, respectively, while they were only 3% in the RAS mutant group. The mutation rate of PIK3CA in the RAS mutant group was 31%, while that in the RAS wild-type group was 14% (Table 3).
| All patients | Patients without chemothreapy | Patients with chemothreapy | ||||
|---|---|---|---|---|---|---|
| RAS-MUT | RAS-WT | RAS-MUT | RAS-WT | RAS-MUT | RAS-WT | |
| number of patients | 899 | 798 | 465 | 487 | 379 | 258 |
| No.1 | Tp53 | Tp53 | Tp53 | Tp53 | Tp53 | Tp53 |
| No.2 | apc | apc | apc | apc | apc | apc |
| No.3 | Pik3ca | Lrp1b | Pik3ca | Lrp1b | Smad4 | Lrp1b |
| No.4 | Smad4 | BRAF | Smad4 | BRAF | Pik3ca | BRAF |
| No.5 | Fbxw7 | Myc | Fbxw7 | Pik3ca | Fbxw7 | Myc |
| No.6 | Tcf7l2 | Fbxw7 | Tcf7l2 | Fbxw7 | Tcf7l2 | Fbxw7 |
| No.7 | Lrp1b | Smad4 | Sox9 | Tcf7l2 | Lrp1b | Smad4 |
| No.8 | Sox9 | Pik3ca | Lrp1b | Mll3 | Sox9 | Rnf43 |
| No.9 | Fam123b | Tcf7l2 | Fam123b | Arid1a | Fat2 | Mll3 |
| No.10 | Arid1a | Mll3 | Arid1a | Smad4 | Fam123b | Pik3ca |
Note: RAS-MUT is mutant RAS; RAS-WT is wild-type RAS.
Table 2: Genes with mutation rate in the top 10 in patients with a mutant (RAS-MUT) or wild-type (RAS-WT) KRAS.
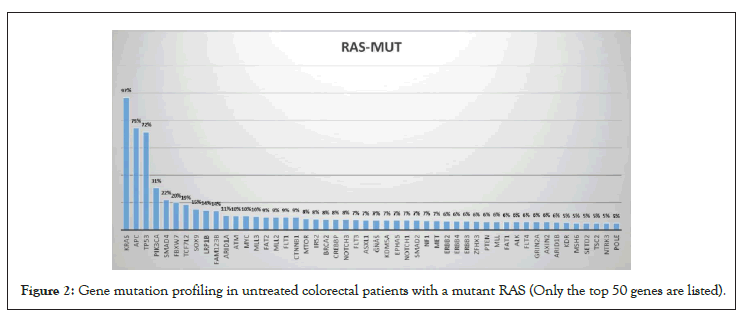
Figure 2: Gene mutation profiling in untreated colorectal patients with a mutant RAS (Only the top 50 genes are listed).
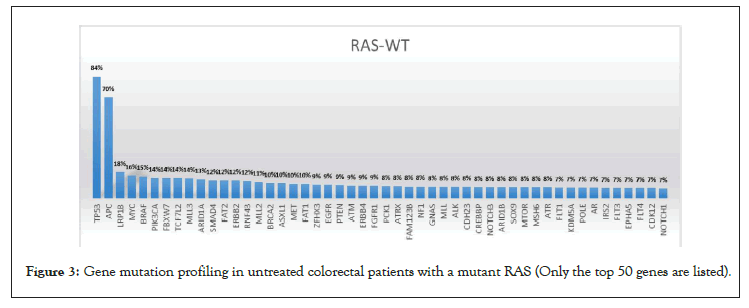
Figure 3: 40 genes whose mutation rate is different between RAS mutant (RAS-MUT) and wild-type (RAS-WT) patients.
| Gene | Mutation rate (%) | times | |
|---|---|---|---|
| RAS-MUT | RAS-WT | WT/MUT | |
| BRAF | 3 | 15 | 5 |
| EGFR | 3 | 9 | 3 |
| BCL2L1 | 2 | 6 | 3 |
| TOP2A | 2 | 6 | 3 |
| PTCH1 | 2 | 5 | 2.5 |
| PTCH2 | 2 | 5 | 2.5 |
| BRCA1 | 2 | 5 | 2.5 |
| CSF1R | 2 | 5 | 2.5 |
| RNF43 | 5 | 12 | 2.4 |
| FGFR1 | 4 | 9 | 2.25 |
| ERBB2 | 6 | 12 | 2 |
| PCK1 | 4 | 8 | 2 |
| ATRX | 4 | 8 | 2 |
| ATR | 4 | 8 | 2 |
| IGF1R | 3 | 6 | 2 |
| AXL | 3 | 6 | 2 |
| AR | 4 | 7 | 1.75 |
| FAT1 | 6 | 10 | 1.67 |
| ABL1 | 3 | 5 | 1.67 |
| MSH3 | 3 | 5 | 1.67 |
| MYC | 10 | 16 | 1.6 |
| CDH23 | 5 | 8 | 1.6 |
| TP53 | 72 | 84 | 1.17 |
| FBXW7 | 20 | 14 | 0.7 |
| FAM123B | 14 | 8 | 0.57 |
| SMAD2 | 7 | 4 | 0.57 |
| SMAD4 | 22 | 12 | 0.55 |
| SOX9 | 15 | 8 | 0.53 |
| PIK3CA | 31 | 14 | 0.45 |
Table 3: Genes with different mutation rates in mutant (RAS-MUT) and wild-type (RAS-WT) RAS patients who did not receive chemotherapy (only genes with mutation rates greater than 5% are listed).
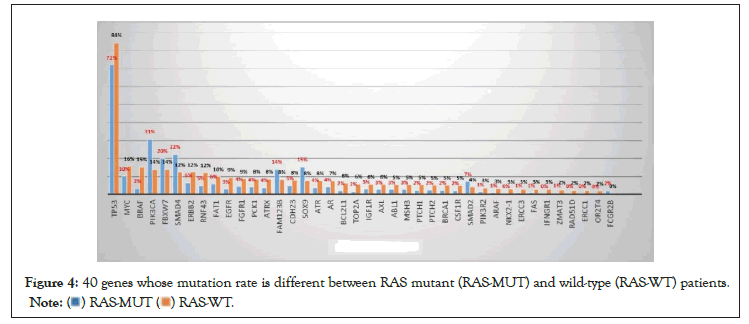
Figure 4: 40 genes whose mutation rate is different between RAS mutant (RAS-MUT) and wild-type (RAS-WT) patients.
Differences in the gene mutation profiles of patients with or without an APC mutation
Among the 952 patients who did not receive chemotherapy, 265 had wild-type APC and 687 had an APC mutant. The mutation rate of APC was 72.2% (i.e., 687/952). There were 28 genes in which the mutation rate was different between the two groups (defined as a difference in the mutation rate between the two groups greater than 1%) (Figure 5 and Table 4). As shown in Table 4, the mutation rate of the gene, RNF43, in the APC wild-type group was 5.23 times higher than that in the APC mutant group (Table 4). On the contrary, the mutation rate of the gene, NSD1, in the APC wild-type group was 0.07 times higher than that in the APC mutant group, which was significantly lower than that in the APC mutant group.
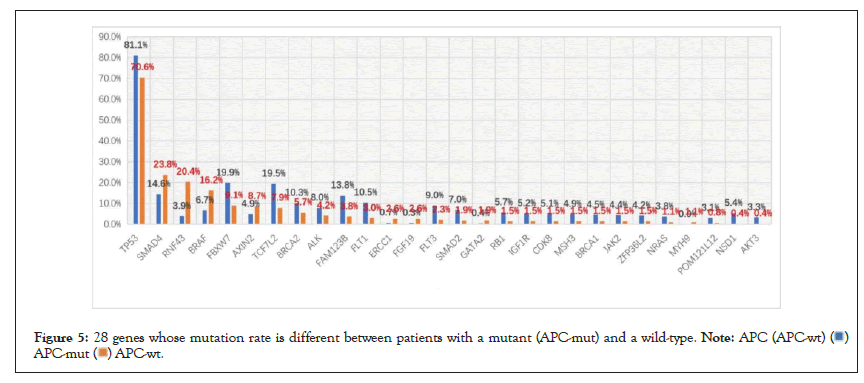
Figure 5: 28 genes whose mutation rate is different between patients with a mutant (APC-mut) and a wild-type.
 .
.
| Gene | Mutation rate (%) | Times | |
|---|---|---|---|
| APC-MUT | APC-WT | WT/MUT | |
| RNF43 | 3.9 | 20.4 | 5.23 |
| BRAF | 6.7 | 16.2 | 2.42 |
| SMAD4 | 14.6 | 23.8 | 1.63 |
| TP53 | 81.1 | 70.6 | 0.87 |
| BRCA2 | 10.3 | 5.7 | 0.55 |
| ALK | 8 | 4.2 | 0.53 |
| FBXW7 | 19.9 | 9.1 | 0.46 |
| TCF7L2 | 19.5 | 7.9 | 0.41 |
| CDK8 | 5.1 | 1.5 | 0.29 |
| IGF1R | 5.2 | 1.5 | 0.29 |
| FLT1 | 10.5 | 3 | 0.29 |
| FAM123B | 13.8 | 3.8 | 0.28 |
| SMAD2 | 7 | 1.9 | 0.27 |
| RB1 | 5.7 | 1.5 | 0.26 |
| FLT3 | 9 | 2.3 | 0.26 |
| NSD1 | 5.4 | 0.4 | 0.07 |
Table 4: Genes with different mutation rates in mutant (APC-MUT) and wild-type (APC-WT) APC patients (only genes with mutation rates greater than 5% are listed).
Differences in the gene mutation profiles of patients with or without a TP53 mutation
Among the 952 patients who did not receive chemotherapy, 208 had wild-type TP53 and 744 had a TP53 mutant. The mutation rate of TP53 was 78.2% (i.e., 744/952). There were differences in the mutation rates of 102 genes between the two groups (defined as a difference in the mutation rate between the two groups greater than 1%) (Figure 6 and Table 5). As shown in Table 5, MLH1, HDAC4, TGFBR2, RAD50, and MSH3 were the top five genes in the ratio of the two groups. Two of them, MLH1 and MSH3, were mismatch repair genes (MMR). The mutation rate of MLH1 in the TP53 wild-type group was 8.42 times higher than that in the TP53 mutant group, which was significantly higher than that in the TP53 mutant group (Table 5).
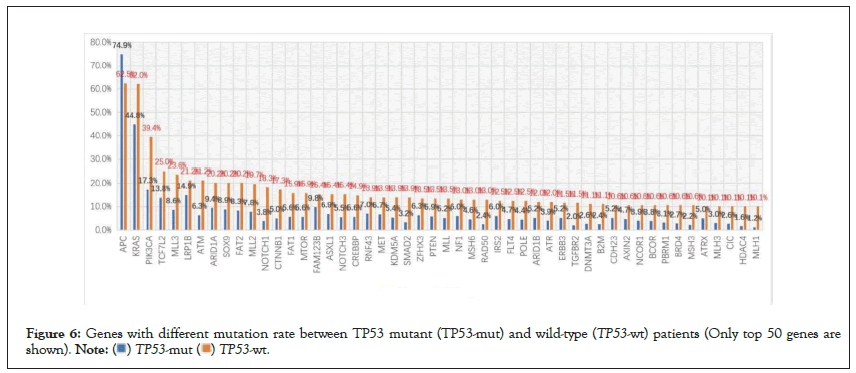
Figure 6: Genes with different mutation rate between TP53 mutant (TP53-mut) and wild-type (TP53-wt) patients (Only top 50 genes are shown).  .
.
| Gene | Mutation rate (%) | Times | |
|---|---|---|---|
| TP53-MUT | TP53-WT | WT/MUT | |
| MLH1 | 1.2 | 10.1 | 8.42 |
| HDAC4 | 1.6 | 10.1 | 6.31 |
| TGFBR2 | 2 | 11.5 | 5.75 |
| RAD50 | 2.4 | 13 | 5.42 |
| MSH3 | 2.2 | 10.6 | 4.82 |
| NOTCH1 | 3.8 | 18.3 | 4.82 |
| B2M | 2.4 | 11.1 | 4.63 |
| SMAD2 | 3.2 | 13.9 | 4.34 |
| DNMT3A | 2.6 | 11.1 | 4.27 |
| BRD4 | 2.7 | 10.6 | 3.93 |
| CIC | 2.6 | 10.1 | 3.88 |
| CTNNB1 | 5 | 17.3 | 3.46 |
| PBRM1 | 3.1 | 10.6 | 3.42 |
| MLH3 | 3 | 10.1 | 3.37 |
| ATM | 6.3 | 21.2 | 3.37 |
| ATR | 3.9 | 12 | 3.08 |
| POLE | 4.4 | 12.5 | 2.84 |
| FAT1 | 5.6 | 15.9 | 2.84 |
| MTOR | 5.6 | 15.9 | 2.84 |
| MSH6 | 4.6 | 13 | 2.83 |
| NOTCH3 | 5.5 | 15.4 | 2.8 |
| BCOR | 3.8 | 10.6 | 2.79 |
| MLL3 | 8.6 | 23.6 | 2.74 |
| NCOR1 | 3.9 | 10.6 | 2.72 |
| CREBBP | 5.6 | 14.9 | 2.66 |
| FLT4 | 4.7 | 12.5 | 2.66 |
| MLL | 5.2 | 13.5 | 2.6 |
| KDM5A | 5.4 | 13.9 | 2.57 |
| MLL2 | 7.8 | 19.7 | 2.53 |
| FAT2 | 8.3 | 20.2 | 2.43 |
| ARID1B | 5.2 | 12 | 2.31 |
| PTEN | 5.9 | 13.5 | 2.29 |
| PIK3CA | 17.3 | 39.4 | 2.28 |
| SOX9 | 8.9 | 20.2 | 2.27 |
| AXIN2 | 4.7 | 10.6 | 2.26 |
| ASXL1 | 6.9 | 15.4 | 2.23 |
| ERBB3 | 5.2 | 11.5 | 2.21 |
| NF1 | 6 | 13 | 2.17 |
| ARID1A | 9.4 | 20.2 | 2.15 |
| ZFHX3 | 6.3 | 13.5 | 2.14 |
| IRS2 | 6 | 12.5 | 2.08 |
| MET | 6.7 | 13.9 | 2.07 |
| CDH23 | 5.2 | 10.6 | 2.04 |
| ATRX | 5 | 10.1 | 2.02 |
| RNF43 | 7 | 13.9 | 1.99 |
| TCF7L2 | 13.8 | 25 | 1.81 |
| FAM123B | 9.8 | 15.4 | 1.57 |
| LRP1B | 14.9 | 21.2 | 1.42 |
| KRAS | 44.8 | 62 | 1.38 |
| APC | 74.9 | 62.5 | 0.83 |
Table 5: Genes with different mutation rates in mutant (TP53-MUT) and wild-type (TP53-WT) TP53 patients who did not receive chemotherapy (only genes with mutation rates greater than 5% are listed).
It is widely known that RAS plays an important role in the occurrence of colorectal cancer. This study demonstrated that, as shown in Table 1, in patients with colorectal cancer, the mutation rate of the KRAS gene was not significantly different according to gender, age, tumor stage, tumor location, or other clinicopathological features. This suggests that there is no inevitable correlation between KRAS gene mutation and the above clinicopathological features. However, it is worth noting that the BRAF gene mutation rate was only approximately 0.6% (i.e., 2/349) in patients with a KRAS mutation, while it was 5.9% (i.e., 25/422) in patients with wild-type KRAS (Table 1). The mutation rate of the BRAF gene in the wild-type KRAS group was significantly higher than that in the KRAS mutation group.
As is well known, the RAF gene codes for cytoplasmic serine/threonine kinases that are regulated by binding RAS, and the vast majority of RAF mutations represent a single nucleotide change in T-A at nucleotide 1796, resulting in a valine to glutamic acid change at residue 599 within the activation segment of BRAF[22]. RAS function is not required for the growth of cancer cell lines with the BRAF V599E mutation [23]. RAF and RAS mutations are rarely concurrently present in the same cancer, and cancer types with BRAF mutations are similar to those with RAS mutations. This explains why the BRAF mutation rate is low in KRAS mutant patients but significantly higher in KRASwild-type patients in this study.
Studies have shown that KRAS mutation is negatively correlated with the overall survival of patients with colorectal cancer [24,25]. In this study, it was also observed that the median survival of KRAS mutant patients was worse than that of KRAS wild-type patients, although the difference was not statistically significant.
Although KRAS plays an important role in the occurrence of colorectal cancer, up to 50% of patients had wild-type KRAS. Therefore, in order to further understand the differences in the biological behavior between KRAS mutation and KRASwild-type colon cancer, we compared the results of the NGS test in patients with KRAS mutation and KRAS wild-type colon cancer. The results showed that there were significant differences in the gene mutation profiles between the two groups. Interestingly, in the RTK–RAS–MAPK pathway, NGS detection showed that the mutation rates of BRAFand EGFR in RAS wild-type patients were significantly higher than those in the RAS mutant group, and the mutation rates of BRAF and EGFR in the RAS wild-type group were five times and three times higher than those in the RAS mutant group, respectively (Table 3). This suggests that KRAS mutation and BRAF or EGFR mutation may be mutually exclusive in colorectal cancer [26] and that in the process of colorectal mucosal cell carcinogenesis, a single gene mutation may be sufficient to cause the dysfunction of a signal pathway. For example, the RAS gene mutation may be enough to cause the dysfunction of the RTK–RAS-MAPK pathway, and there is no need for EGFR or BRAF mutations at the same time. Accordingly, if there are multiple gene mutations in a signal pathway in patients with colorectal cancer, which is rare, blocking these genes at the same time may be a good treatment option. Many therapeutic studies targeting multiple signaling molecules in the RTK-RAS-MAPK pathway have achieved positive results in vitro [27,28] and in vivo [29-33].
Colorectal cancers are believed to arise via the gradual stepwise accumulation of mutations [34,35], and there are many mutations in oncogenes and/or tumor suppressor genes during this process. In the classic adenoma cancer pathway of colorectal cancer, APC gene mutation in the Wnt/β-catenin pathway is considered to be the initiating event of adenoma [36]. On this basis, deregulated WNT signaling is often followed by mutations in KRAS/NRAS, the TGFβ pathway, PIK3CA, TP53, or any combination of several of these alterations [37]. The mutations of TP53, RAS, and other genes further promote the occurrence and development of colon cancer. This study showed that there was no difference in the mutation rate of APC between RAS mutant and wild-type patients, suggesting that APC plays an equally important role in the occurrence of colorectal cancer, whether the presence of a RAS mutation or not. However, the problem is that not all patients with sporadic colorectal cancer harbor an APC mutation, and in this study, approximately 30% of patients had wild-type APC. Similarly, approximately 20% of patients had wild-type TP53, and nearly 50% of patients had wild-type KRAS. On the other hand, in the APC wild-type patients, the mutation rate of the tumor suppressor gene, RNF43, was 5.23 times higher than that in the APC mutation group, and the mutation rate of Smad4 was 1.63 times higher than that in the APC mutation group (Table 4). Similarly, the BRAF mutation rate in KRAS wild-type patients was five times higher than that in KRAS mutation patients (Table 3). In TP53 wild-type patients, the mutation rates of the mismatch repair genes, MLH1 and MSH3, were 8.42 and 4.82 times higher than those in the mutation group, respectively (Table 5). Therefore, although some genes, such as APC, TP53, and KRAS, have a very high mutation frequency in colorectal cancer, none of them are necessary for the occurrence of sporadic colorectal malignancies. For example, in patients with wild-type oncogene KRAS, the mutation of oncogene BRAF or EGFR may play a role in RAS gene mutation; similarly, RNF43 mutations may play a role in APC mutations in patients with wild-type APC, as RNF43 mutation could contribute to the activation of Wnt signaling in colorectal carcinoma [38,39] and cancer-associated mutations that abrogate RNF43 phosphorylation and cooperate with active RAS to promote tumorigenesis by abolishing the inhibitory function of RNF43 in Wnt signaling. [40].
Mismatch Repair (MMR) proteins, especially MLH1, are closely related to apoptosis induced by alkylating agents [41]. Alkylating agents can induce both apoptosis and phosphorylation of the Ser-15 site of TP53 in a MLH1-dependent manner. [42]. MLH1 deficiency is a prominent signal during carcinogenesis of colorectal mucosal cells, but does not appear to be an absolute requirement or sufficient to cause colon cancer alone [43]; therefore, the mutant MLH1 may promote tumorigenesis by inhibiting the apoptosis of cells through impeding the phosphorylation of TP53 in patients with wild-type TP53. HDAC4 is an important regulator of proliferation of colon cancer cells, and it can promote the growth of colon cancer cells via the repression of p21 [44]. Furthermore, there is a complex interaction between TP53 and HDAC4. Tp53 can induce HDAC4 cytoplasmic translocation and phosphorylation, and DAC4 phosphorylation and translocation promotes autophagy through the transcription of ATG3 [45]. Thus, mutations in the mismatch repair gene, MLH1, and in histone deacetylase 4 (HDAC4) may play an important role, albeit via a mechanism that is not yet fully understood, in TP53 wild-type colon cancer.
The gene mutation spectrum differs significantly between patients with KRAS mutant and wild-type colorectal cancer. Among KRASwild-type patients, the mutation rate of oncogenes, such as BRAF and EGFR, was significantly higher than that in KRAS mutant patients, and the mutation rate of PIK3CA was significantly lower than that in KRAS mutant patients. In addition, a single gene mutation may be sufficient to cause the dysfunction of a signal transduction pathway, and APC, TP53, or RAS are not necessary for the carcinogenesis of sporadic colorectal cancer. Colorectal cancers are believed to arise via the gradual stepwise accumulation of mutations, and there are many mutations in oncogenes and/or tumor suppressor genes during this process. Therefore, in order to further understand the differences in the biological behavior between KRAS mutation and KRAS wild-type colon cancer, we compared the results of the NGS test in patients with KRAS mutation and KRAS wild-type colon cancer.
We reached an agreement of all participants in this study to publish this document.
The authors declared no conflicts of interest.
Shujian Chang was supported by the clinical research and translational medicine research project of the Affiliated Hospital of Jiangnan University (Project No.: lcyj202240 )
Shujian Chang conceptualized the study, analyzed the data and wrote the manuscript; Yudan Zhou and Ruirong Wu collected the clinical data and prepared the figures and tables. Xiaosong Ge and Yong Pu collected the pathological and NGS data. All authors have reviewed the manuscript.
Not applicable.
[Crossref] [Google Scholar] [PubMed]
[Crossref] [Google Scholar] [PubMed]
[Crossref] [Google Scholar] [PubMed]
[Crossref] [Google Scholar] [PubMed]
[Crossref] [Google Scholar] [PubMed]
[Crossref] [Google Scholar] [PubMed]
[Crossref] [Google Scholar] [PubMed]
[Crossref] [Google Scholar] [PubMed]
[Crossref] [Google Scholar] [PubMed]
[Crossref] [Google Scholar] [PubMed]
[Crossref] [Google Scholar] [PubMed]
[Crossref] [Google Scholar] [PubMed]
[Crossref] [Google Scholar] [PubMed]
[Crossref] [Google Scholar] [PubMed]
[Crossref] [Google Scholar] [PubMed]
[Crossref] [Google Scholar] [PubMed]
[Crossref] [Google Scholar] [PubMed]
[Crossref] [Google Scholar] [PubMed]
[Crossref] [Google Scholar] [PubMed]
[Crossref] [Google Scholar] [PubMed]
[Crossref] [Google Scholar] [PubMed]
[Crossref] [Google Scholar] [PubMed]
[Crossref] [Google Scholar] [PubMed]
[Crossref] [Google Scholar] [PubMed]
[Crossref] [Google Scholar] [PubMed]
[Crossref] [Google Scholar] [PubMed]
[Crossref] [Google Scholar] [PubMed]
[Crossref] [Google Scholar] [PubMed]
[Crossref] [Google Scholar] [PubMed]
[Crossref] [Google Scholar] [PubMed]
[Crossref] [Google Scholar] [PubMed]
[Crossref] [Google Scholar] [PubMed]
[Crossref] [Google Scholar] [PubMed]
[Crossref] [Google Scholar] [PubMed]
[Crossref] [Google Scholar] [PubMed]
[Crossref] [Google Scholar] [PubMed]
[Google Scholar] [PubMed]
[Crossref] [Google Scholar] [PubMed]
[Crossref] [Google Scholar] [PubMed]
[Google Scholar] [PubMed]
[Crossref] [Google Scholar] [PubMed]
[Crossref] [Google Scholar] [PubMed]
[Crossref] [Google Scholar] [PubMed]
Citation: Chang S, Zhou Y, Wu R, Ge X, Pu Y (2022) Differences in Gene Mutation Profiles of Colon Cancer Patients with or without a KRAS Mutation. Immunogenet Open Access. 7:175.
Received: 22-Jul-2022, Manuscript No. IGOA-22-18538; Editor assigned: 25-Jul-2022, Pre QC No. IGOA-22-18538 (PQ); Reviewed: 08-Aug-2022, QC No. IGOA-22-18538; Revised: 15-Aug-2022, Manuscript No. IGOA-22-18538 (R); Published: 22-Aug-2022 , DOI: 10.35248/IGOA.22.7.175
Copyright: © 2022 Chang S, et al. This is an open access article distributed under the terms of the Creative Commons Attribution License, which permits unrestricted use, distribution, and reproduction in any medium, provided the original author and source are credited.