Pharmaceutical Analytical Chemistry: Open Access
Open Access
ISSN: 2471-2698
ISSN: 2471-2698
Research Article - (2017) Volume 3, Issue 3
A rapid and sensitive LC-MS/MS method has been developed and fully validated for simultaneous quantification of aspirin (ASP), salicylic acid (SLA), rosuvastatin (RVT), rosuvastatin lactone (RVL) and N-desmethyl rosuvastatin (DM RVT) in human plasma using a polarity switch with 400 μL of sample human blank plasma. Deuterated Internal Standards (IS) were used for each analyte. The solid phase extraction was used as sample preparation techniques. Chromatograph was monitored on a zorbax SB-phenyl column with a gradient mode with API-5500 triple quadrupole mass spectrometer as detector. The assay method was validated over the concentration range of 0.1-25 ng/mL for RVT; 50-10000 pg/mL for RVL and DMRVT; 5-2000 ng/mL for ASP; and 0.1-8 μg/mL for SLA. Intra and inter-day precision and accuracy were within acceptance limit. The mean recovery was >85% for all analytes. The analytes were stable at RT for 6 h in solution, at 2-8°C for 15 days in solution, for RT for 6 h in plasma, RT for 2 h in blood, till 3 freeze/thaw cycles, 104 h in auto-sampler at 6°C. This proposed method can be used for measurement of reliable concentration for dossier submission.
<Keywords: Liquid chromatography; Mass spectrometry; Rosuvastatin; Aspirin; Lipid lowering agent; Plasma
Rosuvastatin is HMG-CoA reductase inhibitor which is indicated as adjunctive therapy to diet to reduce elevated Total-C, LDL-C, ApoB, nonHDL-C, and triglycerides and to increase HDL-C in adult patients with primary hyperlipidemia or mixed dyslipidemia. The absolute bioavailability of rosuvastatin is approximately 20%. Rosuvastatin is not extensively metabolized; approximately 10% of a radiolabeled dose is recovered as metabolite. The major metabolite is N-desmethyl rosuvastatin, which is formed principally by cytochrome P450/2C9, and in vitro studies have demonstrated that N-desmethyl rosuvastatin has approximately one-sixth to one-half the HMG-CoA reductase inhibitory activity of the parent compound. Overall, greater than 90% of active plasma HMG-CoA reductase inhibitory activity is accounted for by the parent compound.
However, acetylsalicylic acid is adhering and aggregating platelets secrete TXA-2, which leads to further platelet recruitment and activation. It inhibits fatty acid cyclooxygenase by acetylation of the active site of the enzyme. Acetylsalicylic acid is rapidly hydrolyzed in the plasma to salicylic acid such that plasma levels of acetylsalicylic acid are essentially undetectable 1-2 h after dosing.
Rosuvastatin+enteric coated aspirin capsules are available in 5+75 mg and 10+75 mg strengths. This combination is indicated for primary prevention of myocardial infarction, stroke, and arterial revascularization procedures in patients with or without clinically evident coronary heart disease but with an increased risk of cardiovascular disease (CVD) based on age (men ≥ 50 and women ≥ 60), with the presence of at least one additional CVD risk factor, such as hypertension, low HDL-C, smoking, or a family history of premature coronary heart disease. Reported Cmax based on Rosuvastatin 80 mg tablets for RVT, RVL and DM RVT are 49.5 ng/mL, 7.1 ng/mL and 7.2 ng/mL, respectively [1]. Based on 325 mg tablets aspirin data reported Cmax for ASP and SLA is 2.59 μg/mL and 16.8 μg/mL, respectively.
Literature survey shows that RP-HPLC stability indicating methods for rosuvastatin alone or with combination [2], LC-MS/MS methods for plasma for rosuvastatin alone or with metabolites/combination of other drugs [3-16], LC-MS/MS methods for plasma for aspirin alone or with metabolites/combination of other drugs [17-25] are reported. It is noted that method for simultaneous estimation of RVT with metabolites and ASP with metabolite is not available. ASP is rapidly hydrolyzed to SLA in plasma samples; RVT is unstable in plasma and converted to RVL [10]; No isotope labelled standards was used as internal standards which are current European regulatory requirement; and unable to measure the low amount of RVL and other metabolite by single method in plasma and different methods were report for all analytes.
Therefore, it is thought of interest to develop and validate a single LC-MS/MS assay method for simultaneous estimation of all analytes in plasma to overcome all above issues. Potassium fluoride was used as a stabilizer, to prevent the hydrolysis of ASP to SLA while L-ascorbic acid is used to as stabilizer to prevent the inter conversion between RVT to RVL and vice versa. We had used switch over polarity concept [26] in single method, to achieve required sensitivity and selectivity. SPE method was used to clean up the plasma samples, to avoid the matrix effect and to achieve maximum recovery. This proposed method was validated in compliance with EMEA, FDA, and ANVISA guidelines. Parent ions of all analytes were monitor in multiple reactions monitoring mode along with daughter ions, to enhance the specificity or selectivity and multiple transitions of daughter’s ions were used to raise the method sensitivity. Addition to this, linearity range was decided based on Cmax, covering both strengths, hence it can be used for application of BA/BE studies with combination of 5 and 10 mg rosuvastatin with 75 mg of aspirin oral dosage form.
ASP and D6 DM RVT were obtained from TRC Canada, North York, Ontario; RVT and SLA were procured from in-house; DM RVT, D3 RVT, D6 RVL and D4 ASP were procured from Clearsynth Labs Limited, Mumbai, India; RVL and D4 SLA was procured from Vivan Life Sciences Pvt. Limited, Mumbai, India. LC-MS grade acetonitrile and methanol from JT Baker (Centre Valley, PA, USA); L-ascorbic acid from Loba Chemie (Boisar, Palghar, India); ammonium acetate from Sigma Aldrich (St. Lowis, USA); glacial acetic acid and potassium fluoride from Merck (Worli, Mumbai, India); and water was produced from Milli-Q water purification system (Millipore Merck, USA) were used. Blank plasma was collected into K2EDTA tubes from drug-free healthy volunteers, clinical pharmacology unit, Sun Pharmaceutical Industries Limited; Independence Ethics Committee approved these processes.
LC-MS system and conditions
The method consisted of a zorbax SB-phenyl column (150 × 4.6 mm, 3.5 μ; Agilent Technologies, Waldbronn, Germany) on a Dionex UHPLC (Thermo Scientific, Germany) integrated to API-5500 triple quadrupole mass spectrometer (A B Sciex, Canada) equipped with an electrospray ionization source (ESI). The 21 CFR part 11 approved software analyst version 1.5.2 (A B Sciex, Canada) was used for method setup, data acquisition, and data processing and reporting. A solvent gradient programme (starting flow rate of 450 μL/min) with methanol (mobile phase A) -ammonium acetate (pH 3.0; 1 mM) buffer in water (mobile phase B) was used for chromatographic separation. The gradient programme started with 10% mobile phase A, and held for 0.5 min. Mobile phase A was increased to 72.5% over 0.5 min. This was maintained for 7.0 min, followed by 60% till 8.5 min and again followed by column equilibration to the initial conditions. The total run time was 9.0 min. The injection volume was 10 μL and the needle was washed twice with 200 μL water: methanol (50:50, v/v) between injections. The MS was operated in positive and negative ionization mode to achieve the desired area response. The electrospray voltage was set at 5.5 kV for positive mode and -4.5 kV for negative mode, the source temperature at 550°C. The GS1 and GS2 pressures were set of 50 and 65 arbitrary units, respectively. Nitrogen gas was used as the curtain gas which was set at 35 arbitrary units and collision gas was set at 8 arbitrary units. Product ion characterization and tuning was done by directly infusing 100 ng/ mL solutions of all the five analytes and there IS separately into the MS using a syringe at a flow rate of 7 μL/min. The most sensitive mass transitions (m/z) were monitored in multiple reaction monitoring.
Stock solutions, calibration standards and Quality Controls (QC)
Stock solutions of all analytes and IS were prepared from their respective reference standards as stated in Table 1. All stock solutions of analyte and IS were stored at -20°C.
| Analyte name# | Type | Concentration (µg/mL) | Solvent |
|---|---|---|---|
| RVT | analyte | 100 | methanol |
| RVL | metabolite | 100 | acetonitrile |
| DM RVT | metabolite | 100 | methanol |
| ASP | analyte | 500 | 3% acetic acid in acetonitrile: water (80:20, v/v) |
| SLA | metabolite | 2000 | 3% acetic acid in acetonitrile: water (80:20, v/v) |
| D3 RVT | IS | 100 | methanol |
| D3 RVL | IS | 100 | acetonitrile |
| D6 DM RVT | IS | 100 | methanol |
| D4 ASP | IS | 100 | 3% acetic acid in acetonitrile: water (80:20, v/v) |
| D4 SLA | IS | 100 | 3% acetic acid in acetonitrile: water (80:20, v/v) |
Where; #ASP: aspirin, SLA: salicylic acid, RVT: rosuvastatin, RVL: rosuvastatin lactone and DM RVT: N-desmethyl rosuvastatin, D: deuterium standard used as internal standard (IS).
Table 1: Stock solutions of analytes and internal standards.
Calibration standards and QC samples preparations
The working solutions of calibration standards and quality control samples for all analytes were prepared in plasma, treated with buffer. The buffered plasma was prepared by mixing of 9 ml human K2EDTA plasma, 0.3 ml of 25% L-ascorbic acid and 0.5 ml of 5 M potassium fluoride solution and vortexed it. From this buffered plasma, the 390 μL human K2EDTA plasma free of significant interference were taken in ria-vials and spiked 10 μL of working calibration standard or quality control solutions as mention in below Table 2.
| Levels | RVT (ng/mL) | RVL (pg/mL) | DM RVT (pg/mL) | ASP(ng/mL) | SLA (µg/mL) |
|---|---|---|---|---|---|
| CC range# | 0.1-25 | 50-1000 | 50-1000 | 5-2000 | 0.1-8 |
| LQC A | 0.30 | 150 | 150 | 15 | 0.3 |
| LQC B | 0.90 | 450 | 450 | 45 | 0.9 |
| MQC A | 6.24 | 2500 | 2500 | 450 | 1.8 |
| MQC B | 11.74 | 4700 | 4700 | 845 | 3.6 |
| HQC | 20.74 | 8300 | 8300 | 1595 | 6.2 |
| DQC | 80.00 | 32500 | 32500 | 5625 | 17.5 |
Where: #range for calibration curve standards is defined based on anticipated low concentration in clinical study 5 and 10 mg rosuvastatin with 75 mg aspirin tablets.
Table 2: Linearity range with different QC levels for all analytes.
Sample pre-treatment
The 10 μL of working CC/QC solution of analyte(s) were spiked in 390 μL of human buffered blank K2EDTA plasma free of significant interference at the retention time (RT) for the transition of analytes and the IS (Q1/Q3) in ria-vials. The 50 μL of WIS solution were added and 500 μL of 1% formic acid in water solution were added and followed by solid phase extraction (SPE) method using plexa (30 mg/1 cc) which were pre-equilibrated with methanol and water. The cartridges were washed with milli-Q-water, 1% formic acid and 10% methanol followed by elution with 500 μL of acetonitrile- ammonium acetate buffer (pH- 3.0; 1mM) (75:25, v/v). The samples were transferred into fresh glass HPLC vial for analysis.
Calibration curves, accuracy and precision, dilution integrity, and limit of quantitation
A calibration curve consisting of a blank (without drug and without IS), zero blank (without drug and with IS), eight standards in the range of 0.1-25 ng/mL for RVT, 50-10000 pg/mL for RVL and DMRVT, 5-2000 ng/mL for ASP and 0.1-8 μg/mL for SLA and QCs samples along with diluted QC (DQC) samples (n=6 separate extractions for each level) were prepared and analysed in a single analytical run. Calibration curves were constructed using a linear regression equation of analyte/IS peak area ratios versus nominal concentrations with a 1/ concentration × concentration weighting. Accuracy was defined as a percentage deviation of measured concentration from the nominal value and precision was defined as the percentage coefficient of variation (%CV). Not less than 75% of all standards and 67% of all QCs (50% at each level) in any batch were required to have a percentage deviation within ± 15% except LLOQ where a percentage deviation within ± 20%.
To investigate dilution integrity for clinical samples with concentrations above the reference range, The DQC samples were prepared from 1.5-3 times of ULOQ concentration by 5 times diluting using interference free blank plasma and similarly extracted in the same P&A batch. The final concentrations were then derived by backcalculating with the appropriate dilution factor. To determine the lower limit of quantitation and upper limit of quantitation 6 replicates of CS1 and CS8 were analyzed against calibration curve of precision and accuracy (P and A) batch in same analytical run.
Selectivity, matrix effect, recovery, and carry over
Human K2EDTA plasma from 8 different sources (4 normal+2 hemolysed+2 lipemic) along with LLOQ sample prepared in each lot was analyzed, to determine the interference of an endogenous substance at the retention time of all analytes.
To investigate matrix effect, the aqueous samples of LQC-A and HQC samples was prepared by adding 10 μL of WLQC-A and WHQC respectively and 50 μL WIS in 440 μL of elution solution, mixed well and transferred to HPLC vials for analysis. The blank human K2EDTA plasma (4 normal, 2 lipemic and 2 hemolysed) were processed up to elution step as per analytical test procedure. 8 vials of each extracted LQC-A and HQC were prepared by adding 10 μL of WLQC-A and WHQC respectively, 50 μL of WIS in 440 μL of processed blank. All these samples were transferred to HPLC vials for analysis.
Relative recovery of all analytes were evaluated by comparing mean analyte responses of six extracted QC samples of LQC-A, MQC-B and HQC level to the six unextracted QC samples at same level. For the IS, mean IS response of eighteen extracted samples was compared to of the eighteen un-extracted QC samples. Similarly, absolute recovery of all analytes and IS were evaluated by comparing extracted sample to post extracted QC samples at same level.
A %CV of ≤ 15% across all QC concentrations was set as the level of acceptance for both matrix effect and recovery in line with the FDA method validation guidelines.
Carryover test was performed in the sequence of extracted sample of LLOQ, blank (PB), ULOQ, PB, PB, ULOQ, PB, PB. The interference in plasma blank was evaluated against LLOQ as reference sample. The carry-over was considered significant if any blank shows more than 20% response compare to analyte RT and/or more than 5% response compare to IS RT.
Stability and re-injection reproducibility
All the matrix stability was performed using the bulk spiked samples which were pre-checked (immediately after preparation) for accuracy and considered as a zero day samples. Six replicates of bulk spiked LQC-A and HQC samples were subjected different stability conditions to mimic the study sample analysis condition. These stability samples were processed and analysed in a single run along with freshly processed calibration standards (CS), two sets of QC samples.
The short term and longterm analyte and IS stock as well as working solution for both LLOQ and ULOQ level were evaluated for required storage conditions and durations against freshly prepared stock samples and analyzed in a single run by six replicates injection at each level.
To evaluate the reinjection reproducibility experiment, quality control samples of one P&A batch were kept into auto sampler after analysis at 6 ± 2°C and reinjected after 12 h and evaluated against the acceptance limits of accuracy (± 15% of their respective nominal concentration) and precision (≤ 15% CV).
Extended accuracy and precision, ruggedness and robustness
To evaluate accuracy and precision over extended period to cover actual study sample analysis duration, a CS plus a total of 120 spiked samples (24 replicates × 5 QC levels) were processed and analysed in a single analytical run and evaluated as per P and A criteria.
Accuracy and precision experiment was performed with probable changes during study sample analysis like different column with same specification and different analyst. The run consisted of a CS plus a total of 30 spiked samples (6 replicates × 5 QC levels) and evaluated as per P and A criteria.
Robustness QCs with change in extraction time, comparison QC sets of 6 samples each at LQC-A and HQC level, CS were processed and analysed in a single analytical run. Comparison QCs (i.e., column oven temperature changed from nominal temperature i.e., 40 ± 2°C) were re-injected as robustness QCs with column oven temperature change.
LC-MS/MS conditions
The polarity, transitions and collision energy of all analytes along with IS were provided in below Table 3. The scan width was set at 0.01 m/z and the dwell time at 0.02-0.03 s. Representative chromatograms are shown in Figure 1, with a retention times of 6.96 min for RVT, 9.10 min for RVL, 4.88 min for DMRVT, 4.71 min for ASP, 5.79 min for SLA, 6.94 min for D3 RVT, 9.04 min for D6 RVL, 4.84 min for D6 DMRVT, 4.71 min for D4 ASP, and 5.71 min for D4 SLA.
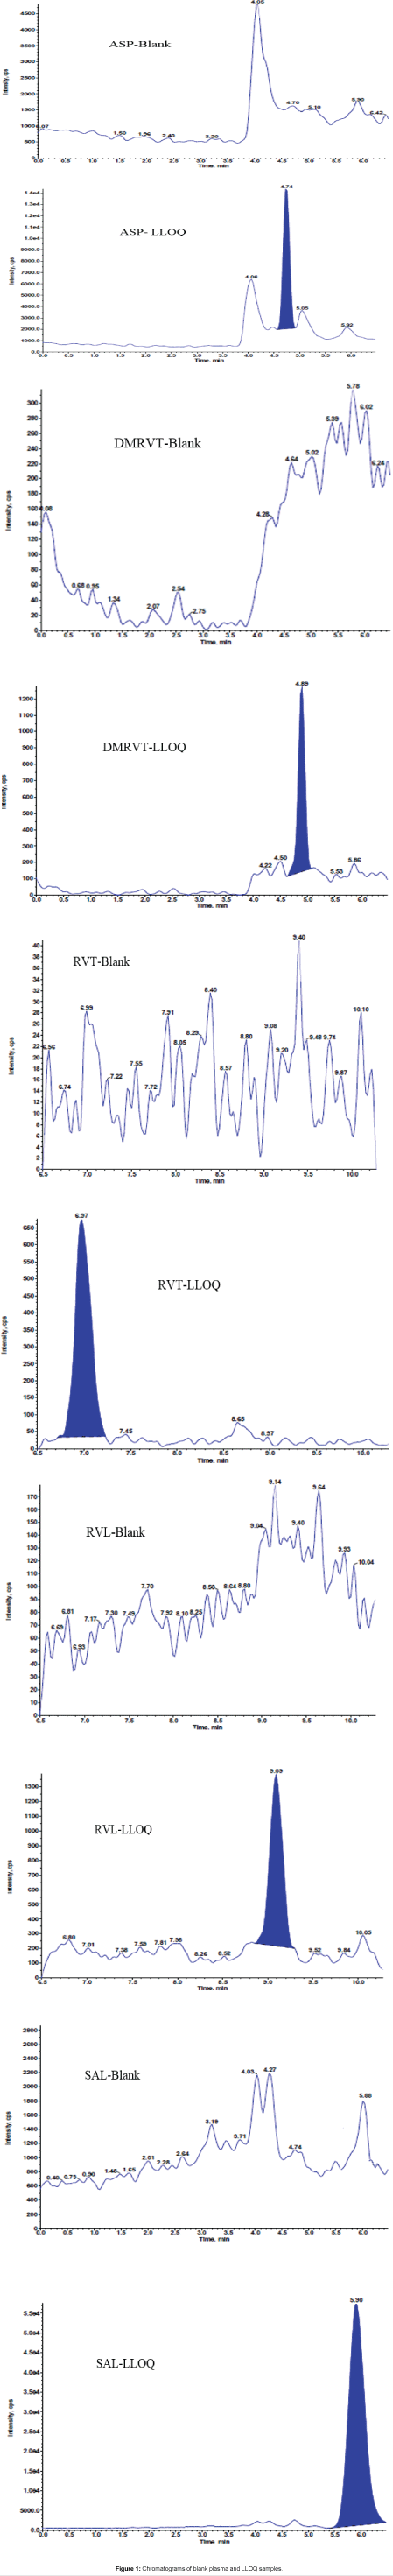
Figure 1: Chromatograms of blank plasma and LLOQ samples.
| Analyte# | Polarity | Q1 mass | Q3 Mass | Collision energy |
|---|---|---|---|---|
| DM RVT | negative | 466.2 | 404.1 | -23 |
| negative | 466.2 | 378.1 | -23 | |
| D6 DMRVT | negative | 472.2 | 410.1 | -22 |
| ASP | negative | 178.9 | 137.0 | -23 |
| negative | 178.9 | 92.9 | -16 | |
| SLA | negative | 137.0 | 65.2 | -20 |
| D4 ASP | negative | 182.9 | 141.0 | -11 |
| D4 SLA | negative | 141.0 | 69.0 | -40 |
| RVT | positive | 482.3 | 300.2 | 47 |
| RVL | positive | 464.3 | 296.2 | 44 |
| positive | 464.3 | 270.1 | 44 | |
| D3 RVT | positive | 485.3 | 261.2 | 47 |
| D6 RVL | positive | 470.3 | 276.2 | 41 |
Where: #for abbreviations refer Table 1
Table 3: Polarity, transitions and collision energy of all analytes along with internal standard.
Calibration curves, accuracy and precision, dilution integrity, and limit of quantitation
The method was linear with weighing factor (1/x2) in the range of 0.1-25 ng/mL for RVT, 50-10000 pg/mL for RVL and DMRVT, 5-2000 ng/mL for ASP and 0.1-8 μg/mL for SLA with intra and inter-day accuracy and precision within the acceptance criteria as per FDA and EMA guidelines (Table 4). The mean regression coefficient was >0.99 for all analytical run for all analytes.
| QC levels | RVT (ng/mL) | RVL (pg/mL) | DM RVT (pg/mL) | ASP (ng/mL) | SLA (µg/mL) | ||||||||||
|---|---|---|---|---|---|---|---|---|---|---|---|---|---|---|---|
| mean | Precision (%CV) | Accuracy (%) | mean | Precision (%CV) | Accuracy (%) | mean | Precision (%CV) | Accuracy (%) | mean | Precision (%CV) | Accuracy (%) | mean | Precision (%CV) | Accuracy (%) | |
| Intra-day | |||||||||||||||
| LLOQ | 0.109 | 7.9 | 108.2 | 45.90 | 6.4 | 91.5 | 52.5 | 12.1 | 101.4 | 5.01 | 3.1 | 100.3 | 0.101 | 2.8 | 101.3 |
| LQC-A | 0.313 | 6.3 | 103.4 | 147.82 | 5.5 | 98.8 | 152.7 | 5.7 | 98.7 | 16.29 | 3.5 | 108.4 | 0.316 | 6.0 | 105.4 |
| LQC-B | 0.871 | 3.4 | 95.8 | 413.87 | 4.4 | 92.2 | 434.3 | 2.9 | 93.7 | 45.34 | 2.1 | 100.5 | 0.876 | 1.5 | 97.5 |
| MQC-A | 6.546 | 2.1 | 103.8 | 2627.93 | 1.5 | 105.4 | 2674.32 | 3.2 | 103.8 | 465.53 | 2.2 | 103.2 | 1.930 | 0.9 | 107.3 |
| MQC-B | 11.402 | 1.0 | 96.1 | 4472.85 | 2.0 | 95.4 | 4649.00 | 2.7 | 96.0 | 811.91 | 1.2 | 95.9 | 3.536 | 0.8 | 98.3 |
| HQC | 21.435 | 1.9 | 102.3 | 8635.07 | 1.5 | 104.3 | 8789.88 | 1.8 | 101.8 | 1555.08 | 1.4 | 97.3 | 6.196 | 1.1 | 100.0 |
| ULOQ | 24.213 | 1.4 | 95.8 | 9747.50 | 1.1 | 97.0 | 9896.15 | 1.9 | 95.6 | 1849.64 | 0.8 | 92.4 | 7.605 | 1.1 | 95.1 |
| DQC | 89.973 | 1.1 | 114.1 | 35573.08 | 1.5 | 109.8 | 36805.28 | 2.4 | 109.9 | 6144.17 | 3.1 | 109.0 | 18.975 | 1.2 | 108.5 |
| Inter-day | |||||||||||||||
| LLOQ | 0.106 | 8.5 | 105.4 | 49.25 | 11.5 | 98.1 | 55.65 | 12.9 | 107.4 | 4.82 | 6.5 | 96.3 | 0.103 | 3.1 | 103.0 |
| LQC-A | 0.306 | 6.1 | 101.2 | 144.26 | 9.8 | 96.4 | 152.47 | 7.1 | 98.6 | 15.97 | 6.0 | 106.2 | 0.311 | 5.3 | 103.5 |
| LQC-B | 0.849 | 3.2 | 93.4 | 410.85 | 3.9 | 91.5 | 436.72 | 4.8 | 94.4 | 45.66 | 2.2 | 101.2 | 0.870 | 2.0 | 96.8 |
| MQC-A | 6.506 | 1.7 | 103.2 | 2606.55 | 1.6 | 104.5 | 2708.90 | 2.6 | 105.1 | 467.65 | 1.6 | 103.7 | 1.932 | 1.4 | 107.4 |
| MQC-B | 11.240 | 1.4 | 94.7 | 4455.64 | 1.5 | 95.0 | 4748.57 | 3.8 | 98.0 | 817.72 | 1.8 | 96.6 | 3.551 | 0.9 | 98.7 |
| HQC | 21.238 | 1.7 | 101.3 | 8547.07 | 2.2 | 103.2 | 8975.96 | 2.6 | 103.9 | 1567.00 | 1.5 | 98.0 | 6.198 | 1.0 | 100.0 |
| ULOQ | 24.416 | 1.6 | 96.6 | 9693.26 | 1.6 | 96.5 | 10315.39 | 3.4 | 99.6 | 1848.19 | 1.4 | 92.3 | 7.608 | 1.2 | 95.2 |
| DQC | 88.236 | 3.3 | 111.9 | 34854.84 | 3.1 | 107.5 | 37290.81 | 3.7 | 111.4 | 6138.27 | 2.3 | 108.9 | 18.695 | 3.0 | 106.9 |
Table 4: Intra-day and Interday accuracy and precision.
Selectivity, matrix effect, recovery, and carry over
No significant interference was observed in any lots of plasma samples (normal, lipemic, hemolysed). In addition, zero standards samples were prepared in duplicate from single lot of plasma and were analyzed to determine the interference at RT of respective analyte due to respective IS. No significant interference was observed at the RT of any analytes.
% CV of IS normalized matrix factor for all analytes was found within range of 0.6-3.7% for both LQC-A and HQC level (Table 5).
| Drug Level | Level | %CV of IS-normalized ME factor (%) | Absolute recovery (%) | Relative recovery (%) |
|---|---|---|---|---|
| RVT (ng/mL) | LQC-A | 2.7 | 98.2 | 98.0 |
| MQC-B | NA | 100.1 | 101.2 | |
| HQC | 1.1 | 102.4 | 101.5 | |
| RVL (pg/mL) | LQC-A | 3.2 | 93.4 | 104.2 |
| MQC-B | NA | 102.4 | 105.7 | |
| HQC | 1.0 | 101.8 | 102.9 | |
| DM RVT (pg/mL) | LQC-A | 3.7 | 93.5 | 84.5 |
| MQC-B | NA | 95.1 | 90.4 | |
| HQC | 1.9 | 91.6 | 86.7 | |
| ASP (ng/mL) | LQC-A | 1.3 | 102.4 | 101.0 |
| MQC-B | NA | 100.0 | 101.9 | |
| HQC | 1.0 | 102.6 | 101.1 | |
| SLA (µg/mL) | LQC-A | 1.0 | 100.6 | 102.7 |
| MQC-B | NA | 100.6 | 102.4 | |
| HQC | 0.6 | 100.6 | 103.1 |
Table 5: Matrix effect and recovery for all analytes.
Mean recovery (absolute and relative) values were approximately >85% for all analytes and IS, respectively. The difference in %CV of recoveries (absolute and relative) across each QC level was within 15% for all analytes (Table 5). There was no significant Injector carry over observed for any analyte and IS.
Extended accuracy and precision, ruggedness and robustness
The mean % nominal value and %CV were in range of 85-115% and less than 15%, respectively across all QC levels for all analytes. This indicates that method was accurate and precise over extended period to cover actual study samples analysis time.
The % CV, %nominal and %change of robustness and comparison samples were within acceptance limit with predefined changes in method.
The mean % nominal value and %CV were in range of 85-115% and less than 15%, respectively across all QC levels for all analytes. The % precision and % nominal were found within acceptance criteria.
Stability and re-injection reproducibility
The concentrations were calculated by the slope and intercept of calibration curve. The Mean concentration of plasma stability samples was evaluated in relation with the nominal values and %CV were also calculated by mean × 100/SD. %Accuracy for all analytes was found within 85-115%. Hence all analytes were considered to be stable in plasma with defined storage condition and duration. For BT stability in blood, area ratio of stability sample versus freshly prepared samples was compared and % change was found within 15% for said storage condition and duration. Similarly, for stock solution stability, area response of stability sample versus freshly prepared samples was compared and % change was found within 10% (Table 6).
| Stability | level | Mean (%CV) [% accuracy] | ||||
|---|---|---|---|---|---|---|
| RVT (ng/mL) | RVL (pg/mL) | DM RVT (pg/mL) | ASP (ng/mL) | SLA (µg/mL) | ||
| Bench-top stability plasma (RT, 6h) | LQC-A | 0.312(5.2) [103.1] | 140.4(3.9) [93.9] | 158.8(5.4) [102.7] | 15.8(6.6) [105.4] | 0.284(2.4) [94.8] |
| HQC | 22.378(1.3) [106.8] | 8320.9(1.4) [100.5] | 8746.6(1.9) [101.3] | 1547.6(2.7) [96.8] | 6.256(2) [101] | |
| Freeze-thaw stability (-20°C, 3 cycles) |
LQC-A | 0.285(4.3) [94] | 137(2.6) [91.6] | 147.4(4.8) [95.3] | 17(4.2) [113.4] | 0.3(3.5) [99.9] |
| HQC | 20.761(1.7) [99.1] | 8117.5(1.1) [98.1] | 8486.4(2.9) [98.3] | 1582.9(2.1) [99] | 6.059(1.2) [97.8] | |
| Freeze-thaw stability (-65°C, 3 cycles) | LQC-A | 0.284(3) [93.6] | 134.8(2.9) [90.1] | 160.4(8.2) [103.8] | 16.4(3.7) [109] | 0.292(1.3) [97.3] |
| HQC | 20.481(1.7) [97.7] | 8074.8(3.4) [97.5] | 9048.7(1.3) [104.8] | 1540.9(0.8) [96.4] | 6.059(0.5) [97.8] | |
| Auto sampler stability (6°C, 104 h) | LQC-A | 0.281(1.6) [92.8] | 132.6(3.3) [88.6] | 157.4(7.2) [101.8] | 16.1(2.4) [107.4] | 0.293(1.4) [97.5] |
| HQC | 20.395(1.4) [97.3] | 8009.6(1.8) [96.8] | 9509.2(3) [110.1] | 1518.9(1.2) [95] | 6.004(0.9) [96.9] | |
| Post extraction stability (RT, 6 h) | LQC-A | 0.301(7.6)[99.2] | 139.1(3.7)[93.0] | 148.1(7)[95.8] | 16.5(4.3)[110] | 0.302(3.4)[100.6] |
| HQC | 21.05(2.1)[100.4] | 8237.5(1.5)[99.5] | 8501.5(3.4)[98.4] | 1561.8(2.2)[97.7] | 6.19(2.3)[99.9] | |
Table 6: Stability studies for all analytes.
For re-injection reproducibility, the % change of more than 67% of reinjected QC samples was within ± 15% of back calculated concentration of previously analysed QC’s of P and A batch after 6 h. Hence it was concluded that any reinjection can be performed during study sample analysis if there is a case of instrument failure.
A novel, sensitive, selective, accurate and precise LC-MS/MS method was successfully developed for determination of ASP, SLA, RVT, RVL and DM RVT in K2EDTA human plasma. The method was validated according to standard guidelines and various experimental parameters were optimized. The extraction procedure exhibited excellent recoveries of all analytes including IS. This method offers advantage for simultaneous determination of clinically important and widely prescribed statin along with anti-platelet drug by a LC-MS/MS method with a pg/mL level of concentration which was considered as an immense challenge. The proposed method provides high throughput for determination of ASP, SLA, RVT, RVL and DM RVT in K2EDTA human plasma with excellent accuracy, precision, selectivity and reproducibility. The method established, can be used for study sample analysis from any BA/BE studies of aspirin with or without rosuvastatin oral dosage form.
The authors are grateful to the Sun Pharmaceutical Industries Limited, Tandalja, Vadodara-39020, and Gujarat, India for their Lab facility for this research work.