Journal of Oceanography and Marine Research
Open Access
ISSN: 2572-3103
ISSN: 2572-3103
Research Article - (2021)Volume 9, Issue 11
Because of coastal erosion and accretion, coastal zones are increasingly vulnerable to coastal devastation. Thus, coastal or shoreline calculation is a crucial aspect in manifesting coastal erosion and accretion, and it plays an important role in shoreline morphodynamic research. To investigate previous or present coastline positions or shape, the Digital Shoreline Analysis System (DSAS) can be utilized in HTA (Historical Trend Analysis). We used a diachronic analysis of aerial photographs and satellite images obtained between 1975, 2001 and 2018, as well as a topographic map from 2015, to analyze the changes occurring throughout the research area. The used methodology is based on geometric and radiometric corrections of aerial photographs and satellite images in order to digitize Tyre shoreline by DSAS version 5. This study focuses on the shoreline change detection along Tyre Shoreline from Qasmiye till El Naqoura linked with human intervention using digital shoreline analysis system (DSAS) and Remote Sensing during the period of 1975-2001, 2001-2018. The rates of shoreline changes in the form of erosion and accretion patterns are automatically quantified by two statistical parameters functioned in DSAS namely endpoint rate (EPR) and net shoreline movement (NSM). The results indicate that the regions have detected both erosion and accretion during the two periods. A period of 1975- 2001 has witnessed erosion in different regions especially in Qasmiye, Jal AL Bhar, Rachidiye, and Bahr Slaiyeb with total rate of erosion (-308.02 m), (-160.25 m), (-241.73 m), (-258.92 m) respectively. On the other hand, in the same period, some regions have revealed a small rate of accretion. At the period of 2001 -2018 Tyre shoreline has recorded a rate of erosion and accretion in almost most regions. LULC (land use and land cover) in this research confirm that the Tyre coastal area has been exposed to a dramatically changes, so settlements area (Harbor, hotels, resorts, roads net, industry, commercials etc.) has exacerbated at the expense of wetlands, sandy area, and vegetation during the period of 1975-2001 and 2001-2018. The shape of a beach and the surrounding estate is primary affected by wave conditions and tide levels. For this reason, different kinds of coastal management including sea walls, breakwaters were applied in Tyre shoreline.
Lebanon tyre; DSAS (Digital Shoreline Analysis System); Human intervention; LULC (Land use and Land cover); Coastal management
The coastal environment is a highly dynamic environment with many physical processes such as tidal inundation, sea level rise, and land subsidence; these processes all play a part in the formation of coastal landscapes [1]. The world's coastal areas are extremely important economically since they are home to around two-thirds of the world's population. The world's coastal zone is becoming increasingly stressed as a result of increased industrialization, trade and commerce, tourism, and the resulting human population growth and migration, as well as declining water quality [2].
A coastline is the line where a big body of water meets the land. Its shape and position are always changing due to one or more variables that can be morphological, climatological, or geological in character. Since millennia, beach erosion and accretion, as well as shifting shorelines and sea level rise, have been a persistent concern along most shorelines around the world, disrupting a dynamic equilibrium [3]. Coastal erosion is defined as the loss of coastal areas as a result of the net removal of sediments or bedrock from the shoreline. Coastal erosion is a natural phenomenon that happens when material transport away from the beach is not counterbalanced by new material being deposited on the shoreline. On time spans ranging from days to years, many coastal landforms naturally experience quasiperiodic cycles of erosion and accretion.
Coastal erosion can be classified as a:
• Emergent hazard (occurs very quickly, a period of days to week).
• Hazard with a slow onset (occurring over many years, or decade or centuries).
Coastal erosion is one of the most common marine geological disasters, and the hazard level of coastal erosion indicates that the range of coastal erosion may occur in the future due to the occurrence mechanism and damage characteristics of coastal erosion [5].
Following a submersion event, accretion is the process of coastal sediments returning to the visible area of a beach or foreshore. A healthy beach or shoreline will frequently undergo a cycle of submersion during storms and accretion during calmer times.
Understanding and establishing the process driving erosion and accretion requires quantitative investigation of shoreline change over timescales. (erosion and accretion [6] calculating sediment budgets [7], for coastal management and interventions [8], and as a foundation for morph dynamics modeling [9].
The form and position of shorelines are among the most basic markers for assessing changes in coastal areas. As a result, the Digital Shoreline Analysis System (DSAS) has been utilized to study the dynamics of shoreline movements and changes at both shorter and longer time scales.
Low-lying coastal areas such as Tripoli, Chekka, Amchit, Jbeil, Jounieh, Damour, Jiyeh, Saida, and Tyre are more vulnerable to erosion since they are more exposed to tides and have less natural defense systems. Significant erosion affects 45.24 percent of the Lebanese coastline (Lebanese national council for scientific research). A Study done by [9] demonstrates that the Litani River's coastline area to the south and north is currently undergoing substantial erosion. As a result, it was critical to investigate the changes along the Tyre waterfront utilizing diachronic analysis and remote sensing based on aerial photographs and satellite images from previous years.
The Digital Shoreline Analysis System (DSAS) is a free software tool that interacts with the ArcGIS software from Esri. It has been modified and upgraded throughout time, therefore there are several versions available, ranging from ArcView 3.2 to ArcGIS v10. A web-based version (DSASweb) was published in 2013. (USGS, 2013). Version 5.0 (v 5.0) of DSAS was released in December 2018, and it has been tested to work with ArcGIS 10.4 and most recent one. It is compatible with both Windows 7 and Windows 10. The Digital Shoreline Analysis System is used to compute the rate of shoreline change statistics from a time series of numerous shoreline positions. The U.S. Geological Survey's Coastal Change Hazards project relies on DSAS to deliver a strong suite of regression rates in a consistent and easily reproducible way that can be used to vast volumes of data collected at multiple scales. DSAS is suitable for any general application that involves calculating positional transformations over time, such as assessing changes in glacier boundaries in historical aerial pictures, river edge borders, or changes in land use/land-cover [10]. The software is intended to aid in the computation of shoreline change, as well as to provide rate-ofchange information and arithmetical data required to ensure the consistency of the computed findings [11]. It contains three primary components that define a baseline, produce orthogonal transacts that indicate separation along the coast, and compute rates of change using various models or approaches such as linear regression rate, endpoint rate, average of rates, and so on. [12]. The most essential application of DSAS is the use of many layers to represent a given shoreline feature (e.g. mean high water mark, cliff top) at a specific period. Shoreline Change Envelope (SCE), End Point Rate (EPR), Net Shoreline Movement (NSM), Linear Regression Rate (LRR), and Weighted Linear Regression Rate (WLR) are among the statistical change metrics accessible in DSAS, and are based on the assessment of shoreline positions over time. For prediction patterns of shoreline behavior, the DSAS derivation of past rate of change trends as an indicator of future trends has been utilized, assuming continuity in the physical, natural, or anthropogenic forcing that has pushed the historical change observed at the location [13].
In a broader sense, DSAS in HTA can be used to:
• Historical coastline position mapping during the time span covered by available spatial data (e.g. maps, aerial pictures);
• Individual or chosen transects' historical changes and trends are assessed (discrete alongshore positions). Shoreline change is estimated at specified transects within DSAS, and the timeseries of change at specific sites can be assessed using the DSAS output.
• The study of shoreline geometry, such as foreshore steepening (using the distance between mean high and low water marks and orientation (to look at rotating tendencies, for example)
• To anticipate patterns of shoreline behavior by using historical rate of change trends as an indicator of future trends, given that the physical, natural, or anthropogenic forcing that has caused the historical change observed at the site remains constant.
DSAS program has some drawbacks, the most significant of which is that when more than two shorelines are accessible (EPR), the information regarding shoreline behavior offered by extra shorelines is ignored. Changes in the sign or magnitude of the shoreline movement trend may thus be overlooked.
Because of their ability to show cumulative shoreline movement (NSM) and time variations (EPR), which encapsulate the raterange of the historical data set, the choice of DSAS in this study was able to explore the temporal and spatial dynamics of coastal change and geomorphic variability along the beach, despite a minor drawback. It aided us in digitizing and detecting changes in the shoreline.
[14] find the trend in shoreline alterations, as well as the variables that have caused them. The shoreline of Watamuarea in Kenya was digitized using aerial pictures from 1969 and 1989, as well as a current satellite image from 2010. Transects and statistical studies for the shoreline were created using the Digital Shoreline Analysis System (DSAS) in the ArcGIS environment. Several GPS locations were acquired during ground truthing in the aftermath of the High Water Mark in October 2013 and 2014 (HWM). To calculate the change rates, the 9.8 km long Watamu shoreline was divided into 245 transects with 40-meter spacing. The End Point Rate (EPR), Net Shoreline Movement (NSM), and Weighted Linear Regression (WLR) statistics in DSAS were used to calculate the rates of shoreline change.
[15] used multi-temporal satellite imagery from 1978 to 2013 to analyze the Nagapattinam district of Tamil Nadu, India. Using the Digital Shoreline Analysis System, the long-term coastal erosion and accretion rates were computed (DSAS). The shoreline change rate is estimated using the Linear Regression Rate (LRR) statistical approach. According to the findings, erosion is ten dominants in the taluks of Sirkali, Tharangambadi, Karaikal (Puducherry State), and Nagapattinam, while Thiruthuraipundi is undergoing.
[16] used Landsat images (MSS, TM and ETM+) between 1972 and 2007 along the northeastern coastline of Nile Delta in Egypt. These photos were processed to determine erosion and accretion patterns. from Gamasa to Port Said, along the Nile Delta's northeastern coast. Shoreline change rates were determined using automated waterline positions obtained by a Digital Shoreline Analysis System at 852 sites (DSAS). The results show that there is general erosion and accretion along the shoreline.
[12] used DSAS ArcGIS 10.2.1. to study a Time series analsyis of shoreline change along the coastline of river state, Nigeria at the period of 1984, 2000 and 2016. Both erosion and accretion were found to be active throughout practically the entire coastline, according to the study. It revealed that around 70% of the coastline was eroding over the chosen years, whereas 30% of the territory underwent varied degrees of accretion. Along the river mouth side of the coast, around the bar beach, a high rate of accretion was also noted.
[17] Has studied a shoreline change and land- use/land-cover along the coastal districts of South Gujarat using DSAS. The Digital Shoreline Analysis System (DSAS) uses the digitized shoreline in vector format (. shp) to compute the rate of shoreline change for the years 1990, 2001, and 2014/. The analysis found that the eroding trend of the shoreline at an End Point Rate of -0.54 m/yr is highly worrying, especially from a sustainability aspect. According to LULC maps and findings, this district encompasses sensitive ecosystems such as mudflats and salt marshes, and hence future environmental degradation along these coasts could disturb the environment's normal functioning.
Study has been done in Gaza to indicate Time Series Analysis of GAZA strip shoreline from 1972 to 2012 using DSAS by (Adwan,Maher and El-Hallaq et al.,2016). Seven satellite images (MSS, TM, and +ETM Landsat) were gathered for this study. According to the findings, the Gaza Strip coastal zone can be divided into seven zones based on the rate of change and governorates: A) Rafah 2.4 km B) Khan Younis 10.4 km C) Southern of Middle Governorate 8 km D) El-Wadi region, 2.4 km; E) southern Sea port, 6.4 km; F) northern Sea port, 3 km; and G) North Gaza Governorate, 6.2 km.
The results showed that the regions A, B, and C were exposed to accretion in the first five periods, but that erosion became more severe in the last five periods, and that the region D was exposed to erosion throughout the period 1972-2012, with average annual erosion rates and rates of change of 2,120 m2 and 1.23 m, respectively. The south side of Gaza's sea port (area E) has seen the most significant alterations.
Tyre Shorline is notable with its maritime location, for it is located on Lat: 330, Lon 350 coordinate system, it is situated along the Mediterranean coast, around 80 km south of Beirut, and 26 km north of the international border. The study area Figure 1 and 2 starts from Qasmiye north of Tyre to El Naqoura south of Tyre at a distance of 34.9 kilometers.
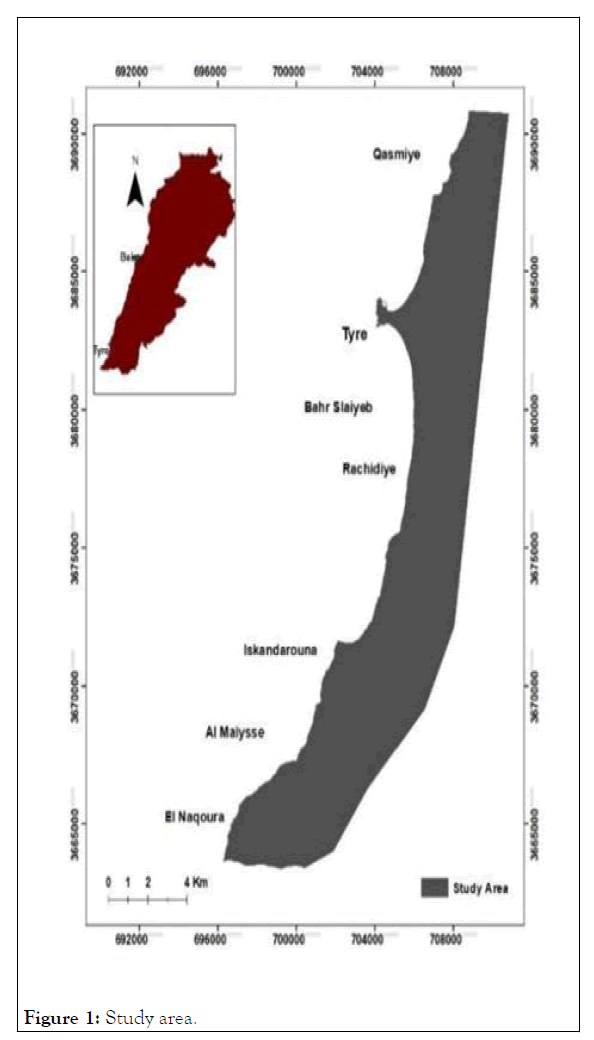
Figure 1: Study area.
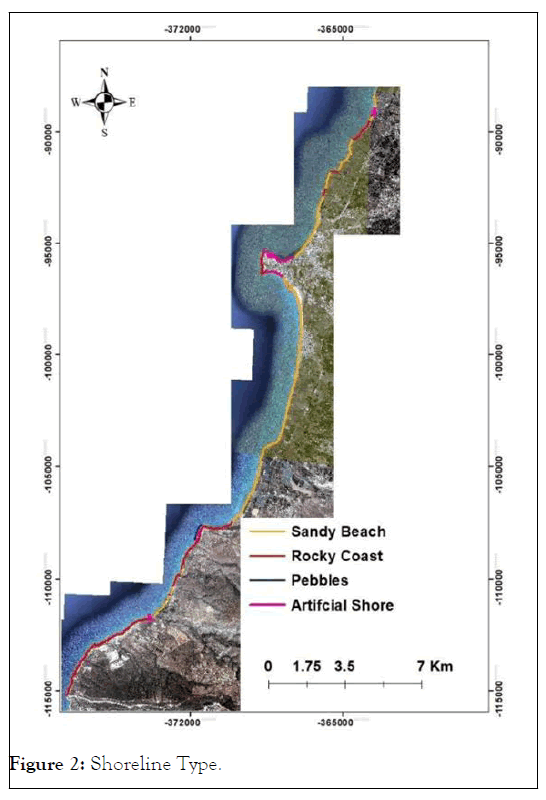
Figure 2: Shoreline Type.
One of the largest and wealthiest plains along the Lebanese coast is the Tyre Costal region. Orchards and other agricultural grounds, many of which employ residents in Tyre's coastal zone.
It has a Mediterranean climate with four seasons, wet winters and long, dry summers. Tyre's coastal zone is a densely populated area marked by significant levels of immigration, which have been a feature of this region since the late 1800 sec. Also A diverse spectrum of economic, commercial, and recreational activities are attracted to this location.
Tyre is one of the Middle East's five most beautiful beaches, thanks to its crystal clear water, sandy beach, and reputation as a diving destination for sunken Roman remains.
The Nature Reserve is located near Tyre, which was listed as a World Heritage Site by the United Nations Educational, Scientific, and Cultural Organization (UNESCO) in 1984. The properties that make up the park cover 380 ha and are organized into three zones: tourism, agriculture and archeology, and conservation.
The Tyre shoreline was a mix of sandy, pebbled, rocky, and manmade. There is a sandy, rocky, and artificial coast at Qasmiye.
Jal El Bahr has a sandy beach, whereas Tyre Tombolo has a rocky, artificial and pebble beach.
We also discovered that the sandy beach extends to Bahr Slaiyeb and Rachidiye beach, and that the coastline to the south of Sour has the longest and largest stretch of sandy beaches, Despite the systematic removal of sand during the last two decades.
There are rocky, artificial, sandy, and pebbles beaches south of Rachidiye.
Previous study at tyre shoreline
Tyre's shoreline is vulnerable to both erosion and accretion, according to a prior research. Between 1962 and 2002, the beach on the northern part of the Tyre shoreline receded around 70 meters [18]. There are numerous sand pits in the dune area south of the city, indicating a sand shortage. The beach retreat in this location (El Mansouri) is estimated to be 20-40 meters, with sand providing major biological value as a nesting site for sea turtles (caretta carreta) [19] in Naqoura, a sediment deficit is visible in the steep pebble beach on which waves break during winter storms, and parts of an old track rail way resting on a 2 m platform [20] collapses into the sea due to coastal erosion of instable beaches. Moreover, it is estimated that the lack of sediment in Plage de Minet el Ramol is responsible to 15000 m3.
Data acquisition
Data can be obtained from a variety of sources. Ground surveys, aerial photography, and satellite imaging are among them.
Digitizing and analyzing the change of Tyre shoreline during the two mentioned period required a raster data for this period, Table 1:
| Data | Acquisiti on data | Scale | Resolution (m) | Origin |
|---|---|---|---|---|
| Topography Map | 2015 | 1/20000 | - | Directorate of Geographic Affairs |
| Aerial Photographs | 1975 | 1/25000 | 1 m | Directorate of Geographic Affairs |
| Satellite Imagery | 1975 | 1/25000 | 2 m | Corona Imagery (American Satellite Photography) |
| Satellite imagery | 2001 | 1/20000 | 1 m | Directorate of Geographic Affairs |
| Satellite imagery | 2018 | 1/20000 | 50 cm | Directorate of Geographic Affairs |
Table 1: Description of available data.
• Topography map for the year of 2015 with 1/20000 scale has been derived from Directorate of Geographic Affairs.
• Aerial photography from the Directorate of Geographic Affairs for the year 1975, with a resolution of 1 m and a scale of 1/25000, covered the entire area except for a small section south of Eskandroun, which was destroyed as a result of the Lebanese-Israeli war, which prevented a safe flight state.
• Satellite imagery for the absence part for the year of 1975 has been derived from Corona Imagery (American Satellite Photography) with resolution 2 m and 1/25000 scale.
• The Directorate of Geographic Affairs has provided a completed satellite image for the year 2001, with a resolution of 1 meter and a scale of 1/ 20000.
• A completed satellite picture for the year 2018 has been produced from the Directorate of Geographic Affairs, with a resolution of 50 cm and a scale of 1/2000.
Geometric correction
Geo-referencing
Geometric distortions are seen in satellite photos and aerial photography, which cover a different geometry than that of a map. There are numerous sources of geometric in accuracy. Panoramic distortion, orientation, earth's rotation, instrument mistake, and platform instability [21].
In this study, geometrical correction is crucial to lessen the errors during digitizing the shoreline. Satellite imagery for the year of 1975, Aerial photography for the year of 2001 and the year of 2018 needed a geo-referencing. Geo-referencing has been done at ArcMap 10.8 software using topography map for Tyre coastal area for the year of 2015 with 1/20000 scale.
We chose in this study third order polynomial which is as higher transformation order with about 70 links for each map. Common fixed points (crossing roads, hospitals, hotels…) between maps and topography map have been located. Difficulties during geo-referencing appeared during finding big numbers of layout points in the littoral zone that have homogeneity between references map and the photograph, for it is due to many reasons:
• Difference scale between the photograph and topography map.
• Photo interpolation is challenging owing to a lack of relevant details and poor resolution.
• Deviation during shoot of photos
A root mean square error is shown in Table 2.
| Raster data | Root mean square error (m) |
|---|---|
| Satellite imagery 2001 | 7.6 |
| Satellite imagery 2018 | 5 |
| Aerial photographs 1975 | 9.5 |
Table 2: Geo-referencing root mean square error.
Resampling
Resampling, or adjusting the cell size, is another common raster pre-processing activity. Resample for raster grid is useful for a variety of reasons, including satisfying the needs of a mapping project, having the same cell size as other raster grids in an analysis, lowering processing time, and reducing file size. As a result, resampling was used to create a new image that was more obvious. As a result, resampling was used to create a new image that is more visible, with all pixels accurately positioned inside the terrain coordinate system, allowing for more accurate feature extraction methods.
Ortho-rectification
After resampling, Ortho-rectification is performed to remove internal and external distortions and assign more precise coordinates to the final image.
Mosaicking
After Ortho-rectification, we used Mosaicking to integrate two parts of 2001 aerial photography with each other, as well as two sections of 2018 satellite images. Also, we combined 11 portions of aerial photography from 1975 with each other, and then we combined this mosaic with the final component.
Projection and re-projection
Aerial photo 1975 (WGS 184 UTM-ZONE 36 N) and topographic map projection (WGS 184 UTM-ZONE 36 N) were both identified. We also changed the projection of the 2018 satellite picture (from SGL-Stereo to WGS-184 UTM Zone 36 N).
Radiometric correction
Using a map algebra formula, a radiometric correction was performed for the two satellite photos for the years 1975, 2001, and aerial photography for the year 2018,
respectively: Landsat image/(Sin of Earth – sun Distance)
Digitizing shorelines
Digital Shoreline Analysis System (DSAS 5.0), has been used to analyse the historical change in shoreline for the digitized shoreline coordinates, an ArcGIS geodatabase was generated with the Tyre shorelines attributes tables, which included year, ID, shape, and uncertainty. We have chosen 10 m for uncertainty. Four steps have been applied during this process:
Step one: Configure default parameters, such as transects, shoreline calculations, metadata, and log file output.
Step two Cast transects: Create a transect geodatabase, a casting method based on smoothing distances, a transect metadata file, and a casting method utilizing smoothing distances.
Step three: Individual transects can be edited, the baseline can be changed, and individual transects can be edited directly.
Step four: Compute the change statistics, taking into account the process data. In this study, the confidence interval is 95.5%.
Two statistical methods were used to calculate the change in rates of shoreline from 1975 to 2001 and from 2001 to 2018. The methods were End Point Rate (EPR), Net Shoreline Movement (NSM).
Net Shoreline Movement (NSM)
It is the distance between the oldest and the youngest shorelines for each transect and Shoreline Movement.
NSM= distance (m) between oldest and youngest shorelines.
End Point Rate (EPR)
The end point rate is calculated by dividing the distance of shoreline movement by the time elapsed between the oldest and the most recent shoreline.
The major advantages of the EPR are the ease of computation and minimal requirement of only two shoreline dates.
EPR = NSM/Time between oldest and most recent shoreline
The Characteristics of Cast Transect is mentioned in table below, Table 3.
| Baseline Placements | Distance from baseline to shorelines | Transect Spacing | Smoothing Distance |
|---|---|---|---|
| Off Shore | 2000 m | 20 m | 2500 |
Table 3: Characteristics of cast transect.
Classification of regions on the study area
We split the study area into 16 regions as indicated in Table 4 based on the length of the study area, the results of DSAS maps, and the classification of this region.
| Region | Symbol |
|---|---|
| A | Qasmiye |
| B | El Bourghliye |
| C | Chabriha |
| D | Jal El Bahr (Baqbouq) |
| E | Tyre Archaeological site |
| F | Rest House |
| G | Bahr Slaiyeb |
| H | Rachidiye |
| I | Ras el Ein |
| J | El Malikiye+El Qlaile |
| K | El Henniye+El Mansouri |
| L | El Bayada |
| M | Iskandarouna |
| N | Ras El Draijat |
| O | Al Maiysse |
| P | El Naqoura |
Table 4: Regions symbol on the study area.
LULC (land use and land cover)
Due of the difficulty of applying the LULC model to the maps discussed in the digitizing section, we created new maps that are simpler. The dates were chosen based on a time series, data availability, and data quality. Landsat imagery was utilized to determine LULC changes. Three Landsat images were downloaded from the USGS Earth Explorer (https:// earthexplorer.usgs.gov/) for the years 1975, 2001, and 2020, with polygons for Lebanon. These data used for the performing of LULC maps via GIS the software of Arc Map 10.8 Characteristics of each image are shown in Table 5, We followed the identical methods in radiometric and geometric corrections as we did in the previous section. Maximum Like-Hood Classification (MLC) has done to detect the change in land use and land cover (LULC) in study area through the period of 1975-2001 and 2001-2018. All the images were studied by assigning per-pixel signatures and differentiating the catchment into 7 classes, Table 6.
| 1975 | 2001 | 2018 | |
|---|---|---|---|
| Satellite | Landsat 1-5 | Landsat-7 | Landsat-8 |
| Projection | UTM | UTM | UTM |
| UTM Zone | 37 | 36 | 36 |
| Datum | WGS 84 | WGS 84 | WGS 84 |
| Sensor | MSS | OLI_TIRS | OLI_TIRS |
| Resolution (m) | 60 | 30 | 30 |
| Acquisition data | Nov 11, 1975 | Jun 09, 2001 | Sep 18, 2018 |
Table 5: Detailed information about the Landsat pictures that were used in the investigation.
| Class | Descriptions |
|---|---|
| Cultivated area | Crop fields and fallow land. |
| Settlements area | Industry, transportation, residential, transportation, commercial, mixed urban, roads. |
| Bare soil | soil , sand that is not covered by grass, sod, other live ground covers, wood chips, gravel, artificial turf, pavement or similar covering. |
| Vegetation | Forest, woodland, grassland, wetland, shrub land. |
| Water body | River, open water, lakes, ponds and reservoirs. |
| Sandy coast | Sands, sand bar. |
| Wetland | Salt marshes (Salinas), mangrove swamps, reed swamp, rush swamp, and seagrass beds, shallow (up to 5 meters) lagoons and lakes. |
Table 6: Descriptive data for each class.
We have calculated Overall accuracy of LULC for the year of 1975, 2001 and 2018 have got by applied accuracy formula:
Accuracy% = Total value/Total sample*100
And we applied Kappa Coefficient (T) to determine Kappa:Results
Regions
We classified a study area into 16 regions Figure 3 depending on Table 4, to facilitate interpolation of results.
Figure 3: Region Symbol.
According to Figure 4 and Figure 6, we can deduce that the high rate of erosion between the years of the period (1975-2001), has happened at many regions especially at Qasmiye north of Tyre and at Bahr Slaiyeb South of Tyre with -6.11 m/ year and -2.75 m/ year as a maximum EPR, the total erosion that happened in this period (NSM) is ranged between - 158.85 m/period and -73.39 m/period as maximum and between -73.88 m/period and -21.72 m/period as minimum.
Figure 4: EPR for Tyre Shoreline (1975-2001).
Accretion between the years of this period has happened in different site: El Bourghliye, and Ras el draijat with a mimum rate that ranged between 0.56 m /year and 3.20 m/year, while the total accretion is varied between 14.07 m/period and 83.31 m/period as a minimum rate of accretion and 83. 31 m/period and 233.37 m/period as maximum rate of accretion.
We recognized from Figure 5 and Figure 7 that there are some regions has changed from the rank of erosion to the rank of accretion during the years of the period that extend from (2001-2018), Qasmiye is shifted from erosion to accretion as shown in Figure 5 and Figure 6.
Figure 5: EPR for Tyre Shoreline (2001-2018).
Figure 6: NSM for Tyre Shoreline (1975-2001).
Figure 7: Total erosion and accretion during the two period.
El Henniye, El Mansouri and El Bayda and Iskandrouna also has demonstrated accretion at the second period. While Erosion are shown in Jal El Bahr, Rachidiye and some sections of Bahr Slaiyeb.
Table 7 represents a total Erosion and Accretion (EPR): summation all EPR that happened in each region that happened during the two periods: 1975-2001 and 2001-2018, noticing that every region carried out both erosion and accretion in each polygon of transect.
| Region | Period 1975-2001 | Period 2001-2018 | ||
|---|---|---|---|---|
| Erosion | Accretion | Erosion | Accretion | |
| A | -308.02 | +154.81 | ||
| B | +42.77 | +31.36 | ||
| C | -15.73 | +22 | ||
| D | -160.25 | -63.39 | ||
| E | +4.28 | -1.06 | ||
| F | -4.57 | +32.17 | ||
| G | -258.92 | -6.21 | ||
| H | -241.73 | -36.69 | ||
| I | -45.05 | -1.77 | ||
| J | -212.22 | -18.61 | ||
| K | -43.81 | +67.97 | ||
| L | -15.85 | +79.37 | ||
| M | -44.75 | +80.04 | ||
| N | +15.06 | -2.44 | ||
| O | +7.68 | +6.58 | ||
| P | +7.12 | -1.83 | ||
Table 7: Total erosion and accretion during the two period.
Region A (Qasmiye) show a high erosion that happened in the period of 1975-2001 -308.02 m and a clear accretion with +154.81 m/year that happened in the period of 2001-2018, While region B (El Bourghliye) has stayed in accretion position with +42.77 m/year during the first period (1975-2001) and +31.36 m/year during the second period (2001-2018). Region C (Chabriha) has witnessed small erosion - 15.73 m/year during the first period and +22 m/year during the second period. Region D (Jal El Bahr, Baqbouq) has recorded high erosion with -160.25 m/year -63.9 m/year during the two period respectively. Region (E) that represent a sea wall that protect Tyre archeological site (southern of Tyre), has showed small accretion during first period 1975- and small erosion in the second period.
Region F (Rest house), has registered erosion at the first period and accretion at the second period.
Bahr Slaiyeb (region G) has witnessed a big erosion at the first period - 258.92 m/year and small erosion during the second period -6.21 m/year during the second period.
Region H (Rachdiye) Beach has recorded erosion during the both period -241.73 m/year and -6.21 m/year respectively. Regions I (Ras el Ein) and J (El Malikiye+El Qlaile) has registered erosion during the both period, while Region K (El Henniye+El Mansouri) has recorded erosion at the first period and accretion during the second period.
Small erosion has happened in El Bayada (region L) during the first period then it changed to accretion during the second period, it changed from -15.85 m/year to +79.37 m/year. Region M Iskandarouna has registered total erosion of -44.75 m/year at the first period then it changed into psotive sign at the second period +80.04 m and this is due to break waters management. Region N (Ras el draijat), has recorded a small accretion in the first period and a little bit of erosion -2.44 m/ year. Al Maiysee region (O) has showed accretion during the two period with +7.68 m/year during the first period and +6.58 m/ year during the second period.
Depending on the table we see an erosion and accretion has happened in El Naqoura region (P) which is rocky coast that characterise by its fragile and weakness in face erosion [22].
Land use relates to how lands are used, such as for agriculture, recreation, and wildlife habitat.
Identification Both baseline mapping and subsequent monitoring are included in land use.
Time series data on LULC is vital for determining what type of land we have, what type of use we make of it, and detecting variations in land use from year to year.
Current systems for monitoring environmental changes and managing natural resources include land-use and land-cover (LULC) change as a key and crucial component. [23].
The rate of change is worrying, and it has the potential to have a significant influence on the local, regional, national, and global environment [24].
The overall accuracy for the year of 1975 is equal to 97%, the year of 2001 is 95.6%, the year of 2018 is 97.4%.
The MLC classification yielded kappa coefficient in this study is 0.96 for the year of 1975 and 0.95 for the year of 2001 and 0.97 for the year of 2001, indicating very high agreement with the ground truth.
Area in km2 and % of total for the identified years has shown clearly in Table 8 and Table 9 in order to detect changes and compare between them in easy way study area in 1975 is 110.74 km2, 2001 is 112.5 km2, 1975 is 112.49 km2, the biggest part of the study area is covered by Bare soil, cultivated area and vegetation, followed by settlements area.
| 1975 | 2001 | 2018 | ||||
|---|---|---|---|---|---|---|
| Land use type | Area, km2 | % of total | Area, km2 | % of total | Area, km2 | % of total |
| Wetland | 7.02 | 6.34 | 6.47 | 5.75 | 5.97 | 5.31 |
| Cultivated area | 32.51 | 29.36 | 32.55 | 28.92 | 33.68 | 29.94 |
| Water body | 2.3 | 2.07 | 0.77 | 0.68 | 0.92 | 0.82 |
| Sandy coast | 5.22 | 4.72 | 4.79 | 4.26 | 3.96 | 3.52 |
| Settlements area | 7.39 | 6.67 | 17.16 | 15.25 | 18.16 | 16.14 |
| Bare soil | 32.51 | 29.36 | 21.41 | 19.02 | 15.95 | 14.18 |
| Vegetation | 23.8 | 21.49 | 29.41 | 26.13 | 33.85 | 30.09 |
| Total | 110.74 | 100 | 112.5 | 100 | 112.49 | 100 |
Table 8: Area and Percentage for LCLU.
| 1975-2001 | 2001-2018 | 1975-2018 | ||||
|---|---|---|---|---|---|---|
| Land use type | Area, km2 | % of total | Area, km2 | % of total | Area, km2 | % of total |
| Wetland | -0.55 | -0.59 | -0.5 | -0.44 | -10.5 | -1.03 |
| Cultivated area | -0.04 | -0.44 | 1.13 | +1.02 | +1.17 | +0.58 |
| Water body | -1.5 | -1.39 | 0.15 | +0.14 | -1.38 | -1.22 |
| Sandy coast | -0.43 | -0.46 | -0.83 | -1.26 | -1.2 | |
| Settlements area | +9.77 | +8.58 | +1 | +0.89 | +10.77 | +9.47 |
| Bare soil | -11.1 | -10.34 | -5.46 | -4.84 | -16.56 | -15.18 |
| Vegetation | +5.61 | +4.64 | +4.44 | +3.96 | +10.05 | +8.6 |
Table 9: Change of LULC area between the three periods (1975-2001) (2001-2018) (1975-2018).
The smallest part includes sandy area, water body and wetlands.
Between 1975, 2001 and 2018, Tyre coastal area has experienced significant land use changes.
Figure 8 and Table 8 showing that settlement area has increased from 7.39 km2 with 6.67% in 1975 17.6 km2 with 15.25% in 2001 to 18.6 km2 with 16.14% in 2018, As a result, Tyre coastal area, has experienced tremendous urban growth in the previous two decades.
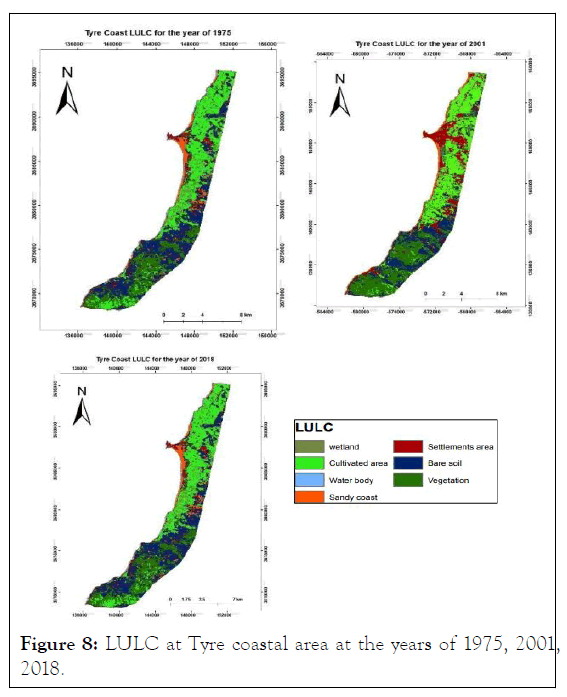
Figure 8: LULC at Tyre coastal area at the years of 1975, 2001,2018.
Bare soil reduced from 32.51 km2 with 29.36% in 1975 to 21.14 km2 with 19.02% in 2001 to 15.94 km2 with 14.18%. This declining covers also sandy area which occupies a very small section in the study site, so it decreased from 5.22 km2 in 1975 to 4.79 km2 in 2001 to 3.96 km2 in 2018.
While Vegetation soils have increased gradually from 23.8 km2 with 21.49% in 1975 to 29.41 km2 with 26.13% in 2018 to 33.85 m2 with 30.09%.
Cultivated area has increased from 32.51 km2 with 29.36% in to 32.14 km2 with 28.92% in 2001 to 33.68 km2 with 29.94% this increasing comprise areas that are far from shorelines.
We also distinguished a clearly diminishing in water body as revealed in Table 9, so it has registered -1.5 km2 with -1.39% at the period of 1975-2001, and - 1.38 km2 with -1.22% at the period of 1975-2018.
Wetland represented also negative sign at the period of (1975-2001) with -0.55 km2 and -0.59% and decreasing trend at the period of 1975-2018 -10.5 km2 with -1.03%.
Figure 9 represent different types of coastal management in Tyre shoreline. The geoarchaeological data shows that the center of the ancient northern seaport is presently submerged under the medieval and modern city hubs. Nowadays, Tyre “northern” or “Sidonian” is located in the north of the city it is a sheltered bay that is protected by reef sandstone. Cornishe in Tyre are located in different site as mentioned in the map above.
Since decades, the Tyre coastal zone has been protected by natural rocks, artificial sea barriers, and breakwaters. Breakwaters located at differet sites as mentioned in Figure 9.
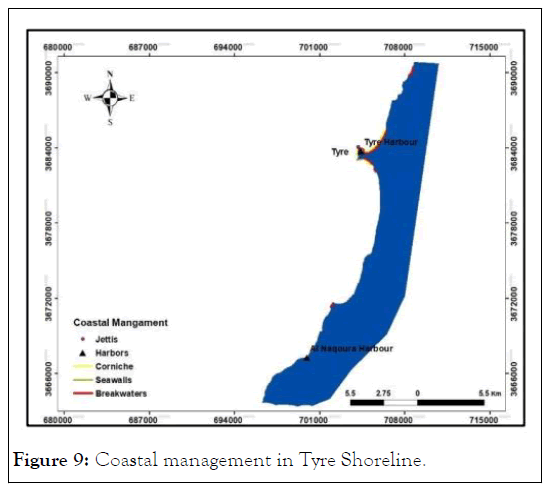
Figure 9: Coastal management in Tyre Shoreline.
• East of the northern harbor of distance 956 m.
• Al Cornish Al Bahry South of Tyre of distance 512 m.
• Al Eskandron shoreline of about 750 m.
• Rest house break waters.
• Randomly breakwaters were settled on different sites south of Ras el Ein which we couldn’t put it on the map due to its small area.
Sea walls have been set in altered sites:
• Sea wall of Tyre Archaeological site (south of Tyre city).
• Sea wall in Al Naqoura shoreline that were built to protect an ancient railway, noticing that it was hard to put it in the map due to a difficulty to sketching its location.
Jetty:
There is Jetty located at Al Khabrab at the west of Tyre harbor.
Extensive sand removal Figure 10 occurred within last 50 years, as result an important coastal retreat is obvious on north and south of Tyre. Lack of control by Lebanese administration and lack of rules during Israeli military occupation (1977-2000), let illegal sand extraction to occur along the shore.
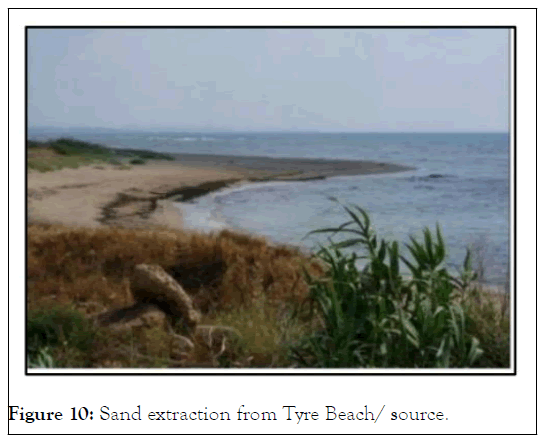
Figure 10: Sand extraction from Tyre Beach/ source.
Natural sand dunes have been exploited for construction, with an estimated 1.5 million cubic meters of sand collected each year; this has contributed to coastal destabilization, as well as coastal erosion and hydrodynamic changes [25].
The rate of contravention on Tyre shore beach is about 367 contraventions with about 468000 m2 to 973000 m2. Construction of tourism facilities, restaurants and different kind of settlements on Tyre coastal zone frequently requires clearing vegetation land and beach fill.
According to Ministry of Public Works and Transport, 2013, the total contravention sites on Tyre shoreline include:
• Private structure located on Qasmiye beach with 7680 m of sea fills.
• Private structure located on Qasmiye beach, with 20100 m of sea fills.
• Islamic university that built on Tyre shoreline with 1350 m of sea fill.
• Rest house.
• Private agriculture planning on Qasmiye beach lead to fill about 85.400 m.
• Private agriculture planning on Jal El bahr beach lead to fill about 10800 m
• Tyre Northern Cornishe with 935.9 m as length.
• Tyre Southern Cornishe with 510.07 m as length.
• Al kahrab Cornishe with 535 m as length.
In Addition to that most of most refugee camps are located on the sea or far a bit from sea which represent a demographic, urban and economic pressure at Tyre Coastal area.
TYRE TOMBOLO
Tombolo grows mostly in shallow regions within island walls, where sufficient sediment supplies, as well as wave and wind action, contribute to beach buildup.
Many experts believe that the Tyre Peninsula was formed as a result of human interference in the coastal process, which hampered the regional longshore tides system. The impacts of human interference on tombolo begin during the age of Alexander and Macedonian forces, when they were at their most sophisticated form. During this period, Alexander built a causeway that connected the Isle to the mainland Figure 11, which was the most complex coastal engineering project of the time. Tyre's tombolo comprises a W–E-trending salient, 1500 m long by 3000 m wide and lies 9 km south of the Litani estuary [26].
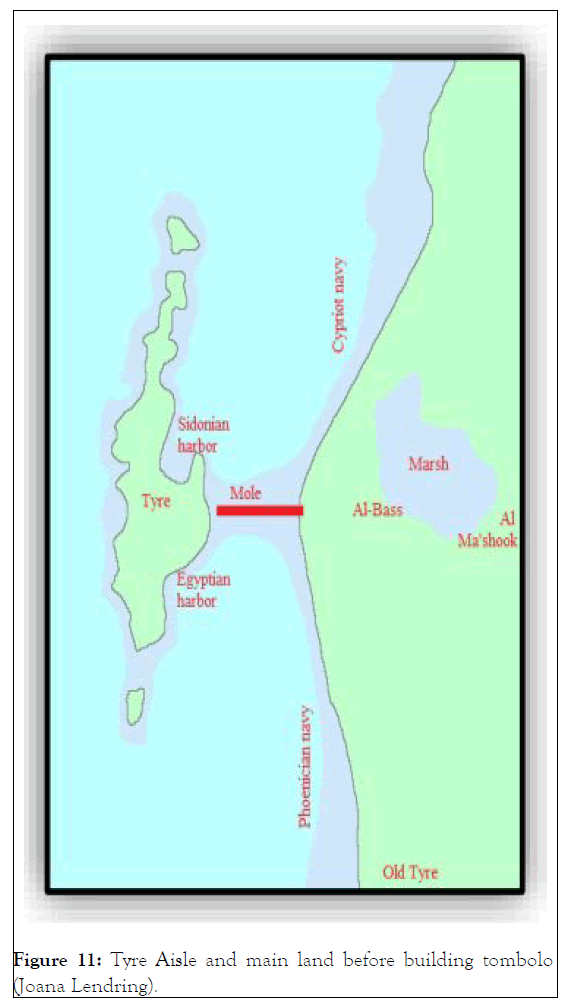
Figure 11: Tyre Aisle and main land before building tombolo (Joana Lendring).
Figure 12 depicts the evolution of the Tyre Tombolo from 1930 (A) to 2001 (B)..Source: Père Poidebard (A) / Directorate of Geographic Affairs (B).
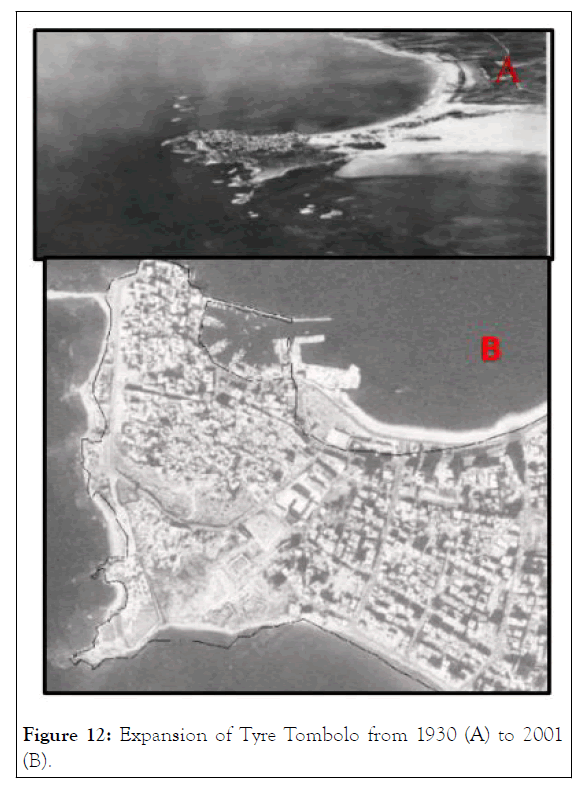
Figure 12: Expansion of Tyre Tombolo from 1930 (A) to 2001 (B).
According to DSAS statistical data, Tyre Tombolo grew at a rate of roughly 144.16 m/year between 1975 and 2001 and it viewed a high positive sign (EPR+NSM), noticing that at the period of 2001 to 2018 there is a bit of change in Tyre Tombolo.
The rate of shoreline change was determined to reflect a tendency of shoreline erosion and accretion along the Tyre coast. During the study period, the majority of the territory was subjected to erosion, although some parts of the beaches accreted. Both natural and manmade forces contributed to the observed erosion and accretion trends along the Tyre shoreline.
This study demonstrated how the human intervention affect at Tyre shoreline. Result of Land use and land cover map in Table 9 and Figure 9 proved settlements on Tyre coastal zone has increased from 7.39 km2 to 18.14 km2 (1975 to 2018), The majority of these structures are located directly on the shoreline and a considerable portion of the marsh south of Tyre, as well as on the cultivated region and vegetation area north of Tyre, which protect the shoreline from erosion and accretion [27].
Figure 13, show how the irrigation water that dropped from the canals of the orchards eroded the sands at north of Jal Bahr (Baqbouq beach), which registered erosion at the two period of the study. In addition to the effect four-wheel drive cars. 4 WD vehicles physically modify beaches by leaving tire marks on the beach surface Figure 14. These trails are mainly found between the lower swash zone (the extent of wave run-up) and the foredune.
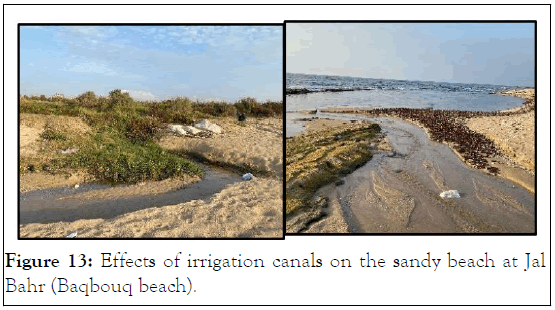
Figure 13: Effects of irrigation canals on the sandy beach at Jal Bahr (Baqbouq beach).
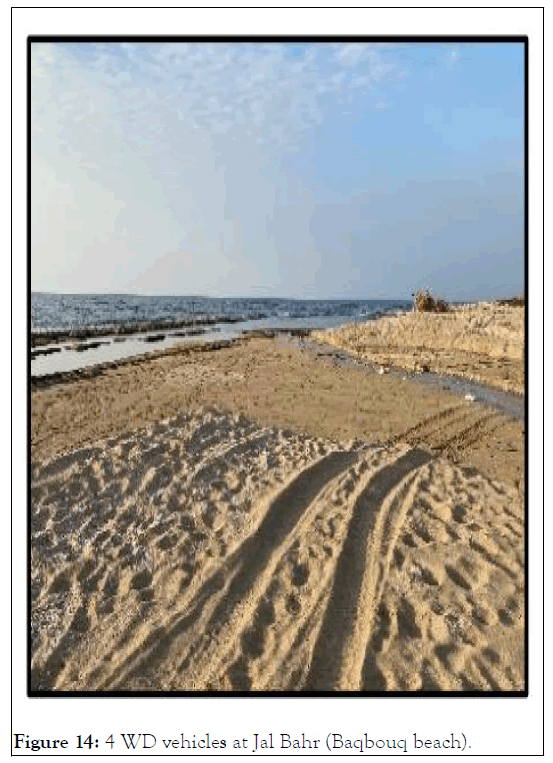
Figure 14: 4 WD vehicles at Jal Bahr (Baqbouq beach).
Figure 15 show that how the Rest House building has witnessed his area from 1975, 2001 and 2018, and how it influenced the beach.
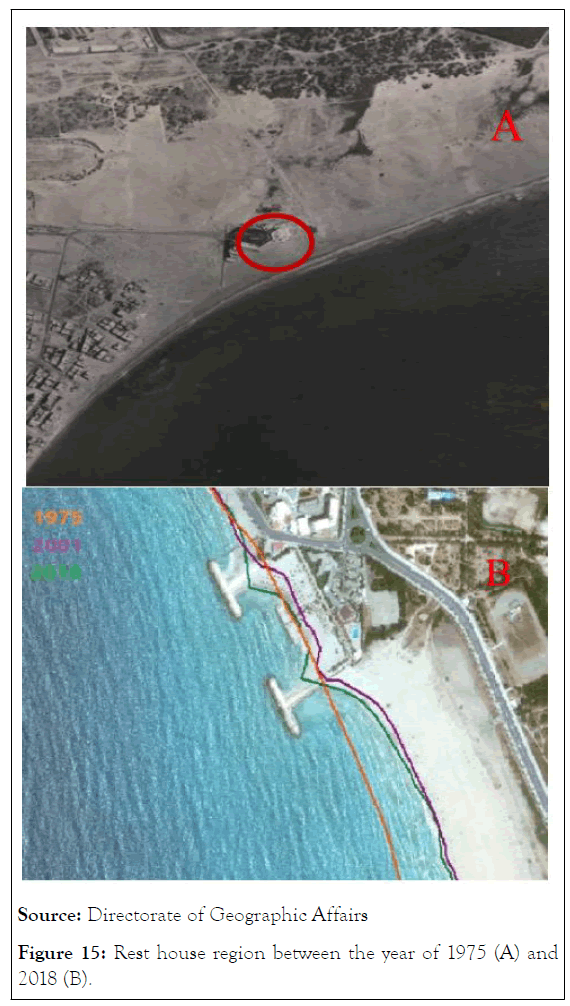
Figure 15: Rest house region between the year of 1975 (A) and 2018 (B).
This region has showed erosion as mentioned on Table 8 and on map above at the first period, and then it moved into accretion at the second period. This is a result of building of breakwaters that designed to protect Rest house from waves and currents which on the other hand it accumulates sands. At the year of 2013 sandy beach has accumulated behind the breakwaters of the rest house, the quantity was about 45000 m3, based on this cause rest house administration advanced to Ministry of Tourisms and to Tyre Municipality to extract this quantity of sands that blocked the swimming basin.
This break waters have affected also at Baher Slaiyeb that recorded a high rate of erosion at the first period, which declined at the second period due to the effect of break waters and transportation of sands from rest house region into Bahr Slaiyeb.
Qasmiye region Figure 16, showed high total of erosion rate at first period. In the second period (2001-2018) erosion has recorded beside breakwaters while in the other part of this region it has recorded accretion so for this result the total rate of EPR on Table 8 show that the predominate appearance at this region is accretion. Breakwaters alter the beach's profile, so when the longshore current is disrupted, sand will gather near the breakwater and eventually erode downdrift.
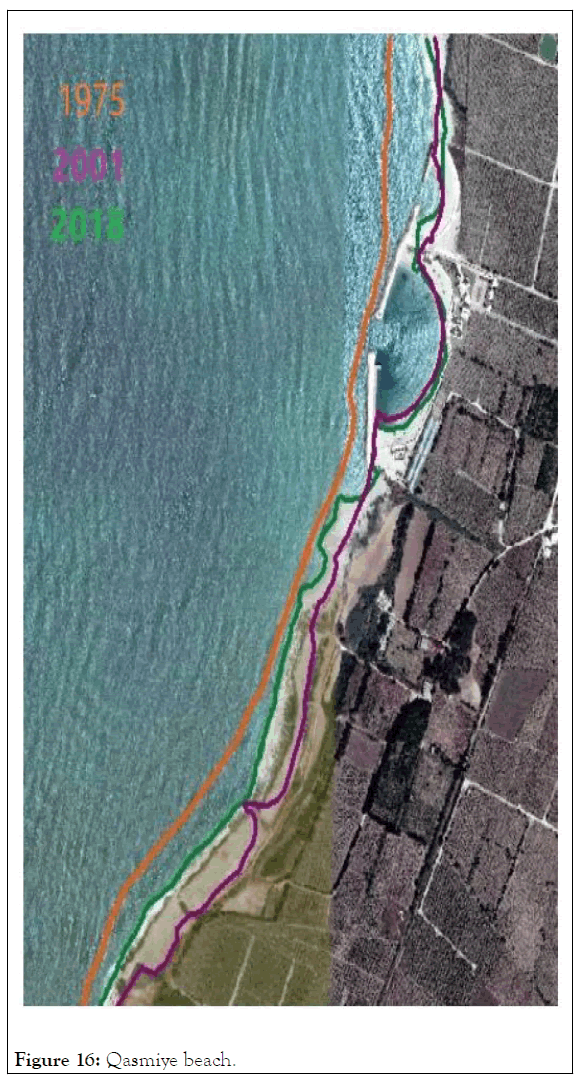
Figure 16: Qasmiye beach.
The majority of refugee camps are located on or near the water, putting a demographic, urban, and economic strain on the Tyre Coastal Area. For instance, the Al- Rachidiye camp, which is five kilometers south of Tyre.
The Rashidiye camp is separated into two sections: "ancient" and "new." Rachidiye camp was developed directly on an agricultural region and a wetland, extending to the edge of the shore as seen in Figures 17 and 18.
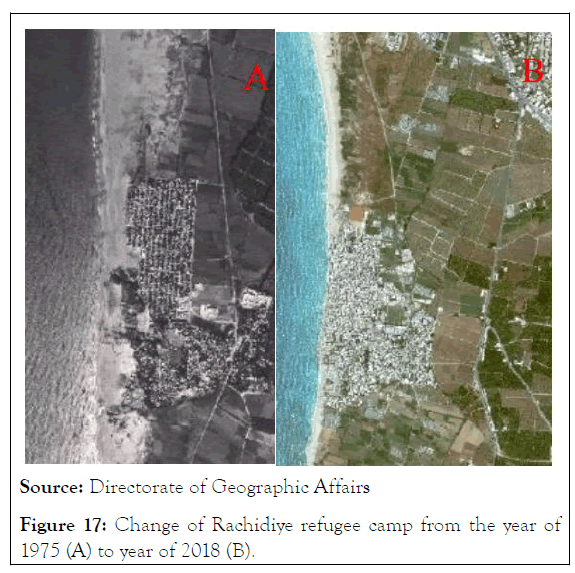
Figure 17: Change of Rachidiye refugee camp from the year of 1975 (A) to year of 2018 (B).
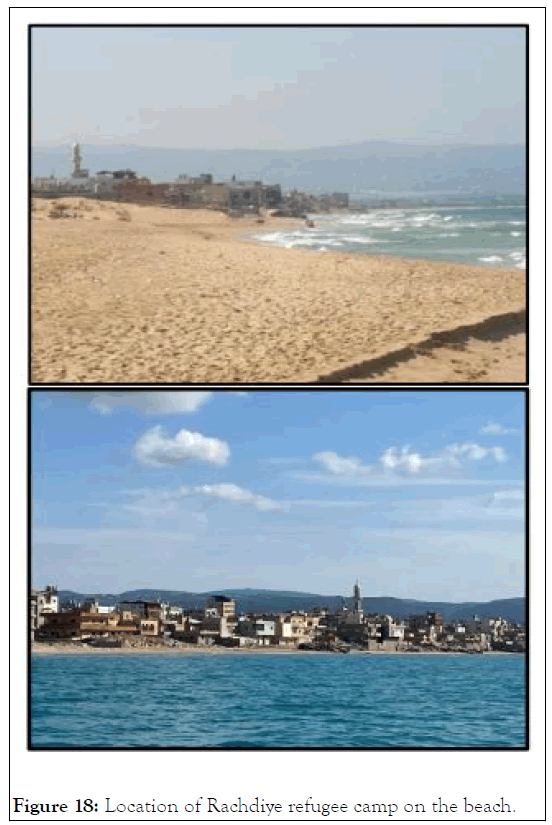
Figure 18: Location of Rachdiye refugee camp on the beach.
As a result of these (randomly built) wetland in Tyre has decreased its area.
This area has witnessed highly total erosion at the first period -241.73 m/ year as mentioned on Table 7.
Figure 19 also clarify how this region stays on the aspect of erosion at the second period.
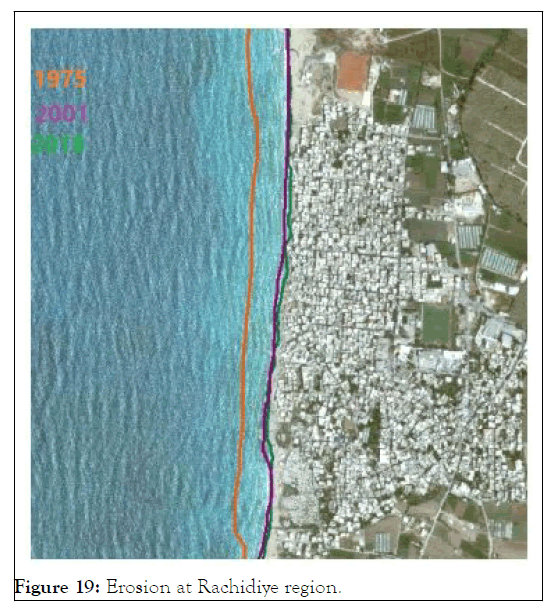
Figure 19: Erosion at Rachidiye region.
Jal al Bahr has evidenced a rate of erosion and this is due to also human factors and random settlements Figure 20 this region has a lack of vegetation. Plant roots hold sediment in place by absorbing water, softening the impact of raindrops or wavesplash, and physically delaying and diffusing the flow of overland runoff, thereby minimizing runoff erosion.
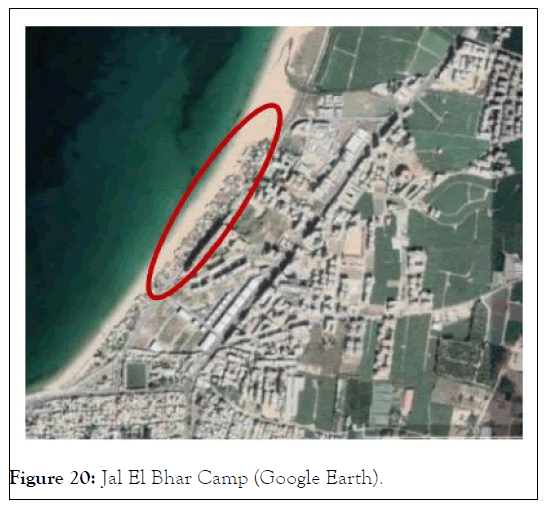
Figure 20: Jal El Bhar Camp (Google Earth).
Tyre Tombolo Figure 21 has recorded extend of its distance and this is due to the coastal management that has applied during the periods: breakwaters-cornishe- sea wall- harbor structures in addition to settlements.
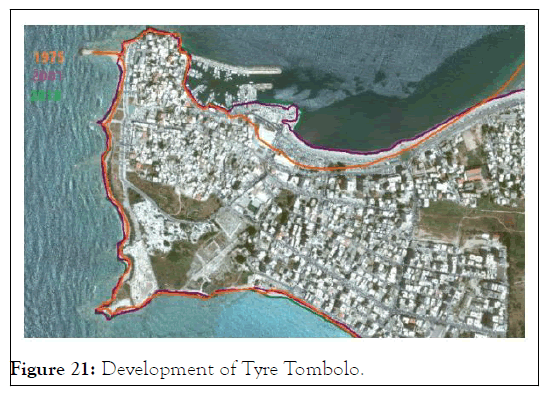
Figure 21: Development of Tyre Tombolo.
The vulnerability of shorelines is demonstrated by tombolos. A small piece of land, such as an island or a beached shipwreck, can alter the movement of waves, resulting in altered sediment deposition. As material is forced up by rising sea levels, it may also contribute to accretion as a result of rising sea levels, material is being forced up.
We have noticed that the Tyre archeological site is protecting by a sea wall which is built at the year of 2018 (Council for Development & Reconstruction). When waves contact a smooth and hard seawall, they are reflected back into the sea, according to sea wall. This turns the job and goal of this wall on its head. The backwash (reflected wave) carries beach sand with it. Moving sand from the beach and surf zone may result in a reduction in the sand rate in this area. For this reason, we see a small rate of erosion at the period of (2001-2018) at this site [28].
According to Iskandoruna Figure 22 it witnessed erosion at the first period and has recorded positive sign at the second period and this is due to building of breakwaters after the year of 2001 at this region (length 1 m and width between 34 and 60 m).
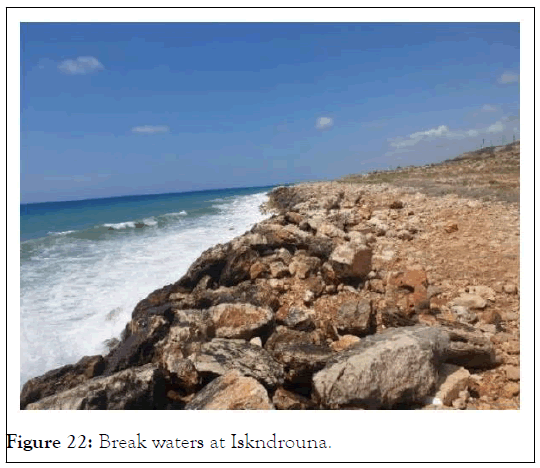
Figure 22: Break waters at Iskndrouna.
Al Malikiye and Qalile has witnsed ersion at the two period and this is due to the sand extraction. Sand extraction had important effects on the El Qlaileh beach, this beach is slightly disappearing since its width was of 90 m in 1962, and currently it is of 20 meters. As a result of sand extraction it became pebble.
Change detection is a crucial tool for environmental research, and determining the accuracy of change detection products is a crucial step in integrating remote sensing data into an environmental management system as a decision support tool.
This study found that Tyre shoreline has exposed to a risk of erosion and accretion during the two periods. It was beneficial to employ DSAS to calculate long-term coastline change. The case study presented here shows that DSAS can provide useful information on shoreline morphodynamic behavior, including shifting coastal location and changes in foreshore geometry, as well as the identification of erosion and deposition zones.
According to DSAS, coastal erosion and accretion affect the majority of Tyre's regions, particularly Qasmiye, Bahr El Slieib and Rachidiye, El Maysse and Iskandrouna. The change of the Tyre shoreline is largely due to anthropogenic activity (harbors, management structures, campgrounds, and individual houses, for example). Finally, based on the findings, this study provides local coastal managers and decision makers with a highly reliable decision algorithm that may help them analyze coastal changes that should be taken into account when building coastal management plans along the Tyre Shoreline.
Citation: Saad R (2022) Detection of the Shoreline Changes Using DSAS Technique and Remote Sensing: A Case Study of Tyre Southern Lebanon. J Oceanogr Mar Res. 10:004.
Received: 07-Dec-2021 Accepted: 20-Dec-2021 Published: 28-Jan-2022
Copyright: © 2022 Saad R, et al. This is an open-access article distributed under the terms of the Creative Commons Attribution License, which permits unrestricted use, distribution, and reproduction in any medium, provided the original author and source are credited.