Journal of Pollution Effects & Control
Open Access
ISSN: 2375-4397
ISSN: 2375-4397
Research Article - (2013) Volume 1, Issue 1
Delhi, the capital city of India, has an ill repute of a polluted city specifically due to high ambient particulate concentration resulting Hazy conditions. Winter of 2012 in Delhi was characterized with high level of critical pollutants, which in general, were attributed to geographical location of the city, high vehicular and population density. The onset of winter 2012 witnessed hazy and dusty condition, which prevailed for about 20 days (October to November), which is uncommon for this period of the year. No changes in the pattern of polluting activities in Delhi city were observed, which further compelled Delhi Pollution Control Committee to find out the associated reasons. The activities in neighboring states like agricultural waste burning in Punjab and Haryana and development of cyclone on coast of Tamil Nadu during this period might be one of the factored reasons for the hazy conditions. In this study, status of pollutants like particulate matter (PM10 and PM2.5), Nitrogen dioxide, Ozone, Ammonia, Sulfur dioxide and Carbon monoxide and metrological conditions were assessed and compared with 2011 data to find out the cause of extra ordinary hazy condition in Delhi, which induced panic in general population and attracted international media.
Keywords: Smog; Delhi; Hazy conditions; PM10 and PM2.5; NO2; SO2; Ozone
Air pollution has received significant attention over the past several decades from both the scientific and the environmental risk management communities in India and internationally [1]. This is especially true of smog′s two major components: particulate matter (PM) and ground-level ozone (O3). The primary reason for this attention has been the scientific literature, indicating the extensive impacts exerted by these pollutants on human health. Although they can also impact the environment, these impacts are less critical at the levels of smog currently experienced in Delhi, capital of the country, India.
Fast globalization, concentrated life style and automation have lead to emergence of new branches of science in the developed and developing countries. Polluted air, space, land and water are the unwanted results of the same. Compared to the rapidity of increase in pollution levels, awareness of air contamination and measures to monitor and control air quality are inadequate [2]. Pragmatic ill effects on human health and difficulty in treating air warrant due attention to continuously assess, monitor and control the ambient air quality, air being a primary source of lives. In developed countries, urban air pollution is eighth among the top 10 risk factors, and is the most important population health risk factor that cannot be significantly reduced by changes to personal behavior, arguably making it the most important risk factor for which the primary control mechanism is regulatory in nature [3].
Air pollution observed in many urban areas is commonly referred to as Smog. Smog is a yellowish fog caused by a mixture of atmospheric pollutants, and it consists mainly of fine particles and ozone. The latter is the product of complex photochemical reactions between nitrogen oxides (NOx) and volatile organic compounds (VOC), which are called “precursors” [4]. The main sources of these pollutants are motor vehicles, industrial processes and the heating of buildings. Not only does smog affect a broad swath of the population, but adverse health effects occur across the full range of ambient levels experienced in India, even very low levels. For all practical purposes, both PM and O3 need to be treated as having no safe level (i.e. on a population basis, there is no lower threshold at which there are no effects). This is likely due to the ubiquitous exposure to smog and the common nature of the illnesses and conditions affected by air pollution [5].
Delhi, the capital city of India, is situated in North India (28°12′- 28°63′ N, 75°50′-77°23′ E), at an altitude of 293 m above sea level. It is surrounded by the Thar Desert of Rajasthan to the west and the hot plains of Central India to the south. The distance from the nearest ocean exceeds one thousand kilometers. The climate of Delhi is semi-arid, and is mainly influenced by its inland position and prevalence of continental air during most of the year [6]. According to the classification given by Indian Meteorological Department, Delhi has four distinct seasons: winter (December-March), pre-monsoon or summer (April-June), monsoon (July-September) and post-monsoon (October-November). Summer is long and extremely hot, with maximum temperatures of 45-48°C, and the maximum frequency of dust storms. Humidity is high only during the monsoon season, characterized by heavy rainfall, while the air is dry during the rest of the year. Normal annual rainfall is between 600 and 800 mm, with more than 80% during the monsoon season. The winter season is moderately cold, with minimum temperatures around 1-4°C. During this part of the year, conditions of atmospheric stability (low wind speed and temperature inversion) lead to the frequent accumulation of atmospheric pollutants in the lower atmospheric layer, and morning hours are often thickly foggy. Wind speeds are typically higher in the summer and the monsoon periods; they are predominantly westerly and north-westerly, and tend to be more northerly in the afternoons, except during the monsoon season, when they are easterly and north-easterly. Yearly mean wind speed is in the range 0.9-2.0 ms-1 [7].
Sampling
Sampling location was located in the urbanized part of New Delhi (28°35′ N; 77°12′ E). The location of the site is shown in Figure 1. No major industrial sources are located within 5 km around the site. Sampling of PM10, PM2.5, NO2, SO2, CO, NH3 and O3 was carried out at three urban residential locations of New Delhi, the capital, and third largest city of India, ranks third in population among other Indian cities, estimated among 8.5 million [8].
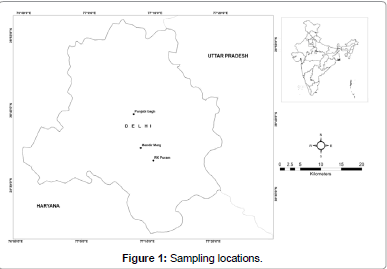
Figure 1: Sampling locations.
The air monitoring stations were at following sites:
1) Mandir Marg
2) Punjabi Bagh
3) R. K. Puram
In this study, the ambient air quality Delhi between the second week of October and first week of November 2012 is discussed, as there was an incident of major haziness in New Delhi during that period of time.
Methodology
The data was collected from 3 real time continuous ambient air monitoring stations established by DPCC (Table 1). This data was collected on 15 minutes average basis, and is averaged for 24 hours. PM10 and PM2.5 were measured using β-attenuation technique. Other parameters were measured using USEPA and CPCB standard procedures [6].
| Sl. No. | Locations | Activities |
| 1 | Mandir Marg | Residential, Commercial |
| 2 | Punjabi Bagh | Residential |
| 3 | R. K. Puram | Residential |
Table 1: Monitoring locations.
Observations
In this study, the general parameters of atmosphere, such as Particulate Matter, Sulfur dioxide, Nitrogen dioxide; Ozone, Ammonia and Carbon monoxide were measured along with Metrological parameters like humidity, wind speed and temperature (Table 2). The monitoring data of three consecutive years (2010, 2011 and 2012) during the period of 22 October to 10 November was used. The monitoring data of three consecutive years (2010, 2011 and 2012) during the period of 22 October to 10 November was used, and is shown in Tables 3-5 and in Figures 2-5.
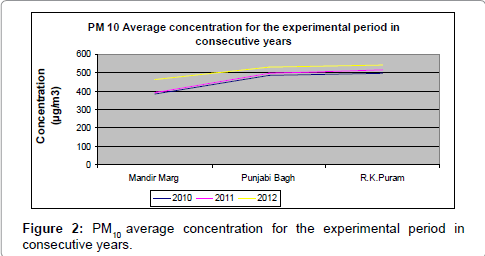
Figure 2: PM10 average concentration for the experimental period in consecutive years.
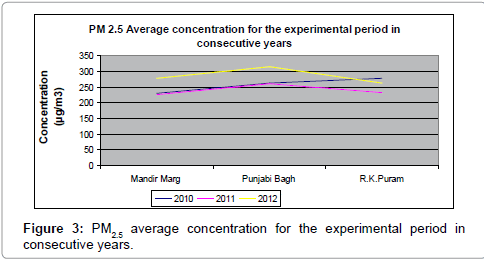
Figure 3: PM2.5 average concentration for the experimental period in consecutive years.
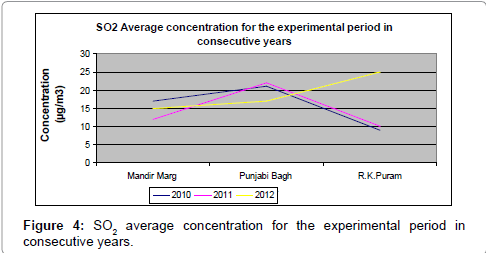
Figure 4: SO2 average concentration for the experimental period in consecutive years.
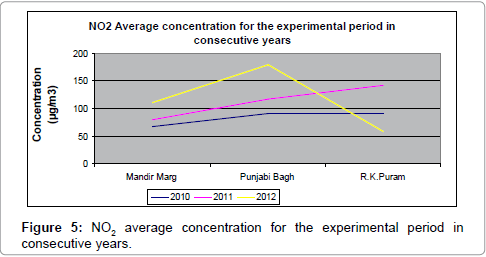
Figure 5: NO2 average concentration for the experimental period in consecutive years.
| Location | Wind Speed (m/sec) | Temperature (°C) | ||||||
| Min | Max | Avg | Std Div | Min | Max | Avg | Std Div | |
| Mandir Marg | 0.52 | 1.44 | 0.76 | 0.23 | 18.6 | 21.3 | 19.9 | 0.69 |
| Punjabi Bagh | 0.54 | 1.31 | 0.72 | 0.19 | 19.3 | 24.3 | 21.0 | 1.29 |
| R. K. Puram | 0.6 | 1.1 | 0.77 | 0.16 | 17.7 | 22.2 | 19.1 | 1.02 |
Table 2: Variation of wind speed and temperature during the study period.
| Location | PM10 (μg/m3) (24 hrs sampling) |
PM2.5 (μg/m3) (24 hrs sampling) |
SO2 (μg/m3) (24 hrs sampling) |
NO2 (μg/m3) (24 hrs sampling) |
||||||||||||
| Min | Max | Avg | Std Div | Min | Max | Avg | Std Div | Min | Max | Avg | Std Div | Min | Max | Avg | Std Div | |
| Mandir Marg | 183 | 767 | 463 | 183.21 | 123 | 531 | 281 | 135.01 | 9 | 28 | 16 | 5.99 | 72 | 301 | 115 | 50.84 |
| Punjabi Bagh | 199 | 782 | 529 | 174.23 | 117 | 574 | 321 | 126.23 | 5 | 37 | 18 | 8.82 | 82 | 301 | 196 | 41.40 |
| R. K. Puram | 263 | 915 | 541 | 158.88 | 141 | 404 | 267 | 87.53 | 12 | 41 | 27 | 8.39 | 36 | 74 | 62 | 10.86 |
| NAAQS | 100 | 60 | 80 | 80 | ||||||||||||
Table 3: Concentration (μg/m3) of PM10, PM2.5, SO2 and NO2 during the study period.
| Location | PM10 (μg/m3) (24 hrs sampling) |
PM2.5 (μg/m3) (24 hrs sampling) |
SO2 (μg/m3) (24 hrs sampling) |
NO2 (μg/m3) (24 hrs sampling) |
||||||||||||
| Min | Max | Avg | Std Div | Min | Max | Avg | Std Div | Min | Max | Avg | Std Div | Min | Max | Avg | Std Div | |
| Mandir Marg | 186 | 581 | 393 | 87.35 | 97 | 323 | 226 | 57.67 | 2 | 25 | 12 | 7.55 | 40 | 183 | 80 | 36.32 |
| Punjabi Bagh | 252 | 690 | 496 | 104.33 | 128 | 465 | 260 | 90.22 | 6 | 69 | 22 | 12.56 | 63 | 176 | 117 | 30.84 |
| R. K. Puram | 301 | 780 | 516 | 114.54 | 119 | 560 | 233 | 95.75 | 2 | 32 | 10 | 6.25 | 91 | 215 | 142 | 37.60 |
| NAAQS | 100 | 60 | 80 | 80 | ||||||||||||
Table 4: Concentration (μg/m3) of PM10, PM2.5, SO2 and NO2 during the study period (2011).
| Location | PM10 (μg/m3) (24 hrs sampling) |
PM2.5 (μg/m3) (24 hrs sampling) |
SO2 (μg/m3) (24 hrs sampling) |
NO2 (μg/m3) (24 hrs sampling) |
||||||||||||
| Min | Max | Avg | Std Div | Min | Max | Avg | Std Div | Min | Max | Avg | Std Div | Min | Max | Avg | Std Div | |
| Mandir Marg | 183 | 767 | 463 | 183.21 | 123 | 531 | 281 | 135.01 | 9 | 28 | 16 | 5.99 | 72 | 301 | 115 | 50.84 |
| Punjabi Bagh | 199 | 782 | 529 | 174.23 | 117 | 574 | 321 | 126.23 | 5 | 37 | 18 | 8.82 | 82 | 301 | 196 | 41.40 |
| R. K. Puram | 263 | 915 | 541 | 158.88 | 141 | 404 | 267 | 87.53 | 12 | 41 | 27 | 8.39 | 36 | 74 | 62 | 10.86 |
| NAAQS | 100 | 60 | 80 | 80 | ||||||||||||
Table 5: Concentration (μg/m3) of PM10, PM2.5, SO2 and NO2 during the study period (2012).
Particulate Matter (PM10): Inter-station variation was 463-530 (μg/m3) during episode period, while the maximum concentration was observed 760 at Mandir Marg on 5th Nov. 782 (μg/m3) at Punjabi Bagh on 7th November, and 915 (μg/m3) on 30th October at R.K Puram. The gradual increases were observed at all the three stations, which reached on peak during 4th to 7 of November (Figure 6).
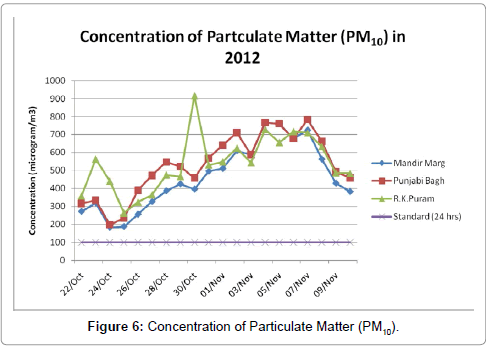
Figure 6: Concentration of Particulate Matter (PM10).
Particulate Matter (PM2.5): The average concentration of PM2.5 varied from 267 to 321(μg/m3). The maximum was observed at Punjabi Bagh and minimum at R. K. Puram. The peak concentration was observed at R. K. Puram and Mandir Marg on 4th Nov; while at Punjabi Bagh on 7th November (Figure 7).
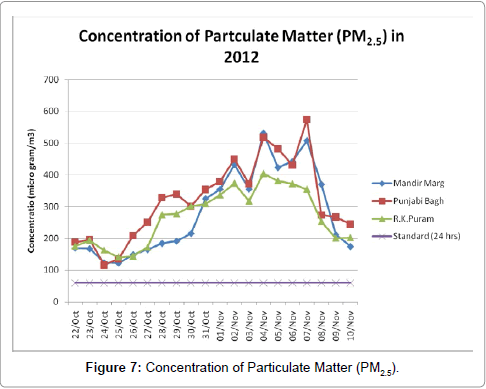
Figure 7: Concentration of Particulate Matter (PM2.5).
Nitrogen dioxide: The concentration of NO2 varied from 62 to 196 (μg/m3). From 26th October onwards, value crossed 100 though NO2 was low at R. K. Puram, but an increase of 100% was observed at R. K. Puram also. Though Particulate shown down ward trend from 5th on wards, but in NO2 concentration showed upward trend, which was observed up to 10th November (Figure 8).
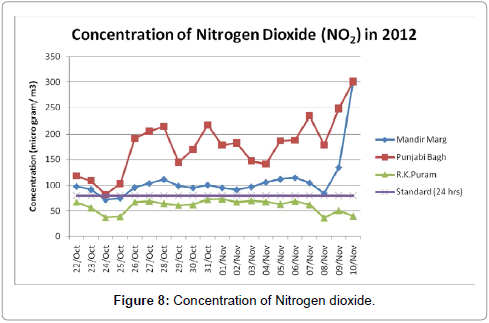
Figure 8: Concentration of Nitrogen dioxide.
Ozone: Concentration of O3 varied from 41 to 56 (μg/m3), which is comparable with last year′s data. The higher values were observed in initial phase (Figure 9).
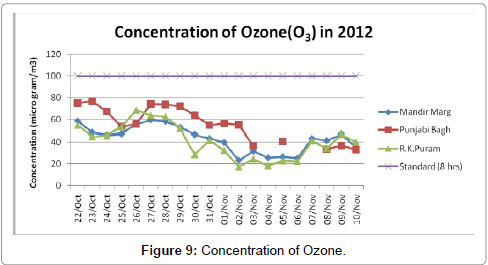
Figure 9: Concentration of Nitrogen dioxide.
Ammonia: The average concentration of ammonia was varied from 50 to 88 (μg/m3). The lowest avg. values were observed at R. K. Puram and maximum at Punjabi Bagh (Figure 10).
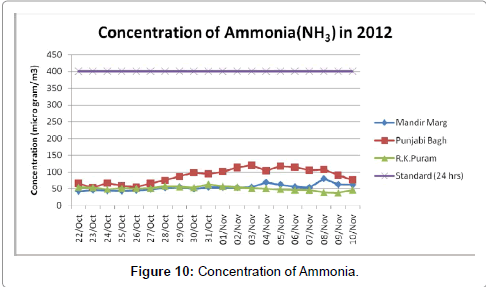
Figure 10: Concentration of Ammonia.
Carbon monoxide: The concentration of CO found exceeding the standard and the average value for all the three stations was 3 mg/m3. The values showed an increasing trend till first November and second peak was observed on 4th or 5th November (Figure 11).
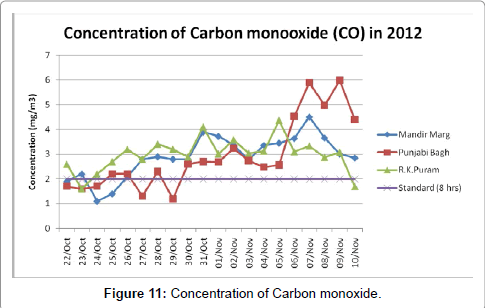
Figure 11: Concentration of Carbon monoxide.
Sulfur dioxide: Sulfur dioxide was always well within the limit and average varied from 16 to 27 (μg/m3) (Figure 12).
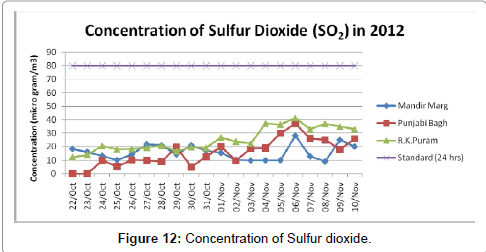
Figure 12: Concentration of Sulfur dioxide.
The correlation analysis also undertaken to understand inter station correlation of different parameters. The observations were as follows:
Correlation analysis for mandir marg
Table 6 shows the statistical correlations among PM10, PM2.5, Sulfur dioxide, Nitrogen dioxide, O3, Ammonia, Carbon monoxide, Wind Speed and Temperature. A strong correlation was observed between PM10 and PM2.5 (0.96), PM10 and Carbon monoxide (0.83) and PM2.5 and Carbon monoxide (0.80). On the other hand, negative correlation was observed between PM10 and O3 (-0.75) and PM2.5 and O3 (-0.76). The negative correlation between Wind Speed and other parameters confirms that as the wind speed was observed to be low, the pollutants remained in concentration, and were not dispersed quickly and as a result the hazy conditions (Table 6).
| PM10 | PM2.5 | NO2 | SO2 | CO | NH3 | O3 | Wind Speed | Temperature | |
| PM10 | 1.00 | 0.96 | 0.03 | -0.20 | 0.84 | 0.65 | -0.75 | -0.68 | -0.13 |
| PM2.5 | 0.96 | 1.00 | -0.09 | -0.29 | 0.80 | 0.57 | -0.76 | -0.63 | -0.22 |
| NO2 | 0.03 | -0.09 | 1.00 | 0.34 | 0.13 | 0.26 | -0.18 | -0.17 | 0.21 |
| SO2 | -0.20 | -0.29 | 0.34 | 1.00 | 0.04 | -0.18 | 0.28 | -0.02 | 0.36 |
| CO | 0.84 | 0.80 | 0.13 | 0.04 | 1.00 | 0.61 | -0.45 | -0.74 | 0.02 |
| NH3 | 0.65 | 0.57 | 0.26 | -0.18 | 0.61 | 1.00 | -0.49 | -0.38 | -0.16 |
| O3 | -0.75 | -0.76 | -0.18 | 0.28 | -0.45 | -0.49 | 1.00 | 0.42 | 0.29 |
| Wind Speed | -0.68 | -0.63 | -0.17 | -0.02 | -0.74 | -0.38 | 0.42 | 1.00 | -0.12 |
| Temperature | -0.13 | -0.22 | 0.21 | 0.36 | 0.02 | -0.16 | 0.29 | -0.12 | 1.00 |
Table 6: Correlation among PM10, PM2.5, NO2, SO2, CO, NH3,O3, wind speed and temperature at Mandir Marg.
Punjabi bagh
Table 7 shows the statistical correlations among PM10, PM2.5, Sulfur dioxide, Nitrogen dioxide, O3, Ammonia, Carbon monoxide, Wind Speed and Temperature. A strong correlation was observed between PM10 and PM2.5 (0.95), PM10 and Ammonia (0.85) and PM2.5 and Ammonia (0.80). On the other hand, negative correlation negative correlation was observed between O3 and Carbon monoxide (-0.80). The negative correlation between Wind Speed and other parameters has the same reason as that of for Mandir Marg station (Table 7).
| PM10 | PM2.5 | NO2 | SO2 | CO | NH3 | O3 | Wind Speed | Temperature | |
| PM10 | 1.00 | 0.95 | 0.43 | 0.61 | 0.46 | 0.85 | -0.44 | -0.73 | -0.64 |
| PM2.5 | 0.95 | 1.00 | 0.34 | 0.53 | 0.37 | 0.80 | -0.29 | -0.72 | -0.57 |
| NO2 | 0.43 | 0.34 | 1.00 | 0.34 | 0.62 | 0.24 | -0.48 | -0.36 | -0.41 |
| SO2 | 0.61 | 0.53 | 0.34 | 1.00 | 0.55 | 0.58 | -0.66 | -0.55 | -0.58 |
| CO | 0.46 | 0.37 | 0.62 | 0.55 | 1.00 | 0.48 | -0.80 | -0.27 | -0.54 |
| NH3 | 0.85 | 0.80 | 0.24 | 0.58 | 0.48 | 1.00 | -0.57 | -0.70 | -0.64 |
| O3 | -0.44 | -0.29 | -0.48 | -0.66 | -0.80 | -0.57 | 1.00 | 0.11 | 0.67 |
| Wind Speed | -0.73 | -0.72 | -0.36 | -0.55 | -0.27 | -0.70 | 0.11 | 1.00 | 0.24 |
| Temperature | -0.64 | -0.57 | -0.41 | -0.58 | -0.54 | -0.64 | 0.67 | 0.24 | 1.00 |
Table 7: Correlation among PM10, PM2.5, NO2, SO2, CO, NH3,O3, wind speed and temperature at Punjabi Bagh.
R. K. puram
Table 8 shows the statistical correlations among PM10, PM2.5, Sulfur dioxide, Nitrogen dioxide, O3, Ammonia, Carbon monoxide, Wind Speed and Temperature. A strong correlation was observed between PM10 and PM2.5 (0.77). On the other hand, negative correlation negative correlation was observed between O3 and PM10 (-0.76) and O3 and PM2.5 (-0.80). The negative correlation between Wind Speed and other parameters has the same reason as that of for Mandir Marg station (Table 8).
| PM10 | PM2.5 | NO2 | SO2 | CO | NH3 | O3 | Wind Speed | Temperature | |
| PM10 | 1.00 | 0.77 | 0.21 | 0.51 | 0.24 | -0.13 | -0.76 | -0.29 | -0.43 |
| PM2.5 | 0.77 | 1.00 | 0.52 | 0.54 | 0.60 | 0.12 | -0.80 | -0.55 | -0.49 |
| NO2 | 0.21 | 0.52 | 1.00 | -0.12 | 0.52 | 0.56 | -0.15 | -0.68 | 0.17 |
| SO2 | 0.51 | 0.54 | -0.12 | 1.00 | 0.24 | -0.66 | -0.58 | -0.36 | -0.73 |
| CO | 0.24 | 0.60 | 0.52 | 0.24 | 1.00 | 0.21 | -0.23 | -0.61 | -0.40 |
| NH3 | -0.13 | 0.12 | 0.56 | -0.66 | 0.21 | 1.00 | 0.13 | -0.14 | 0.42 |
| O3 | -0.76 | -0.80 | -0.15 | -0.58 | -0.23 | 0.13 | 1.00 | 0.23 | 0.45 |
| Wind Speed | -0.29 | -0.55 | -0.68 | -0.36 | -0.61 | -0.14 | 0.23 | 1.00 | 0.26 |
| Temperature | -0.43 | -0.49 | 0.17 | -0.73 | -0.40 | 0.42 | 0.45 | 0.26 | 1.00 |
Table 8: Correlation among PM10, PM2.5, NO2, SO2, CO, NH3,O3, wind speed and temperature at R. K. Puram.
The comparison of the concentration of different parameters from 22nd to 26th of October is comparable with the data for the same period in year 2010 and 2011. Particulate concentration (PM10 and PM2.5) showed an increasing trend from 26th October to November 6th. In gaseous pollutants, NO2 and CO also showed the same trend. While Ozone and Ammonia showed downward trend from 24th October. During this period, no sudden activity was observed in Delhi, which may be attributed to increase of particulates in ambient air. The agricultural waste burning, which is normal practice in Haryana and Punjab, may be a cause (Figure 8 and 9). The image released by NASA in public domain clearly shows the agricultural fire in Gangetic plan. The Figure 13 shows agricultural fire through the Delhi area has no smoke, but after development of a cyclone at Tamil Nadu coast caused movement of smoke towards Delhi, which is clearly visible in form of plume. To understand the reasons for an abnormal hazy conditions in Delhi, ambient air data from 22nd October to 10th November 2012, was compared with the data of 2011. The hazy condition is normal for Delhi, but only December and January months, when inversion is acute and temperature difference between day and night temperature in below 10°C with very low wind speed. The hazy conditions developed in year 2012 maybe correlated with biomass burning and cyclonic development during this period in down southern part of Indian subcontinent.
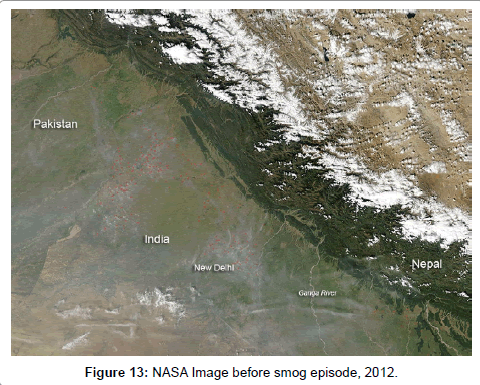
Figure 13: NASA Image before smog episode, 2012.
The Image shows the clouds of ash just above Delhi city the cloud trapped above Delhi due to formation of cyclone and corresponding anti-cyclone. The calm condition in Delhi during the period also correlates to the situation. The positive correlation between particulate and CO also indicates the particulate and CO both is from same source. Past IMD data and Satellite imageries of 2000-2012 show that there were similar prolonged fog/smog/haze conditions over Delhi and adjoining NW India, in association with crossing of cyclones during December 1998, November 2008 and December 2011. During November 2008, there were 21 days of prolonged occurrence of fog/smog/haze, with three spells in association with three cyclones “Rashmi” “Khi-Muk” and “Nisha”. During last week of December 2011, Cyclone “Thane” crossed Tamil Nadu coast and created similar atmospheric conditions. It indicates that the smog episodes in Delhi is a cumulative effect of formation of cyclonic conditions due to cyclone “Nilam” and open agricultural burning in the region (Figure 14).
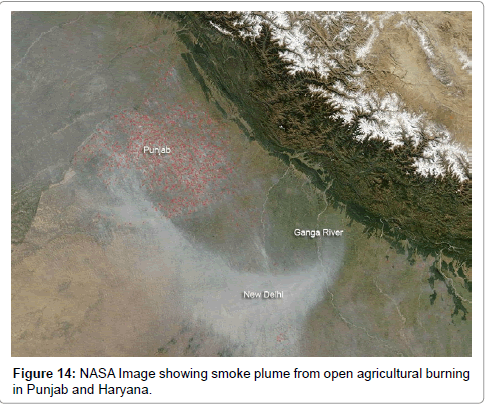
Figure 14: NASA Image showing smoke plume from open agricultural burning in Punjab and Haryana.
The authors are grateful to the Chairman, Delhi Pollution Control Committee, Department of Environment, for his support and guidance for conducting the study. We are also thankful to the technical staff and trainees at the air laboratory of Delhi Pollution Control Committee (DPCC), for their steady efforts in data compilation.