Journal of Plant Biochemistry & Physiology
Open Access
ISSN: 2329-9029
ISSN: 2329-9029
Research Article - (2014) Volume 2, Issue 3
Taproots of mature Medicago sativa L. plants store abundant starch that cycles with defoliation. Starch is a key component that provides energy for regrowth of alfalfa plants post defoliation (PD). Starch is located mostly in the parenchyma cells of wood medullary ray and bark tissues. The objectives of this study were to investigate the influence of defoliation on the distribution of starch granules in cells within bark and wood tissues and changes to starch granule structure. Plants were grown to maturity in the greenhouse, defoliated, and root samples were analyzed by SEM from plants sampled on different days PD. TEM was used to study the structure of starch granules on Days 0, 12, and 28 PD and 12 day non-defoliated plants. A one-way ANOVA revealed a significant difference in the distribution of starch granules between the two tissues over the 35 day PD interval. The distribution of starch granules declined significantly on Days 10 and 12 when compared with Days 1 to 8 PD. Starch granules increased between Days 14 and 35 in bark cells, and in medullary ray cells the starch grain increase between Days 14 and 35 showed variations. There was a preponderance of smooth, clearly defined, and continuous surface starch granules in cells on Day 28 PD. In contrast, the surfaces of most starch granules appeared rough, irregular, and had various size crevices on Day 12 PD and non-defoliated plants. On rare occasions, intact amyloplasts were seen during times of net starch synthesis, but never during times of net starch degradation. This study revealed the post defoliation timeline when the lowest number of starch granules and major structural changes in amyloplasts occur. These results indicate when to target genes regulating reserve starch degradation in alfalfa with potential to contribute to alfalfa productivity.
Keywords: Alfalfa; Defoliation; Medicago sativa L; Starch granule; Starch degradation
PD: Post Defoliation; TEM: Transmission Electron Microscopy; SEM: Scanning Electron Microscopy; ANOVA: Analysis Of Variance
Starch accumulates in photosynthetic and non-photosynthetic tissues of plants. Photosynthetic tissues store transitory starch during the day. At night, this starch degrades within the chloroplast into simple sugars that are transported as sucrose to different parts of the plant to support cellular metabolism. The extra sucrose is reconstructed as reserve starch in non-photosynthetic tissues. Metabolism of transitory starch occurs within each 24 hour diurnal cycle whereas reserve starch metabolism takes place over extensive time periods such as a growing season.
A number of enzymes orchestrate transitory starch degradation inside the chloroplast beginning with the sequential addition of phosphate groups to the glucose moiety at the 6th and 3rd carbons on the surface of crystalline starch granules by glucan water dikinase (GWD) and phosphoglucan water dikinase (PWD) [1,2]. This phosphorylation event converts the surface of starch granules from a closed to an open conformation [3]. Phosphoglucan phosphatases SEX4 and LSF2 remove phosphate groups bestowed by GWD and PWD [4]. The accessible amylopectin and amylose chains are acted upon by the collaborative hydrolytic actions of β-amylase (BAM 1&3) and isoamylase (ISA3), releasing maltose and malto-oligosaccharides, respectively [2]. Disproportionating enzyme (DPE1) metabolizes malto-oligosaccharide to glucose and joins short chains of malto-oligosaccharide molecules to produce longer versions that β- amylase can then act upon [2]. Maltose and glucose are transported to the cytosol via their respective transporters where they contribute to the hexose phosphate pool that is metabolized to sucrose for long distance transport.
The reserve starch degradation pathway, which is mostly understood in cereal endosperm during germination, is slightly different from that of transitory starch. First, starch is stored and degraded within non-living cells of mature endosperm tissue and is not particularly sequestered in plastids as is the case of transitory starch found in the chloroplast of photosynthetic tissue [2]. Reserve starch also is sequestered in the amyloplasts of living parenchyma cells of non-photosynthetic tissues such as those in roots, legume cotyledons, tubers, and turions. Second, the starch crystalline structure does not need to be phosphorylated for degradation to occur. Third, α-amylase, as opposed to β-amylase, is the predominant starch degrading enzyme.
There is another starch degradation pathway described for turions, the starch storing perennial organ of Spirodela polyrhiza that combines aspects of both transitory and reserve starch [5]. Upon light exposure to turions there is a transition of amyloplast to chloroplast. This indirect evidence shows that the amyloplast is intact, and like transitory starch, degradation occurs by plastidic enzymes [5]. As in cereal endosperm during germination, reserve starch degradation in turions is initiated by α-amylase rather than β-amylase under normal conditions. Intact amyloplast membranes were seen during induced sweetening by storage of potato tubers at low temperatures [6,7]. Others have noted that amyloplast membranes disintegrate during the starch degradation process and thus expose the starch to cytosolic enzymes [5,6-9]. Researchers reported the disintegration of amyloplast membranes along with total loss amyloplast structure of starch accumulation [3]. amyloplast structure within the symbiotic root nodules of beach pea (Lathyrus maritimus) plants during the winter months, when starch degradation takes place, as opposed to summer months, a period of starch accumulation. Starch grains of germinating mungbean were also found to be devoid of amyloplast membranes [8]. Also, sweetening, triggered by senescence of potato tubers (Solanum tuberosum L.) stored at higher temperatures for prolonged periods showed disintegration of amyloplast membranes [6]. Current evidence suggests that the mechanism of reserve starch degradation varies by species, organ, and environmental cues.
Environmental and metabolic cues that trigger starch degradation in plants alter starch granule structure and size. Three different class sizes of starch granules have been described: A, B, and C types [10]. Some species appear to synthesize two or all three class sizes of starch granules although at different times [10]. Type A class occurs mostly in cereal endosperm and is large (>15 μm) [10] consisting of regions of densely packed double helix [11]. Type B class size is medium (5- 15 μm) occurring in wheat endosperm [10], leaf and tuberous tissues [11]. The type C class of starch granules is small (<5 μm) [10] and is also found in legume seeds [11]. There is a discrepancy about the granule size class that is first degraded, but evidence shows that the preferential degradation of a particular starch granule class size is likely tissue and species-specific. Researchers have reported that seasonal changes from summer growth months to winter hibernating months trigger large starch granules to shrink and appear amorphous in cells of the symbiotic root nodules of Lathyrus maritimus as revealed by TEM [3]. SEM and TEM were used to document the structure of starch granules in endosperm tissue of rice seeds germinated at 32°C in the dark showing that early stages of starch breakdown are visible two days post imbibition by the appearance of small crevices on the surface of starch granules [12]. Similarly, [13] showed that the structure of the starch granule differed in rice seeds germinated in low versus high temperatures. Starch granules had rough structures on their surfaces when germinated at low temperatures compared to small crevices that appeared on the surfaces of starch granules in seeds germinated at a high temperature [13]. These crevices represent weak points where hydrolytic enzymes attack the starch granule.
When mature Medicago sativa L. (known commonly as alfalfa) plants are defoliated, reserve starch in the roots declines and reaccumulates within approximately a monthly interval [14]. Starch decline is associated with regrowth of alfalfa shoots and, upon establishment of adequate shoot mass, taproot starch levels rise again [15-20]. In alfalfa reserve starch is stored in parenchyma cells of bark and wood tissues in mature taproots [14,21]. Intact amyloplast structures containing multiple starch granules during periods of active starch synthesis was shown in alfalfa taproots [14]. However, changes in amyloplast structure during times of active starch degradation was not examined [14] leaving us to wonder what the fate of amyloplast structure is during periods of starch degradation within this species. Using light microscopy, [14] showed that, in taproots of defoliated alfalfa during a 28 day regrowth period, starch granules decrease and then increase in numbers and size. This reduction of starch granules depended on the location of the cells of the medullary rays as those closer to the vascular cambium showed drastic reduction compared to those closer to the center of the root tissue [14]. Decline and increase of starch granules followed the cyclical pattern of starch metabolism that has been thoroughly demonstrated using biochemical techniques [21,22]. There is scant information on starch granule ultra-structural changes in alfalfa taproots in re-growing plants after defoliation. Also, ultrastructure evidence of different classes of starch granules in alfalfa taproots is not known. Such studies are needed to shed light on the pathway of starch degradation in alfalfa taproots.
Our current study extends the work of [14] revealing that; A) there is significant difference in the pattern of distribution of starch granules in parenchyma cells of bark and xylem ray cells in taproots of alfalfa plants post defoliation as demonstrated by SEM, B) starch granule structure changes during times of active starch degradation and synthesis in re-growing alfalfa plants PD shown by TEM, C) different size classes of starch granules are found in alfalfa roots revealed by TEM, and D) clearly discernable amyloplasts are occasionally seen in alfalfa taproots during times of active starch synthesis (Days 1 and 28 PD, Day 12 in non-defoliated plants) as confirmed by TEM.
Plant growth, treatment and sampling
Seeds of the Pioneer cultivar cv5454 were sown in a soil mix containing 2:1 parts sand: silty clay loam in 1-liter pots. Plants were grown at an average temperature of 25°C in a 16 hour photoperiod in the greenhouse at Purdue University in West Lafayette, IN. The plants were watered with deionized water as needed, and minus- nitrogen Hoagland nutrient solution (50 mL) was administered biweekly. Rhizobium meliloti was used to inoculate alfalfa roots. At flowering, plants were defoliated and allowed to re-grow to a second flowering before starting the experiment. All plants were defoliated on the same day. Samples were taken 0, 1, 2, 4, 8, 12, 14, 16, 21, 28, and 35 days, respectively, after defoliation. The roots were freed of soil by washing with tap water. Roots were severed from the crown region. Within the top 1 cm region of the taproot, cross sections were cut using a sharp razor blade.
Scanning Electron Microscopy
Cross sections were fixed in 2% gluteraldehyde, dehydrated in a series of ethanol rinses, critical point dried, and sputter coated. Sections were analyzed by SEM. The ETS/Lindgren Helmholtz system was used for imaging at high-resolution and at low voltage (5 or 10 kV). Adobe Photoshop was utilized to edit images and collect data. Individual starch grains in a column of 12 cells on each side of the vascular cambium were counted.
Transmission Electron Microscopy
Two separate experiments were done for TEM. In the first experiment, thick (1 cm) sections were cut from the top 5 cm of taproots from mature plants that were growing 12 days after defoliation and from similar aged non-defoliated plants that served as controls. For the second experiment, sections were obtained from mature plants at defoliation (Day 0), then 12 and 28 days after defoliation. Fixative formulations for preservation of plant tissues were modified based on [23]. Samples were fixed with 2% gluteraldehyde in 0.01 M phosphate buffer (pH 7.6) for 2 hours at 4oC, followed by three washes for 30 minutes each in the same phosphate buffer to eliminate free unreacted gluteraldehyde. Post-fixation was done in 2% osmium tetraoxide for 2 hours. After post-fixation, tissues were dehydrated with an ethanol series using acetone as the transition fluid. Tissues were infiltrated with Spurr’s resin in the final infiltration step for 4 hours at 0.5 atm in a vacuum oven at room temperature. Samples were cured at 60oC for 24 hours. Sections (80 nm) were cut with an RMC MTX ultramicrotome using a glass knife. Sections were collected on copper grids, stained with uranyl acetate and lead citrate, and viewed by TEM (JEOL JEM 1200 EX). To avoid picking up consecutive sections from the same cell, every section that was examined was picked up after 10-15 advances of the microtome. In the first experiment, negatives from micrographs were scanned with an Epson perfection 4990 photon scanner, and figures were assembled using Adobe® Photoshop® 6.01. In the second experiment, sections were viewed with a GATAN 785 ES100W 11 megapixel side mount camera attached to the TEM.
Statistical analysis
For SEM analysis of starch granule distribution, there were three replications for this experiment and three plants were analyzed per replication. A one-way analysis of variance was employed to determine significance in the number of starch granules between the tissue types (Bark and Wood) and sampling dates.
Defoliation affects starch granule distribution in the bark and wood tissues of alfalfa taproots
The pattern of starch granule distribution in the bark and wood tissues of re-growing mature plants induced by defoliation was investigated by SEM. In the wood tissue, medullary ray parenchyma cells were the focus of analysis as they had been shown previously to store most of the starch [14]. Figure 1 shows sample images of cells containing starch granules obtained from plants sampled at different days post defoliation (PD). On Day 0 of defoliation, the majority of cells were full of starch granules as were cells on Day 28 (Figure 1A and C). Starch granules appeared in clusters. In contrast, on Day 12 starch granules appeared sparingly in cells and were more dispersed (Figure 1B).
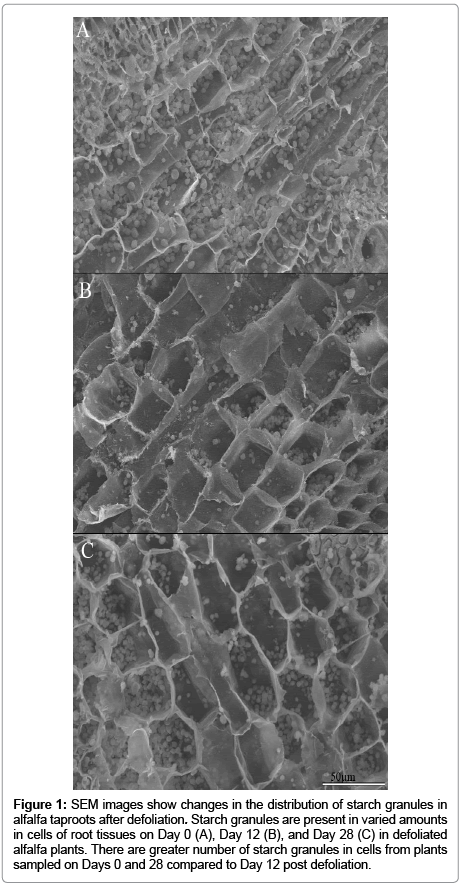
Figure 1: SEM images show changes in the distribution of starch granules in alfalfa taproots after defoliation. Starch granules are present in varied amounts in cells of root tissues on Day 0 (A), Day 12 (B), and Day 28 (C) in defoliated alfalfa plants. There are greater number of starch granules in cells from plants sampled on Days 0 and 28 compared to Day 12 post defoliation.
In order to ascertain whether the position of the cells from the vascular cambium (going towards the bark or wood tissues) varied in the number of starch granules they contained, the cells were placed in two groups; Groups 1 and 2. Group 1 contained six cells and was located adjacent to the vascular cambium, and Group 2 had six cells further from the vascular cambium but adjacent to Group 1. A oneway ANOVA revealed that there was no significant difference in the number of starch granules between Groups 1 and 2; therefore the starch granules in the combined 12 cells (Groups 1 and 2) were statistically analyzed for each tissue type and sampling date. The ANOVA revealed a significant difference (P<0.01) in starch granule distribution among sampling dates between the bark and wood tissues (Figures 2 and 3). In the bark tissue, mean number of starch granules was consistently greater on Days 1, 2, 4, and 8 PD although variation occurred (Figure 2). The number of starch granules drastically declined on Days 10 and 12 before increasing again on Days 14, 16, 21, 28, and 35 PD (Figure 2). In wood tissues, starch granule numbers increased between Days 2 and 8, declined markedly on Days 10 and 12, and then increased moderately on Day 14. Counter to what was expected, starch granule numbers declined on Days 16 and 21 then increased again on Days 28 and 35 (Figure 3). Starch granule numbers were highest 4, 8, and 35 days PD. While both bark and wood tissues showed similar trends in starch granule distribution, bark tissue showed consistently greater means of starch granules in the cells compare to wood tissues at all sampling dates. Mean comparisons of starch granule distribution revealed significant differences between Days 4 and 8 PD when compared to Days 10 and 12 at α = 0.01.
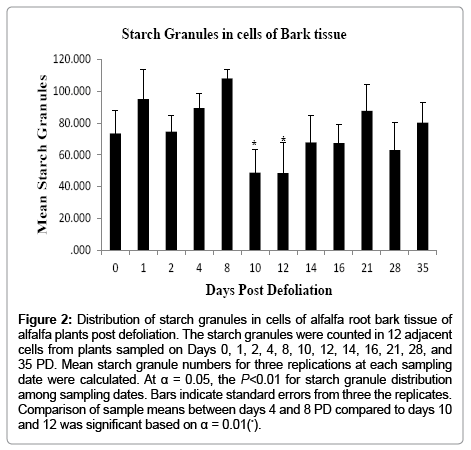
Figure 2: Distribution of starch granules in cells of alfalfa root bark tissue of alfalfa plants post defoliation. The starch granules were counted in 12 adjacent cells from plants sampled on Days 0, 1, 2, 4, 8, 10, 12, 14, 16, 21, 28, and 35 PD. Mean starch granule numbers for three replications at each sampling date were calculated. At α = 0.05, the P<0.01 for starch granule distribution among sampling dates. Bars indicate standard errors from three the replicates. Comparison of sample means between days 4 and 8 PD compared to days 10 and 12 was significant based on α = 0.01(*).
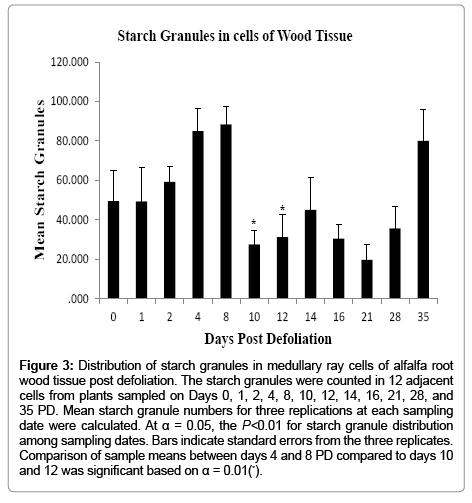
Figure 3: Distribution of starch granules in medullary ray cells of alfalfa root wood tissue post defoliation. The starch granules were counted in 12 adjacent cells from plants sampled on Days 0, 1, 2, 4, 8, 10, 12, 14, 16, 21, 28, and 35 PD. Mean starch granule numbers for three replications at each sampling date were calculated. At α = 0.05, the P<0.01 for starch granule distribution among sampling dates. Bars indicate standard errors from the three replicates. Comparison of sample means between days 4 and 8 PD compared to days 10 and 12 was significant based on α = 0.01(*).
Defoliation induces changes in starch granule structure
TEM confirmed that starch granule structure was altered post defoliation. In the first experiment TEM analysis revealed changes in starch granule structure of Day 12 plants that were compared to parallel aged non-defoliated plants (Figures 5C and 6B). In the second experiment starch granule structure was compared for 0 (Figure 6A), 12 (Figure 5 A and B), and 28 (Figure 4) Days PD. The surface of starch granules was defined, smooth, and continuous on Days 0 and 28 PD (Figures 4 and 6A). Starch granules were of different morphology and size (Figure 4 B). Generally, starch granules were observed in cells suggestive of Types A large (>15 μm), B medium (5 – 15 μm) and C small (< 5 μm) size classes. Some starch granules had protrusions at one end connecting them to other starch granules. Surfaces of large and medium starch granules had varied patterns of dense stripes whereas the smaller starch granules had none, one, or few stripes (Figure 4 B). Figure 5 depicts starch granule structures on Day 12 PD of varying states categorized here as early, intermediate, and late. In the early state, starch granule surfaces appear rough with funnel-shaped tunnels progressing from the surface to the interior of the granules (Figure 5 A and C). The intermediate state is characterized by crevices or channels that had made their way across the entire starch granule structure (Figure 5 B). These starch granules appear as puzzle pieces with some of the pieces still held together by the dense stripes. Other starch granules looked completely shattered into smaller granules (Figure 5 A). In some cells, electron dense material occurs in one corner in many starch granules. In the late state, many cells had few starch granules within their cells or were completely devoid of starch granules (Figure 5 A and C). Other structures worth noting in these cells were the presence of dark electron dense bodies (Figure 5) and mitochondria seen in the vicinity of some starch granules (Figure 5C).
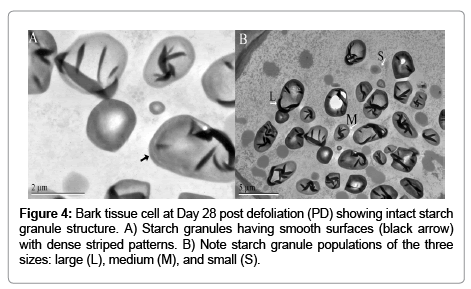
Figure 4: Bark tissue cell at Day 28 post defoliation (PD) showing intact starch granule structure. A) Starch granules having smooth surfaces (black arrow) with dense striped patterns. B) Note starch
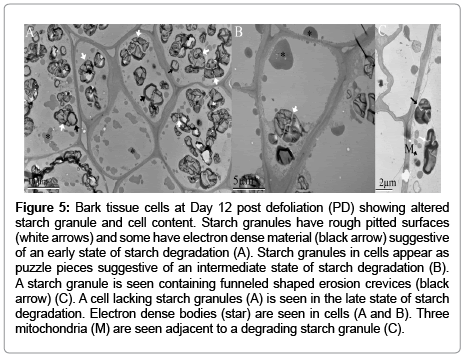
Figure 5: Bark tissue cells at Day 12 post defoliation (PD) showing altered starch granule and cell content. Starch granules have rough pitted surfaces (white arrows) and some have electron dense material (black arrow) suggestive of an early state of starch degradation (A). Starch granules in cells appear as puzzle pieces suggestive of an intermediate state of starch degradation (B). A starch granule is seen containing funneled shaped erosion crevices (black arrow) (C). A cell lacking starch granules (A) is seen in the late state of starch degradation. Electron dense bodies (star) are seen in cells (A and B). Three mitochondria (M) are seen adjacent to a degrading starch granule (C).
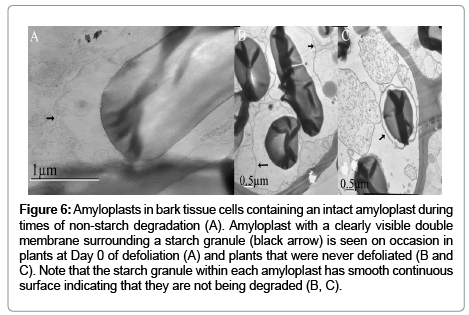
Figure 6: Amyloplasts in bark tissue cells containing an intact amyloplast during times of non-starch degradation (A). Amyloplast with a clearly visible double membrane surrounding a starch granule (black arrow) is seen on occasion in plants at Day 0 of defoliation (A) and plants that were never defoliated (B and C). Note that the starch granule within each amyloplast has smooth continuous surface indicating that they are not being degraded (B, C).
Occasionally, clear amyloplast membranes were observed (Figure 6). These amyloplasts were observed in cells from non-defoliated plants that were the same age group as comparable plants 12 Day PD (Figure 5C) or from Day 0 PD plants (Figure 6A). Amyloplast membranes were not consistently observed among the more than 200 micrographs examined and were never observed in any of the micrographs from 12 Day PD plants (Figure 5).
Alfalfa is an important perennial forage legume with starch as the most abundant reserve biomolecule in its taproot. Alfalfa biomass from established stands can be harvested at approximate monthly intervals during the growing season. Regrowth occurs from the remobilization of reserve starch that provides carbon for cellular metabolism and energy requirements. During regrowth of alfalfa, reserve starch concentration declines and upon establishment of sufficient shoot mass starch concentration builds up again. A number of factors trigger starch degradation including seasonal changes, seed germination, and defoliation. In this study we have used SEM to document that the distribution of starch granules declines significantly in cells of both bark and wood medullary rays on Days 10 and 12 PD. Starch granule distributions in bark tissues was consistently greater than in wood tissue (Figures 2 and 3). One possibility is that bark tissue, which consists of secondary phloem and phloem parenchyma cells, are in close proximity or at the site of sucrose transport compared to the wood ray cells that are some distance away. Our results agree with the general trend reported by [14] who used light microscopy to show striking reductions in the number of starch granules in the bark and wood tissues 14 days after defoliation in both a high starch and low starch alfalfa lines. However, our results differ in several respects. First, we used SEM to show the distribution of starch granules. Second, we examined root cross sections for the presence of starch granules from frequent sampling dates (Days 0, 1, 2, 4, 8, 10, 12, 16, 21, 28, and 35 PD) compared to less frequent sampling dates (Days 1, 7, 14, 21, 28) reported by [14]. By increasing the number of sampling dates we were able to pinpoint Day 12 as the transition day between net starch degradation and synthesis.
The structure and size of starch granules change during periods of starch synthesis and degradation. We report here that on Days 0 and 28 PD (Figures 4 and 6A) and 12 days non-defoliated plants starch granule surfaces were smooth and well-defined. In contrast, starch granules exhibited pitted rough surfaces on Day 12 PD (Figure 5). Pits are likely areas where hydrolytic enzymes are degrading the insoluble semicrystalline starch granule. Seasonal changes affect the starch granule structure in the nodules of beach pea (Lathyrus maritimus) in which cells accrue large starch granules in summer months that are changed into small shrunken amorphous structures in winter months [3] indicating that the process of starch degradation is occurring. Light induces starch granules to become smaller and rougher with funnel-shaped structures in turions of duckweed (Spirodela polyrhiza) plants as revealed by TEM [5]. Isolated starch granules from one day old germinated triticale seeds exhibited smooth surfaces when examined by SEM but starch granule structure changed on the second day of germination with the appearance of pits and equatorial grooves providing clues that the process of starch degradation was occurring [24]. The function of the greater numbers of starch granules having electron dense material lining their surfaces on Day 12 PD compared to Day 28 PD is unknown. These structures were observed in some of the starch granules in turions that were exposed to light to activate germination [5]. This material may represent a buildup of the degradation products of the amyloplast membrane and proteins or the fusion of oleosome with starch granules. Composition of these structures should be further investigated to determine their contribution to the degradation process.
Starch granules have been grouped into three categories namely A, B, and C based on their size and physical properties. The presence of the three types of starch granules in this study with the large and medium sizes being more predominant on Day 28 PD suggests that the cells are actively storing starch in established plants that are undergoing photosynthesis. In contrast, [5] observed two different sub populations of starch granules based, not on size, but by structural differences. It was reported that there is a time lapse when the different class sizes of starch granules are synthesized during wheat endosperm development [10]. These authors noted that A-type starch granules form during the first week of endosperm development, B-type starch granules formed around 10 to 12 days later, and C-types form 21 to 24 days post an thesis. Alfalfa taproots may likely follow a similar trend synthesizing large, medium, and small class sizes sequentially between Days 12 and 28 PD during the period of starch synthesis.
Reports differ regarding amyloplast integrity during starch breakdown in non-photosynthetic tissues. Degradation of reserve starch in mature cereal endosperm occurs in non-living tissues whereby all the degradation enzymes have access to starch inside one continuous space. In contrast, starch is located in the amyloplast of other types of living non-photosynthetic tissues, for example, roots, tubers, cotyledons of legume seeds, and turions. When turions were exposed to continuous red light, amyloplasts changed to structures that resembled chloroplasts [5]. These researchers were unable to observe a distinct amyloplast membrane by TEM [5]. Therefore they argued that during starch degradation in turions, the amyloplast remains intact, and thus the starch granules are degraded by plastidic hydrolytic enzymes rather than by cytosolic enzymes. Occasionally, we observed clearly distinct amyloplast membranes on Day 0 PD compared to non-defoliated plants (Figure 6) which suggests that at times of starch synthesis this organelle is intact. However, when starch is actively degraded it is likely that the amyloplast membrane breaks down since we never observed membranes on Day 12 PD (Figure 5). There is evidence of disintegrated amyloplasts in other species when starch is being degraded. For example, amyloplast membranes are not seen in beach pea root nodules in winter months when starch degradation occurs, but are observed in summer months during net starch synthesis [3]. Similarly to this study, [14] observed amyloplasts in roots of 28 PD plants but they did not report this observation for Day 14 when they showed the lowest starch granule levels. Based on our TEM data, it is possible that in alfalfa roots, during times of active starch degradation, amyloplasts disintegrate making starch accessible to cytosolic enzymes.
Figure 7 depicts a proposed pathway of starch degradation in alfalfa roots. In this suggested pathway an unknown signal is perceived by the amyloplast membrane which triggers the membrane to breakdown. There is still a possibility that amyloplasts in alfalfa roots stay intact during the process of active starch degradation as is reported for turions [5] thus placing the enzymes close to their substrates. We have reported that the alfalfa β-amylase promoter has common motifs with those of Arabidopsis key starch degradation genes (GWD, PWD, BAM, ISA3) compared to non-starch genes [25] suggesting that these genes may be co-regulated and work in synchrony to degrade starch. The activity of α-amylase has been reported to increase following defoliation when starch concentration declines in alfalfa taproots [17]. Therefore, if the amyloplast stays intact then degradation of reserve starch in alfalfa taproots may follow the same pathway employed by turions [5] which combines aspects of cereal endosperm and transitory starch degradation.
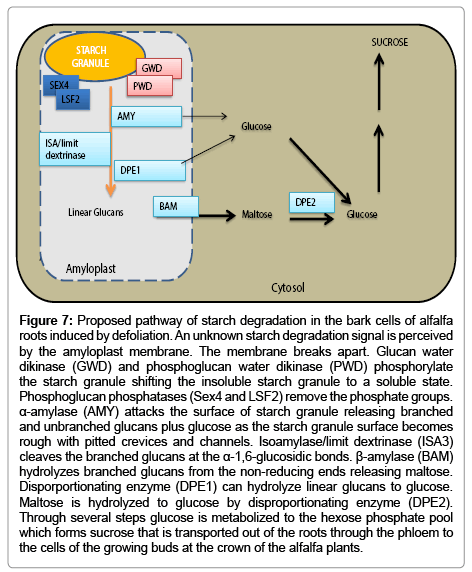
Figure 7: Proposed pathway of starch degradation in the bark cells of alfalfa roots induced by defoliation. An unknown starch degradation signal is perceived by the amyloplast membrane. The membrane breaks apart. Glucan water dikinase (GWD) and phosphoglucan water dikinase (PWD) phosphorylate the starch granule shifting the insoluble starch granule to a soluble state. Phosphoglucan phosphatases (Sex4 and LSF2) remove the phosphate groups. α-amylase (AMY) attacks the surface of starch granule releasing branched and unbranched glucans plus glucose as the starch granule surface becomes rough with pitted crevices and channels. Isoamylase/limit dextrinase (ISA3) cleaves the branched glucans at the α-1,6-glucosidic bonds. β-amylase (BAM) hydrolyzes branched glucans from the non-reducing ends releasing maltose. Disporportionating enzyme (DPE1) can hydrolyze linear glucans to glucose. Maltose is hydrolyzed to glucose by disproportionating enzyme (DPE2). Through several steps glucose is metabolized to the hexose phosphate pool which forms sucrose that is transported out of the roots through the phloem to the cells of the growing buds at the crown of the alfalfa plants.
In summary, we have demonstrated that during the starch degradation process induced by defoliation in alfalfa taproots there is a significant difference in the pattern of the distribution of starch granules in parenchyma cells of bark and xylem ray cells. The starch granule structure is also altered by defoliation. We have also noted the presence of three size classes of starch granules and occasionally a clearly discernable amyloplast in alfalfa taproots during times of starch synthesis. This study reveals that around 12 days post defoliation is when the number of starch granules is at its lowest. Our results revealed the timeline which assays for the molecular components regulating the non-photosynthetic starch degradation pathway may provide meaningful information with potential to contribute towards alfalfa productivity.
This work was supported in part by the National Science Foundation-MRI grant ( # 0820958). We thank Drs. Tim Bell and Noe de la Sancha for providing aid with statistical analysis.