Journal of Leukemia
Open Access
ISSN: 2329-6917
ISSN: 2329-6917
Research Article - (2018) Volume 6, Issue 3
Angiopoietins and TIE2 are necessary for blood and lymphatic vessel remodeling during embryonic, postnatal development and homeostasis of the mature vasculature and expected to be a valuable marker in acute leukemia. The present study aimed to assess the expression of TIE2 and angiopoietin-2 in acute leukemia and its correlation with disease behaviour. The study included 62 patients and 19 sex- and age-matched healthy controls, divided into 2 groups, 21 Acute Lymphoblastic Leukaemia (ALL) patients, and 41 Acute Myeloid Leukaemia (AML) patients and 19 sex- and age-matched healthy controls. Bone marrow (BM) aspirate examination, Immunophenotyping and assessment of TIE2 expression for peripheral or BM samples by Flow cytometer and serum angiopoietin-2 by using enzyme-linked immunosorbent assay.
The study results showed that TIE2 & Angiopoietin2 were expressed in AML patients more than ALL patients. In ALL patients CD45 and CD5 showed statistically significant correlation with TIE2 but CD45, CD14 showed statistical significance correlation with Angiopoietin2 in AML patients. CD33 was correlated with TIE2 and Angiopoietin2 in AML patients. ROC curve for TIE2 in ALL Cut off >3.8 AUC 0.977 with Sensitivity 90.5% & Specificity 94.7% P-value941 AUC 0.753 with Sensitivity 71.4% & Specificity 78.9% P-value0.002 While in AML TIE2 Cut off>4.8 AUC 0.997 with Sensitivity 95.1% & Specificity 100% P-value1838 AUC 0.871 with Sensitivity 60.9% & Specificity100% P-value <0.001. Univariate logistic regression Analysis of leukemic patients showed that Angiopoietin2, TIE2, WBCs count, Platelets count were Statistically Significant. The present study concluded that TIE2 and angiopoietin-2 positive expression are independent prognostic factor in adult acute leukemia and its expression could characterize a group of acute leukemic patients with monocytic lineage.
Keywords: TIE2; Angiopoietin 2; leukemia
Ang-2: Angiopoietin 2; RTKs: Receptor Tyrosine Kinases; ECs: Endothelial Cells; Angs: Angiopoietins; ITIM: Immunoreceptor Tyrosine-based Inhibitory Motifs; HSCs: Haematopoietic Stem Cells; Tie2: Tyrosine Kinase Receptor; AML: Acute Myeloid Leukaemia; VEGF: vascular endothelial growth factors; AL: Acute Leukemia; ALL: Acute Lymphocytic Leukemia; RTKs: Receptor Tyrosine Kinases; TEMs: Tie2-Expressing Monocytes.
Acute Myeloid Leukemia (AML) is the most common acute leukemia in adults, involved in hematopoietic proliferation and differentiation resulting in the accumulation of blasts. Acute Lymphoblastic Leukemia (ALL) is a hematologic malignancy propagated by impaired differentiation, proliferation, and accumulation of lymphoid progenitor cells in the bone marrow and/or extramedullary sites. Receptor Tyrosine Kinases (RTKs) expressed in the Endothelial Cells (ECs) of blood and lymphatic vessels control the development and functions of the cardiovascular and lymphatic systems. The Vascular Endothelial Growth Factor (VEGF) and their endothelial receptors (VEGFRs) are key regulators of angiogenesis and vascular integrity. The angiopoietin ligand/Tie receptor pathway is necessary for blood and lymphatic vessel remodeling during embryonic and postnatal development and for homeostasis of the mature vasculature [1-4].
Angiopoietins (Angs) are a family of angiogenic growth factors, the best studied of them are Ang-1 and Ang-2, which signal through the membrane RTKs (Tie2), in simple terms, have counteracting effects with Ang-1 acting to stabilize newly formed blood vessels and Ang-2 having a destabilizing effect. Tie2 expression is also evident in a subpopulation of type M2 Tie2-expressing monocytes (TEMs), in haematopoietic stem cells and in muscle satellite cells located among skeletal muscle myofibres in association with the microvasculature. In solid tumor biology these increased levels of angiogenesis are critical for supplying the growing tumor mass with sufficient oxygen and nutrients, in hematologic malignancies no actual solid tumor mass, so the role of angiogenesis and angiogenic factors is rather underestimated. This work was plane to investigate the expression of TIE2 & Angiopoietin2 in acute leukemia patients by flow cytometry and if there is difference in its expression between AML and ALL which will be target for chemotherapy [5-7].
Patients
The present pilot study included sixty-two newly diagnosed acute leukemia patients, attending the Hematology/Oncology Clinic of the Sohag University Hospital, in the period from October 2016 to November 2017. Inclusion criteria de novo acute leukemia exclusion criteria other hematological disease, acute leukemia on therapy. We divided them into 3 groups as following: Group I : consisted of 21 patients with acute lymphoblastic leukaemia their ages ranged from 18-70 years with a mean of 38.7 ± 13.5 years, they were 12 males and 9 females. Group II: included 41 patients diagnosed with acute myeloid leukaemia, their ages ranged from 18-80 years with a mean of 44.1 ± 18.2 years. They were 18 males and 23 females.
Group III: consisted of 19 sex- and age-matched healthy controls, their ages ranged from 20-65 with a mean of 44.05 ± 13.2 years. They were 13 males and 6 females The diagnosis of leukemia subtype was based on the standard morphological and Immunophenotyping (IPT) criteria [8,9]. These patients comprised 5 with M0, 8 with M1, 12 with M2, 11 with M4 and 5 with M5, 7 with L1 and 14 with L2 according to French-American-British (FAB) subtypes. Nineteen subjects with nonhematological malignancy matching the patients in age and sex were recruited to serve as the control group. The study design was approved by the Research Ethics Committee of the Sohag University, Faculty of Medicine. All samples were taken after obtaining written informed consent from the patients and the controls.
All subjects and controls subjected to the following procedures:
1) Detailed history taking and bedside examination.
2) Clinical examination including vital signs assessment, general examination, chest, heart and abdominal examination.
3) Laboratory investigations:
a. Complete blood count (CBC) using Cell-Dyn 3700, automated cell counter, (Abbott diagnostic, Dallas, USA), with examination of leishman stained peripheral blood (PB) films for differential leucocytic count and blast cells count.
b. BM aspiration with examination of Leishman-stained films for bone marrow blasts count.
c. Immunophenotyping (IPT) analysis and assessment of TIE2 expression of the BM aspirate or peripheral blood Diagnosis of acute leukemia was based on the presence of blast cells >20% in BM film according to WHO proposal, together with presence of immunophenotyping results consistent with AML and ALL [10].
Sampling
2 milliliters of PB was delivered into an EDTA vacutainer tube (1-2 mg/mL blood) for CBC and 4 milliliters of PB into plain tube for serum Ang-2. 2 milliliters of BM aspirate withdrawn from each patient and control under completely aseptic conditions and delivered into EDTA vacutainer tube. Samples were used for IPT and TIE2 cytoplasmic expression by flow cytometry.
The EDTA anticoagulated BM or PB samples were diluted with phosphate buffered saline (PBS), Ph 7.4 (Sigma chemicals, St Louis), the final cell suspension was adjusted at 10 × 103/ml. For each sample, asset of tubes was prepared for a panel of Fluroesceinisothiocyanate (FITC)/ Phycoerythrin (PE)-conjugated MoAbs used for diagnosis of acute leukemia including one for the isotypic matched negative control.
The monoclonal antibodies used were myeloid markers (CD13, intracellular MPO andCD33), Monocytic marker CD14 ,CD 15 and common progenitor markers (HLA-DRand CD34) B-cell lymphoid markers (CD10, CD19, and CD22), T-cell lymphoid markers (CD3, CD2, CD5, and CD7), and All MoAbs were purchased from (Becton Dickinson Bioscience, San Jose, California) including PE-TIE2 MoAbs
Detection of TIE2 expression on blast cells
100 μL of whole blood (or BM) was lysed using lysis solution (Becton and Dickinson) for 10 minutes. Cells were washed once and resuspended in 1ml PBS. A mixture of 500 μL 4% paraformaldehyde as fixative, 500 μL PBS and 5 μL tween 20 as detergent was added to the cells and incubated for 10 min. The cells were washed and 10 μL of phycoerythrin (PE) labeled MoAb for detection of TIE2 (BD, USA) was added and incubated for 30 min. at 4°C. Cells were washed, resuspended in 500 μL. Blast cell population was selected based on its forward and side scatter properties. The negative isotypic control was set at 0.5% (Figure 1).
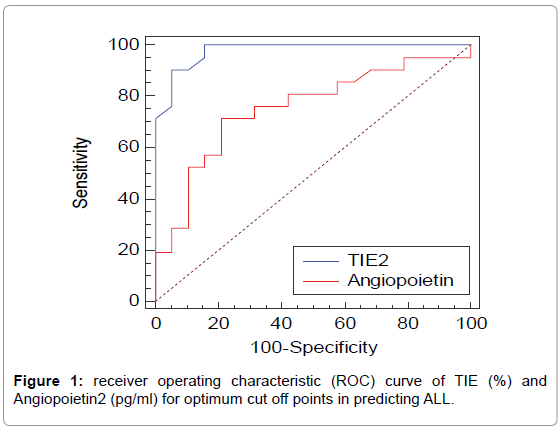
Figure 1: receiver operating characteristic (ROC) curve of TIE (%) and Angiopoietin2 (pg/ml) for optimum cut off points in predicting ALL.
Ang-2 measurement by ELISA
Serum levels of Ang-2 was assayed by enzyme-linked immunosorbent assay (ELISA) using commercially available kits (Elabscience systems Houston, Texas USA) Catalog No: E-EL-H0008 Following the manufacturers’ instructions.
Statistical methods
Data were analyzed using SPSS computer program version 22.0 and Medcalc version 15.8.0. Quantitative data were expressed as means ± standard deviation. Chi-Square test was used for comparison between qualitative variables. Quantitative data were tested for normality by The Kolmogorov–Smirnov test and Shapiro–Wilk test. For non-parametric data, Mann–Whitney U test was used for comparing two quantitative variables. Kruskal-Wallis H test was used for comparison between more than two quantitative variables when variables were non-parametric. Spearman’s correlation was used for testing of correlation between different quantitative variables. Spearman’s correlation was used for testing of correlation between different quantitative variables. When data was normally distributed, Independent Sample t test and ANOVA test were used. Pearson correlation was used for testing of correlation between different normally distributed quantitative variables. Binary logistic regression was used to determine predictors of leukaemia. Receiver operating characteristic (ROC (curves were constructed for the TIE (%) and Angiopoietin, and the areas under the ROC curve values with 95% CIs were calculated and compared with each other. Optimal cut-off values were determined; sensitivity, specificity, positive predictive rate and negative predictive rate were calculated. A 0.05 level was chosen as a level of significance in all statistical tests used in the study.
Clinical and some laboratory data were illustrated in Table 1, showed sex and age distribution and peripheral blood count within 3 studied groups and comparison of TIE2 (%) level and Angiopoietin 2 in relation to demographic and clinical data of the studied patients. Comparison of TIE2 (%) and Angiopoietin2 (pg/ml) among the studied groups were demonstrated in Table 2. Comparison of number of cases, TIE2 (%) and Angiopoietin2 (pg/ml) according to FAB classification between different leukemia groups were shown in Table 3. Correlation between TIE2 (%) and Angiopoietin2 (pg/ml) with age, laboratory and immunophenotyping parameters among the ALL patients were demonstrated in Table 4. CD45andCD5 show statistical significant negative correlation with TIE2 in ALL patients. Correlation between TIE2 (%) and Angiopoietin2 (pg/ml) with age, laboratory and immunophenotyping parameters among the AML patients, as CD33 show positive statistical significant correlation with TIE2 and CD45, CD14, CD33 show statistical significant positive correlation with Angiopoietin2 as shown in Table 4.
| Parameter | ALL group (N=21) |
AML group (N= 41) |
Control group (N=19) |
P-value |
|---|---|---|---|---|
| Gender Male Female |
12 (27.9%) 9 (23.7%) |
18 (41.9%) 23 (60.5%) |
13 (30.2%) 6 (15.8%) |
0.190** |
| Age Mean± S.D. Median (Range) |
38.7 ± 13.5 36 (18-70) |
44.1 ± 18.2 42 (18-80) |
44.05 ± 13.2 43 (20-65) |
0.405* |
| WBCS Mean± S.D. Median (Range) |
30.4 ± 24.9 24 (1.3-82) |
39.6 ± 32.6 36.8 (1.4-111) |
6.3 ± 1.7 5.9 (4.2-10.9) |
<0.001* |
| Platelets Mean± S.D. Median (Range) |
70.9 ± 49.1 77 (6-158) |
79.2 ± 72.9 67 (6-377) |
251.3 ± 54.3 250 (177-340) |
<0.001* |
| Hemoglobin g/dl Mean± S.D. Median (Range) |
7.5 ± 1.4 7.3 (5.4-11.2) |
7.9 ± 2.4 8 (2.8- 4) |
13.6 ± 1.5 13.5 (11-15.9) |
<0.001* |
*P-value was calculated by Kruskal Wallis test. **P-value was calculated by Chi square test. P-value<0.05 is statistically significant
Table 1: comparison between the studied groups regarding gender, age and certain laboratory data.
| Parameter | ALL group (N=21) |
AML group (N= 41) |
Control group (N= 19) |
P-value | P1 | P2 | P3 |
|---|---|---|---|---|---|---|---|
| TIE2 (%) Mean± S.D. Median (Range) |
7.09 ± 2.8 6.9 (3.1-11.5) |
11.7 ± 6.2 9.4 (4.2-28) |
2.03 ± 1.1 2 (0.7-4.8) |
<0.001* | <0.001* | <0.001* | 0.002* |
| Angiopoietin 2 (pg/ml) Mean± S.D. Median (Range) |
1334.5 ± 694.9 1369 (270-2870) |
2344.7 ±1340.3 2145(463-5215) |
792.6 ± 415.3 745(245-1838) |
<0.001* | <0.001* | 0.006* | 0.006* |
P- value compared the three groups and was calculated by Kruskal Wallis test.
p1 compared AML and control groups and was calculated by Mann–Whitney test
P2 compared ALL and control groups and was calculated by Mann–Whitney test
P3 compared AML and ALL group and was calculated by Mann–Whitney test
Table 2: Comparison of TIE2 (%) and Angiopoietin2 (pg/ml) among the studied groups.
| Parameter | No. (%) | TIE2 (%)Mean ± SD | P-value | Angiopoietin2 (pg/ml) Mean ± SD | P-value |
|---|---|---|---|---|---|
| M0 M1 M2 M4 M5 |
5 (8.1) 8 (12.9) 12 (19.4) 11 (17.6) 5 (8.1) |
6.4 ± 1.9 8.1± 3.3 12.2 ± 4.06 14.8 ± 8.1 14.7 ± 7.5 |
0 .019 * | 1538.2± 948.3 1332.8 ± 680.1 2412.4 ± 1028.9 3030.5 ± 1543.8 3099.2 ± 1582.8 |
0 .029 * |
| L1 L2 |
7 (11.3) 14 (22.6) |
6.7 ± 2.8 7.3 ± 2.9 |
0.689 | 1690.1 ± 686.7 1156.7± 650.5 |
0.098 |
*Statistically significant * P-value was calculated by Kruskal Wallis Test ** P-value was calculated by Independent Samples T test P-value<0.05 is statistically significant
Table 3: Comparison of number of cases, TIE2 (%) and Angiopoietin2 (pg/ml) according to FAB classification between different leukemia groups.
| Parameter | TIE2 (%) | Angiopoietin2 (pg/ml) | ||
|---|---|---|---|---|
| P-value ALL |
P-value AML |
P-value ALL |
P-value AML |
|
| Age (years) | 0.989 | 0.709 | 0.282 | 0.822 |
| WBCS (x1000/mm3) | 0.246 | 0.637 | 0.202 | 0.850 |
| HB (g/dl) | 0.421 | 0.664 | 0.281 | 0.612 |
| Platelets (x1,000/mm3) | 0.276 | 0.812 | 0.503 | 0.398 |
| Peripheral Blast cells | 0.403 | 0.894 | 0.436 | 0.872 |
| BM Blast | 0.116 | 0.262 | 0.201 | 0.332 |
| CD14 | 0.390 | 0.167 | 0.152 | 0.041* |
| CD45 | 0.048* | 0.180 | 0.796 | 0.043* |
| CD5 | 0.029* | 0.535 | 0.337 | 0.958 |
| CD19 | 0.329 | 0.181 | 0.922 | 0.407 |
| CD10 | 0.135 | 0.369 | 0.735 | 0.934 |
| CD22 | 0.858 | 0.393 | 0.767 | 0.270 |
| CD4 | 0.604 | 0.394 | 0.090 | 0.271 |
| CD8 | 0.445 | 0.652 | 0.729 | 0.397 |
| CD3 | 0.290 | 0.730 | 0.471 | 0.099 |
| CD16+56 | 0.304 | 0.568 | 0.104 | 0.688 |
| CD13 | 0.615 | 0.620 | 0.903 | 0.367 |
| MPO | 0.482 | 0.978 | 0.519 | 0.705 |
| CD33 | 0.504 | 0.038* | 0.451 | 0.032* |
| DR | 0.792 | 0.998 | 0.282 | 0.969 |
| CD34 | 0.192 | 0.101 | 0.202 | 0.131 |
*Statistically significant
Table 4: Correlation between TIE2 (%) and Angiopoietin2 (pg/ml) with age, laboratory, immune phenotyping parameters among the AML patients (n=41) &ALL patients (n=21).
Receiver operating characteristic (ROC) curve of TIE2 (%) and Angiopoietin2 (pg/ml) for optimum cut off points in predicting ALL
TIE2 Cutoff>3.8 AUC 0.977 with Sensitivity 90.5% and Specificity 94.7% P-value<0.001, Angiopoietin2 Cutoff >941AUC 0.753 with Sensitivity 71.4% and Specificity 78.9% P-value 0.002 Figure1.
Receiver operating characteristic (ROC) curve of TIE2 (%) and Angiopoietin2 (pg/ml) for optimum cut off points in predicting AML
TIE2 Cutoff>4.8AUC 0.997 with Sensitivity 95.1% and Specificity 100% P-value<0.001. Angiopoietin2 Cutoff >1838 AUC 0.871 with Sensitivity 60.9% and Specificity 100% P-value <0.001 Figure 2.
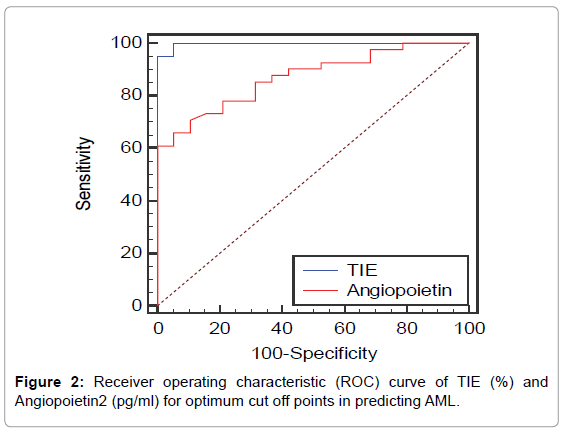
Figure 2: Receiver operating characteristic (ROC) curve of TIE (%) and Angiopoietin2 (pg/ml) for optimum cut off points in predicting AML.
Univariate logistic regression analysis about predictors of leukaemia
Angiopoietin2, TIE2, WBCs count and Platelets count displayed significant association with leukemia in univariate analysis shown in Table 5.
| Characteristics | OR (CI 95%) | P – value |
|---|---|---|
| Age Gender TIE2 (%) Angiopoietin2 WBC Platelets |
0.993 (0.96-1.025) 2.3 (0.78-6.9) 8.1 (2.13-30.8) 1.002 (1.001-1.003) 1.2 (1.03-1.3) 0.97 (0.96-0.98) |
0.668 0.131 0.002* 0.002* 0.016* <0.001* |
*Statistically significant
Table 5: Univariate logistic regression analysis about predictors of leukaemia.
The diagnosis of AL requires the presence of 20% or more blasts in the bone marrow, further investigations by morphological, flow cytometry studies immunophenotyping, and cytogenetic testing is important.
New blood vessel formation, is a hull mark in cancer progression and metastasis, it is known that the induction of new blood vessel formation is a dependent factor of hematological malignancies [11].
Ang-2 regulates angiogenesis by binding to its well-known receptor Tie2 on endothelial cells and through controlling Tie2- negative angiogenic endothelial cells and invasion of Tie2- by binding to integrins [12].
A total of 62 patients were included in the present study and 19 sex- and age-matched healthy controls classified into 3 groups. To our knowledge, no data exists so far on blood levels of serum Ang-2 and TIE2 in ALL.
The level of Angiopoietin2 in normal control group was 792.6 ± 415.3 pg/ml with range of 245-1838 pg/ml. In ALL patients, the level of Angiopoietin2 ranged from 270-2870 pg/ml with a mean of 1334.5 ± 694.9 pg/ml. In AML patients, the level of Angiopoietin 2 ranged from 463-5215 pg/ml with a mean of 2344.7 ± 1340.3 pg/ml.
In the present study, we found TIE2 expressed in all 3 groups. In control group Tie-2 expression was ranged from 0.7-4.8% with a mean of 2.03 ± 1.1%. In ALL patients, it ranged from 3.1-11.5 % with a mean of 7.09 ± 2.8 %. In AML patients, Tie-2 ranged from 4.2-28% with a mean of 11.7 ± 6.2 %.
This is in accordance to Nasr, 2015 who studied TIE2 surface expression by flowcytometry on AML patients [13]. Control group showed that Tie-2 expression was ranged from 7-14% with a mean of 10 ± 2.5. In AML patients, the level of Tie-2 ranged from 5% to 30% with a mean of 11.8 ± 9.5%.
As regard demographic data, we found no relation between either TIE2 or Angiopoietin 2 expression with age of the patients which is in accordance to Nasr and Schliemann et al. [13,14].
As regard, gender, we found no relation with Tie-2 expression but Angiopoietin 2 level was higher in females than males in ALL cases. This was in agreement to Nasr, 2015 and Aref et al. But Lee et al. show that Tie-2 level was higher in males than in females [13,15,16].
As regard comparison of TIE2 and WBC count, we found highly significant difference between AML and control group (P<0.001). Nasr, 2015 and Riccioni et al., 2007 found that Tie-2 positive patients had increased WBC count compared with Tie-2 negative patients [13,17].
In our study, Tie-2 and Angiopoietin 2 was highly expressed in M4, M5, M2 and low expression was in M0, M1, L1 and L2. Nasr, 2015 agreed with us but showed that Tie-2 was highly expressed in M2 than M3, while in high expression group it was highly expressed in M5 than M1, also Riccioni et al., 2007 found a high expression in M4 and M5 leukemias among Tie-2 positive AMLs [13,17].
Lee et al. found that Tie-2 seemed to be expressed in AMLs in most of French-American-British (FAB) subtypes [16].
In our study, in ALL group there was a significant negative correlation between Tie-2 expression with CD45 (P<0.048) and CD5 (P<0.02), while there was no significant correlation between Tie-2 expression with other lymphoid markers and there was no significant correlation between angiopoietin 2 expression with any lymphoid markers. In AML group there was a significant positive correlation between Tie-2 expression and angiopoitein 2, with CD33 (P<0.038and P<0.032) while there was no significant correlation between Tie-2 expression with other myeloid markers. In AML group, there was a significant positive correlation between angiopoietin 2 expression with CD14 (P<0.041) and CD 45 (P<0.043) while there was no significant correlation between angiopoietin 2 expression with other myeloid markers. This is different from Nasr, 2015 who found highly significant positive correlation between Tie-2 expression with CD34 (P<0.001) and a significant positive correlation with HLA-DR (P<0.05), while there was no significant correlation between Tie-2 expression with CD13, CD14, CD33 and CD7 (P> 0.05) [13]. Riccioni et al. found that a high percentage of Tie-2 positive AMLs were CD14 positive, whereas only a minority of Tie-2 negative were CD14 positive [17]. Murdoch et al. found that Tie-2 monocytes accumulate in hypoxic areas of tumors; they promote tumor angiogenesis in part by shutting down their secretion of IL-12 [18].
As regarding ROC curve of TIE2 (%) and Angiopoietin2 (pg/ml) for optimum cut off points in predicting AML, we found that TIE2 Cutoff >4.8AUC 0.997 with Sensitivity 95.1% and Specificity 100% P-value<0.001, Angiopoietin2 Cutoff >1838 AUC 0.871 with Sensitivity 60.9% and Specificity 100% P-value <0.001. Koenecke, agreed with us but he used ELISA for detection of Angiopoietin 2 and TIE2. He found that Angiopoietin 2 at 2.18 ng/mL was associated with a prognostic sensitivity of 55% and a specificity of 76% (AUC 0.64, p=0.002) and Tie2 concentration of 2.24 ng/mL was associated with a prognostic sensitivity of 69% and a specificity of 49% (AUC 0.62, p=0.01) [19].
As regarding ROC curve of TIE2 (%) and Angiopoietin2 (pg/ml) for optimum cut off points in predicting ALL we found ALL TIE2 Cutoff>3.8 AUC 0.977 with Sensitivity 90.5% and Specificity 94.7% P-value<0.001, Angiopoietin2 Cutoff>941AUC 0.753with Sensitivity 71.4% and Specificity 78.9% P-value 0.002. In our best knowledge, there is no one searched TIE2 (%) and Angiopoietin2 on ALL up till now.
The expression of TIE2 and Angiopoietin 2 by leukemic cells observed in the present study, may contribute to the tumour angiogenesis and in conjunction with the present results, highlight the potential value of TIE2 and Angiopoietin2 as targets for therapy in AML patients. TIE2 and Angiopoietin 2 signalling with specific antibodies or antagonists may render TIE2 and Angiopoietin2 AML cells more susceptible to differentiating agents and anti-tumour cell responses. Further studies are required to elucidate the role of TIE2 and Angiopoietin 2 in the progression of ALL and ascertain its potential as therapeutic targets.
• Ethics approval and consent to participate: Approval for this work was obtained from the Ethics Committee, Faculty of Medicine, Sohag University.
• Consent for publication: not applicable.
• Availability of data and materials: All data generated or analysed during the present study are included in this published article.
• Competing interests: The authors declare that they have no competing interests.
• Funding: There is no funding for this work.
1. Heba A. E. Ahmed: conceptualized the study, collected the data, and shared in the writing of the manuscript.
2. Shereen P. Aziz: shared in data collection, performed the statistical analysis and shared in the writing of the manuscript.
3. Abeer A. F. Hassan: contributed to manuscript construction and reviewing.
4. All authors have read and approved the final manuscript.