Journal of Plant Biochemistry & Physiology
Open Access
ISSN: 2329-9029
ISSN: 2329-9029
Research Article - (2014) Volume 2, Issue 1
As cotton plant is treated with insecticides especially with pyrethroids, aphids and mites often increase. Understanding the effects of insecticide preparations on sugars and soluble proteins which are expected to be food niche and defensive compounds will help to predict the probable side-effects of them. The effects of five composite insecticide preparations on soluble proteins, total and reducing sugars, terpenoid aldehydes, and chitinase and peroxidase activities of the leaves of one Cotton cultivar were studied. Field experiments were carried in cotton fields of Tokshin district of Turpan region (Xinjiang Autonomous Region, China). The effects of insecticide preparations were reversely correlated with the activities of chitinase and peroxidase enzymes. The gained results showed that, after treatment with insecticide preparations, the quantity of soluble proteins increased whereas the activity of the PR proteins was lower than control leaves. Terpenoid aldehydes having anti-feedant properties also increased. All composite insecticides lowered the quantity of reducing sugars. However nonlinear changes were observed with the total sugars in cotton leaves after treatment.
Worldwide 20% of all agricultural crops are lost annually as a result of insects and mites damage [1] and the plants are necessarily treated with pesticides, only 5% of which are estimated to reach the target organisms [2]. Cotton is one of the plants susceptible to insects. For cotton crop safe, insecticides are used in different vegetation periods of plant, depending on the emergence of pests, their fecundity and increase. Most insecticides are considered to be useful for a little period, for 10-15 days. Although insecticide preparations are sprayed in huge amounts and to large fields, their treatment does not always lead to positive results and it makes it necessary to use chemical and biological methods together. Specifically cotton bollworm can be biologically controlled with beneficial insects including bugs and pheromone traps in such a way [3,4]. However they cannot help to get rid of it instantly. Cotton bollworm causing huge crop losses is efficiently managed using pyrethroid insecticides, but meanwhile beneficial insects also vanish. Insect series multiplicity, high adaptability and their rapid fecundity makes it very difficult to struggle against them. On the other hand changes in plant metabolism occurring after insecticide treatment might make plants less resistant against pests. Increased number of cotton aphid [5,6] and spider mite [7] populations in cotton fields, treated against cotton bollworm and other insect pests, has become a serious problem in cotton breeding countries worldwide. And the plants are inevitably treated with insecticide preparations against these pests which might cause higher crop losses. The more used chemical method, applying pesticides, abridges number of insect-pests population until the grade, with insignificant economic damage. Such an approach significantly eliminates the accrual possibility of resistant insects; however it is supposed to use insecticides of electoral toxicity. The vast amount of these preparations, sprayed on cotton plant leaves remains for 1-2 weeks or longer, depending on sunrise, wind, rain and other factors. Consequently it influences to defensive compounds metabolism and sunlight adsorption in leaves resulting in higher or lower resistance against pathogens. Cotton aphid and spider mite are of the most serious insect species occurring in cotton fields treated with insecticides [8,9]. The reason of this phenomenon is explained with the increased level of sugars and soluble proteins which are considered to be food niche for aphid and mites. Researches [10,11] give evidence that, there is a link between the amount of total sugars and aphids and mites quantity.
The aphid quantity increase in cotton after treatment with insecticides is explained with the increased level of sugars, especially monosaccharide and oligosaccharides in leaves and other vegetative and generative organs.
The other reason for the increased level of insects is expected to be the lower activity of PR proteins having insecticidal property such as chitinase and glucanase. Chitinase and β-1, 3-glucanase, the main enzymes degrading chitin - the exoskeleton of insects and fungal and bacterial cell wall, induce in pathological conditions, which are considered a part of the multiple defense systems of plants [12,13]. Peroxidases are key enzymes in lignification and hypersensitive responses in plants, which limit disease [12]. Works [14-16] have shown that sap-feeding arthropods (aphids, whiteflies, mites) induce PR proteins in plants.
In interactions between plants and pathogens and other chemical agents, Pathogenesis Related (PR) proteins are often compatibly or incompatibly induced in response to these factors. Because of the synthesis and accumulation, quantity and activity change by the influence of different abiotic and biotic factors, they are regarded to play an important role in the plant defense response. Chitinases together with glucanases can be induced by pathogens or exogenous chemicals [17,18], and release oligosaccharide elicitor inducing the production of phytoalexins [19].
Peroxidases are very important enzymes as preventive antioxidants by removing noxious peroxides. In different plants these enzymes were detected; e.g. in tobacco PR-9 Tobacco “lignin-forming peroxidase” [20] and in cotton plant some isoforms have been researched [21]. Peroxidase is considered as one of factors providing defense of cotton plant against pathogens.
Lysigenous pigment glands in Upland cotton contain a diverse mixture of terpenoid aldehydes, including gosssypol, hemigossypolone, methyl and dimethyl ethers of gossypol, heliocides H1, H2, H3, H4 etc. These terpenoids are involved in plant resistance to phytophagous insects. The resistance of Gossypium species to insects was enhanced by these compounds. In cultivated cottons, glands in achlorophyllous plant parts contained predominately the terpenoid aldehyde gossypol in G.hirsutum and gossypol, methyl and dimethyl esters of gossypol in G.barbadense [22]. According to many biochemical researches hemigossopolone and heliocides H1, H2, H3, H4 are the major terpenoid aldehydes in leaves and gossypol is the major terpenoid aldehyde in flower buds. Some primitive and wild strains of cotton (Gossypium Hirsutum L.) are more resistant to cotton bollworms (Heliothis spp.). This resistance has already been correlated with high concentrations of these terpenoids isolated from flower buds. The significance of these compounds in cotton plant is in the majority of these compounds in resistance to some insects as Heliothis armigera, Heliothis spp. which bring huge loss in cotton crop [23].
Field experiments
One cultivar of (Gossypium hirsutum) Deizi 80 growing in a field of Tokshin district (Xinjiang-Uygur Autonomic Region, China) treated with five different insecticides preparations. Different preparation was used on plants growing in pre-bloom stage. Following appropriate average results plant leaves were taken from the five locations of the treated area and from the bottom, middle and upper side of plant. Leaf samples were taken during two weeks, every two days before the sunset. For laboratory experiments taken leaves were freed from stipule, petiole, veins, and midrib. The leaves taken for the experiments were statistically different.
Extraction and quantity determination of sugars
Crude cotton leaves were ground with liquid nitrogen using mortar and pestle treating periodically three-four times. Ground leaf samples have been passed through sieve. Total sugars were extracted with boiling water (85-90°C) in PTHW heating extraction device, for 40 min. periodically shaking. The extract was filtered and contaminants of a protein nature were precipitated in supernatant with a saturated solution of Ba(CH3COO)2 and remaining quantity of it removed with Na2SO4 solution. Then the solution was filtered through filter paper. The gained supernatant served for total and reducing sugars quantity analysis.
The quantity of total sugars was determined with Phenol-vitriolic method [24]. The optical density was determined in UV-2550 including blank solutions (n=3, RSD 2,907).
The quantity of reducing sugars was determined by Somogyi- Nelson reaction. Optical densities of gained solutions were defined in UV-2550 at 660 nm (n=3, RSD=2.93) [25,26].
Extraction of proteins
Cotton leaves treated with insecticides and taken for control were first freed from stipule, petiole, veins, and midrib, dried in lyophile freeze-drier and ground continuously three times with liquid nitrogen using mortar and pestle, and extracted with Tris-HCl buffer (0.1 M pH 6,8) for 2 h using magnetic stirring device. The crude extract was passed through gauze and centrifuged for 30 min (6000 r/min, at 4°C). In supernatant proteins were precipitated with cold absolute ethanol and centrifuged 30 min (10000 r/min, at 4°C). The residue dissolved with water and subjected to freeze-drying.
Calibration by the Bradford method
The quantity of soluble proteins was determined by Bradford method which is based on the reaction with Coomassie G 250. The advantage of the method is that, the reaction starts very rapidly, and it is possible to determine little amounts of proteins. The sensitivity beyond the reaction is 1-100 μg/ml. The 0.5-50 μg/ml concentration has been more accurate in many investigations carried out on different proteins. The calibration, made by this method is not always linear; however, it is used more than other protein quantity analysis methods. The more reliable counts were taken in 0.8-10 μg/ml concentrations [27,28].
1 ml of protein solution was taken to test-tube and 5 ml Coomassie solution was added. The gained solution thoroughly stirred in room temperature and immediately the color intensity was determined at 595 nm with UV-2550 (n=5, RSD ≤ 0.99936).
Chitinase assay
Chitinase activity was measured by a colorimetric assay. The reaction mixture 0.5 m/L (1 mg colloidal chitin, 0.3 μmol sodium azide, and 14 μmol sodium acetate buffer pH 4.5) containing enzyme, was incubated at 37°C for 2 h. After 0.1 mL 0.8 mol/L sodium borate buffer (pH 9.1) had been added, the mixture was centrifuged (2000 p.min for 5 min), and 0.4 mL of the supernatant was used for the colorimetric determination of GlcNAc. The resulting GlcNAc was determined according to Reissig et al. [29] in 544 nm. For that 0,4 ml reaction mixture was taken to a test tube and 0,08 ml of potassium tetra borate added. After the heating process has been ended 2,4 ml DMAB reagent was added and the tubes were placed to water bath at 36-38°C and after precisely 20 min. they cooled under running tap water and the optical density of the solution was read at 544 nm. Substrate blanks were included. The amount of protein producing 1 mmol of GlcNAc equivalents in 2 hours at infinite dilution was calculated as a unit of activity ((n=4, RSD ≤ 2.36).
Peroxidase assay
Peroxidase activity of the extracted protein peptide solution was measured by their reaction with hydrogen peroxide, using benzidine as the chromogenic substrate. 1.9 ml 0.1 M pH 4.7 acetate buffer (11.5 ml glacial CH3COOH + 27, 25 g CH3COONa and the volume was enhanced to 1000 ml) was taken to a chemistry laboratory test tube, and added 50 μl benzidine (40 μg benzidine solved in 25 ml 70% CH3CH2OH). The solution was stirred thoroughly then 100 μl protein solutions (containing enzyme) added. After the addition of 50 μl of hydrogen peroxidase as 30 sec. went by the optical density of the solution was measured in 620 nm (n=4, RSD ≤ 2.45).
The enzymes activity was calculated with the formula given below. A = E * 2 / a * b
Where E - is the optical density of the solution, 2 - is the total volume of the solution.
a - is the amount of protein (by Bradford) μg/ml, b - is the volume of protein (ml).
Terpenoid aldehydes
Freeze dried leaf samples were ground with liquid nitrogen using mortar and pestle. They were passed through seize and extracted with the system of solvents (isopropanol-acetonitrile-water-ethyl acetate (35:21:39:5) [22]. The extract was evaporated and was dissolved with 100 μl of ethanol three times. Aliquot was taken; the quantity of terpenoid aldehydes was determined by the reaction with fluoroglucinol. The quantity was calculated by the calibration made by the reaction gossypol : phloroglucinol (n=4, RSD ≤ 2,5).
Phloroglucinol was dissolved in absolute ethanol with the final concentration of 5% and the solution was mixed with concentrated HCl (1:1). The reagent was prepared just before the reaction. 700 μl earlier prepared gossypol was taken to chemistry lab. testtube (15 mm×10sm) and added 700 μl phloroglucinol-HCl (1:1). The gained solution of a pink colour thoroughly stirred and left in room temperature. After an hour 1400 μl of ethanol added, the mixture was thoroughly mixed. The adsorbance of the solution was defined in 3 ml quivette at 540 nm with UV-2550. The ethanol and phloroglucinol-HCl blanks were included (n=4, RSD ≤ 2.2, R2=0.9996).
The pyrethroid insecticides group is preferable among known insecticides having properties as less toxicity and selectivity in higher grades. Also phosphororganic compounds are still in practice, although they possess less selectivity and high toxicity. Chlororganic derivatives and carbamates – insecticides of the first generation concede to pyrethroids and phosphorganic compounds, in spite of some of them are still in wide practice. The reason that, they do not possess a wide practical use is that many of chlororganic insecticides are accumulative and carbamates are saved in soil for long time (they are destroyed for approximately two years).
Literatures give evidence about the resurgence and increase of some secondary pests such as aphid and mites, observed in fields treated with insecticides belonging to different classes, in most cases with pyrethroids. In Uzbekistan Atilla, Sumi-alfa, Phascord and Cypermethrin caused the outbreaks of aphids in 2006-2007 years, and carbamate insecticide Sevin having been efficiently used against cotton bollworm (Helicoverpa armigera Hb) led to an increase of mites [9]. Similar results were observed with pyrethroid Karate in US cotton fields [30]. There is no data about the side-effects of the used insecticides on aphids and mites in cotton fields, where the effects of applied insecticides studied. The work was carried to predict the probable effects of these composite insecticides on plant phytoimmunity and the quantity of sugars and soluble proteins that are expected to be food sources to some sucking and biting pests such as aphids and mites (Table 1).
| № | Trade name/dilution level | Components | Chemical formula | Percen-tage |
|---|---|---|---|---|
| 1. | Awei Dusipi (2000-1500) | Chlorpyrifos CAS 2921-88-2 Abamectin CAS 71751-41-2 |
C9H11Cl3NO3PS C47H70O13 |
14.8% 0.2 % |
| 2. | Chudao (1500-1000) | Isocarbophos CAS 24353-61-5 Phoxim CAS 14816-18-3 Lambda-cyhalothrin CAS 82657-04-3 |
C11H16NO4PS C12H15N2O3PS C23H19ClF3NO3 |
14.5% 14.5% 1% |
| 3 | Shiniao (1000-800) | Isoprocarb CAS 2631-40-5 Buprofezin CAS 69327-76-0 |
C11H15NO2 C16H23N3OS |
20% 5% |
| 4. | Zhongbao shaman (3000-2000) | Pyridaben CAS 96489-71-3 Abamectin CAS 71751-41-2 |
C19H25CIN2OS C47H70O13 |
7.8% 0.2% |
| 5 | Jianzhu (800) | Acetamiprid CAS 135410-20-7 Abamectin CAS 71751-41-2 |
C10H11ClN4 C47H70O13 |
3% 1% |
Table 1: List of composite insecticides sprayed on cotton leaves.
The increased level of aphids is often explained with the increased level of nutritious compounds. In our investigations the reducing sugars did not increase. All the composite insecticides caused the reducing sugars to lower (Table 2). Mixtures consisting of isocarbophos (14.5%) + phoxim (14.5%) + λ-cyhalothrin (1%) and isoprocarb (20%) + buprofezin (5%) decreased the quantity of reducing sugars most of all except on the 14 days of the treatment. However in all samples including control leaves, there were no linear changes in total sugars quantity (Table 3).
| Treatment | Control (Water) | Chlorpyroph. Abamectin | Isocarbophos Phoxim λ-cyhalothrin | Isoprocarb Buprophezin | Pyridaben Abamectin | Acetamipirid Abamectin |
|---|---|---|---|---|---|---|
| After 2 days | 29.93±1.11 | 23.74±1.16 | 24.38±1.11 | 26.72±1.39 | 22.36±1.10 | 26.55±1.12 |
| After 4 days | 36.51±1.31 | 35.33±1.18 | 34.86±1.51 | 38.21±1.54 | 31.53±1.31 | 27.83±1.38 |
| After 6 days | 38.29±1.46 | 37.24±1.41 | 32.04±1.42 | 30.97±1.38 | 26.09±0.52 | 34.89±1.08 |
| After 8 days | 30.61±1.28 | 32.24±1.23 | 31.27±1.48 | 27.79±1.09 | 25.42±1.21 | 29.47±1.29 |
| After 10 days | 24.40±1.37 | 26.86±1.16 | 29.21±1.38 | 31.24±1.22 | 27.71±1.33 | 31.28±1.21 |
| After 12 days | 24.84±1.29 | 31.48±1.27 | 31.53±1.12 | 28.56±1.27 | 28.52±1.22 | 30.28±1.32 |
| After 14 days | 27.57±1.36 | 23.56±1.47 | 29.86±1.31 | 27.58±1.12 | 29.82±1.39 | 23.72±1.49 |
Table 2: Change dynamics of total sugars in cotton leaves treated with composite insecticides (n=3, M ± m).
| Treatment | Control (Water) | Chlorpyroph. Abamectin | Isocarbophos Phoxim λ-cyhalothrin | Isoprocarb Buprophezin | Pyridaben Abamectin | Acetamipirid Abamectin |
|---|---|---|---|---|---|---|
| After 2 days | 2,163±0,123 | 3,190±0,123 | 3,042±0,138 | 2,220±0,137 | 2,571±0,143 | 2,950±0,053 |
| After 4 days | 2,479±0,053 | 1,898±0,053 | 2,113±0,132 | 2,137±0,141 | 1,632±0,142 | 2,085±0,122 |
| After 6 days | 3,160±0,151 | 1,528±0,151 | 1,954±0,054 | 1,591±0,134 | 1,101±0,134 | 1,132±0,121 |
| After 8 days | 5,198±0,027 | 3,876±0,027 | 1,798±0,118 | 1,432±0,119 | 1,584±0,122 | 3,006±0,127 |
| After 10 days | 5,416±0,12 | 5,488±0,120 | 2,934±0,113 | 1,987±0,123 | 5,040±0,140 | 5,284±0,144 |
| After 12 days | 6,933±0,131 | 6,511±0,131 | 4,230±0,130 | 3,483±0,119 | 7,029±0,128 | 7,067±0,130 |
| After 14 days | 4,858±0,105 | 4,320±0,105 | 6,239±0,123 | 6,399±0,151 | 7,752±0,129 | 5,580±0,147 |
Table 3: Change dynamics of reducing sugars in cotton leaves treated with composite insecticides (n=3, M ± m).
Soluble proteins increased by all of the applied insecticides (Figure 1). Only acetamipirid (3%) & abamectin (1%) mixture did not influence very much, that on the 2nd, 4th and 6th day of the treatment proteins were lower than the control. Between control and in samples treated with acetamipirid (3%) & abamectin (1%), slight differences were calculated on samples taken on the 8th and 10th days of the treatment. Chlorpyrophos (14.8%) and abamectin (0.2%) increased soluble proteins most of others that almost twice more quantity than the control was calculated on 10th-14th day of the treatment. The higher level of total essential amino acids, than the control was found in sulprophos treated cotton leaves [31] which presumably depend on proteases breaking down dietary proteins into simple peptides and amino acids thus can be absorbed into hemolymph [32]. Cotton aphid numbers increased after an application of cyhalothrin did not seem to be caused by a reduction in predator populations [33].
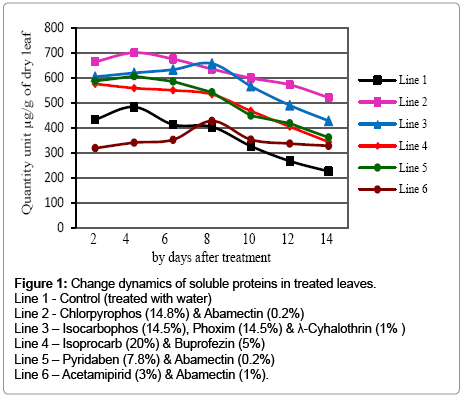
Figure 1: Change dynamics of soluble proteins in treated leaves.
Line 1 - Control (treated with water)
Line 2 - Chlorpyrophos (14.8%) & Abamectin (0.2%)
Line 3 – Isocarbophos (14.5%), Phoxim (14.5%) & λ-Cyhalothrin (1% )
Line 4 – Isoprocarb (20%) & Buprofezin (5%)
Line 5 – Pyridaben (7.8%) & Abamectin (0.2%)
Line 6 – Acetamipirid (3%) & Abamectin (1%).
Comparing with control lower chitinase activity was studied in cotton leaves treated with composite insecticides (Figure 2). Isoprocarb (20%) & buprofezin (5%) mixture slightly lowered the chitinase activity especially on the 6th, 8th and 12th days of the treatment. Other insecticides caused almost twice lower enzyme activity for two weeks after the spray. Chitinase activity gradually increased for the taken 14 days not only in control by also in treated samples. Peroxidase activity also decreased in insecticides applied samples (Figure 3). Only pyridaben (7.8%) & Abamectin (0.2%) caused the slight differences for the first week of the treatment. 35 and 25% higher peroxidase activity was determined on the 10th and 12th day after the spray with them. Other preparations decreased peroxidase activity. Pyridaben (7.8%) & Abamectin (0.2%) and Chlorpyrophos (14.8%) & Abamectin (0.2%) mixtures had rather stronger effects on peroxidase activity that 2-4 times lower activity was calculated.
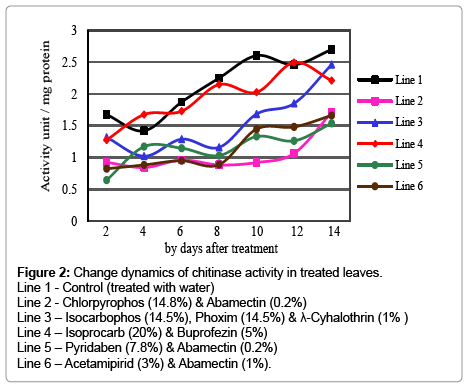
Figure 2: Change dynamics of chitinase activity in treated leaves.
Line 1 - Control (treated with water)
Line 2 - Chlorpyrophos (14.8%) & Abamectin (0.2%)
Line 3 – Isocarbophos (14.5%), Phoxim (14.5%) & λ-Cyhalothrin (1% )
Line 4 – Isoprocarb (20%) & Buprofezin (5%)
Line 5 – Pyridaben (7.8%) & Abamectin (0.2%)
Line 6 – Acetamipirid (3%) & Abamectin (1%).
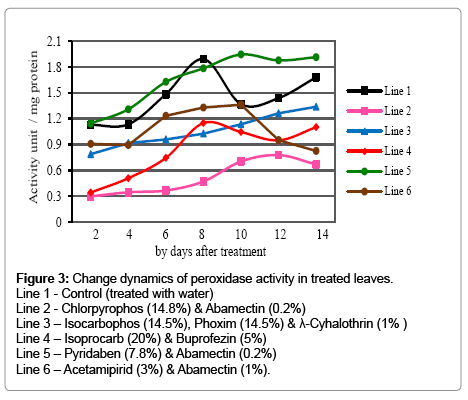
Figure 3: Change dynamics of peroxidase activity in treated leaves.
Line 1 - Control (treated with water)
Line 2 - Chlorpyrophos (14.8%) & Abamectin (0.2%)
Line 3 – Isocarbophos (14.5%), Phoxim (14.5%) & λ-Cyhalothrin (1% )
Line 4 – Isoprocarb (20%) & Buprofezin (5%)
Line 5 – Pyridaben (7.8%) & Abamectin (0.2%)
Line 6 – Acetamipirid (3%) & Abamectin (1%).
Unlike the lowered level of peroxidase and chitinase, terpenoid aldehydes increased in all of the samples treated with insecticides (Figure 4). For the first six days of the treatment the quantity of terpenoid aldehydes were 2.5-4 times higher than the untreated control in which swift increases were then observed, that 3-4 times higher quantity were determined on the 10th and 12th days of experiment. Rapid increases were also studied in samples treated with chlorpyrophos (14.8%) & abamectin (0.2%); isocarbophos (14.5%), phoxim (14.5%) & λ-cyhalothrin (1%); and iso-procarb (20%) & buprofezin (5%) mixtures that still 30 to 60% higher, than the control, quantity of terpenoid aldehydes was revealed. The increased level of phenolic compounds, one of the main indicators of cotton plant resistance against insect-pests [22] gives evidence that the infestation of treated plants by insects is expected to less than the untreated control.
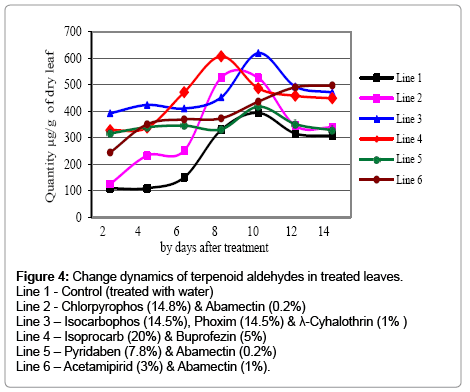
Figure 4: Change dynamics of terpenoid aldehydes in treated leaves.
Line 1 - Control (treated with water)
Line 2 - Chlorpyrophos (14.8%) & Abamectin (0.2%)
Line 3 – Isocarbophos (14.5%), Phoxim (14.5%) & λ-Cyhalothrin (1% )
Line 4 – Isoprocarb (20%) & Buprofezin (5%)
Line 5 – Pyridaben (7.8%) & Abamectin (0.2%)
Line 6 – Acetamipirid (3%) & Abamectin (1%).
The higher concentration of defensive terpenoid aldehydes resulting in the spray can be estimated as positive results that the application of used insecticides increased the quantity of compounds having antifeedant property. Not increased levels of reducing sugars in treated samples may also prevent the outbreaks of aphids in fields treated with these composite mixtures. However lowered activity of chitinase and peroxidase, defensive PR proteins against not only insects but also microbes, may cause infection by fungi and bacteria.
The work was conducted according to Scientific Agreement made between Xinjiang Technical Institute of Physics and Chemistry (Chinese Academy of Sciences) and AS Sadykov Institute of Bioorganic chemistry (Academy of Sciences of Uzbekistan). Authors are thankful to Rahima Abdulla for being helpful with field experiments. We also thank Dr. Zoidjon Tilyabaev for the help with chitinase activity.