Journal of Pollution Effects & Control
Open Access
ISSN: 2375-4397
ISSN: 2375-4397
Research Article - (2016) Volume 4, Issue 3
Background: In China, Dayu County is famous for tungsten, lead–zinc mines that are abundant in Hezhang County. Cadmium (Cd) is a concomitant pollutant with tungsten and lead–zinc mining. The most severe Cd pollution occurred from the 1970s until 2006. Large-scale mining stopped after 2006 in the two counties; however, the longterm mining led to soil Cd pollution in these areas.
Aim: The study aimed to investigate Cd concentration in crops and dietary exposure among the general population in two Cd-polluted regions. Methods: Local self-seeded grain and vegetable samples were collected and analyzed for Cd content with atomic absorption spectrometry. A three-day dietary interview was carried out among local residents to estimate diet Cd intake.
Results: In total, 957 and 281 crop samples were collected. Three-day diet surveys were conducted among 546 residents and 262 residents, respectively from Hezhang and Dayu Counties. Higher Cd content of rice (0.536 mg/kg) and a ratio of rice to Cd content (71.69%) over the standard limit were found in Dayu, whereas a higher Cd content was found in leafy vegetables (0.386 mg/kg) and ratio of leafy vegetables to Cd content (51.40%) over the standard limit in Hezhang. Rice is the main food consumed and it is a major source of dietary Cd intake for local residents in Dayu; however, maize is the main food consumed and leafy vegetables are the major source of dietary Cd intake for local residents in Hezhang. For the two counties, both average daily Cd intake and cumulative Cd intake of residents in the polluted areas exceeded the limitation of Cd from food, and the consumption is higher in Dayu.
Conclusion: Cd exposure through food is very high among the general population in the two regions. Different measures should be taken in different regions. Also, close attention should be paid to the health of the local residents.
Keywords: Cadmium pollution; Dietary intake; Cadmium intake; Food chain
Cadmium (Cd) does not break down in the environment; it can only transfer between its various forms. It can accumulate in soils. Excess Cd in soil can be taken up by plants or crops, and it accumulates in human body via the food chain. Further, because it has a long biological halflife ranging from 10 to 30 years in the human body, it can be highly dangerous to human health [1-3]. The issue of Cd in food has been a worldwide concern since “Itai-itai” disease occurred in Japan in the 1950s. In addition, the Joint FAO/WHO Expert Committee on Food Additives has confirmed that Cd is one of the major food contaminants, and they have formulated maximum levels for Cd to assure food safety [3]. Cd levels in plants are affected by soil properties and crop type; soil pH is the major factor influencing plant uptake of Cd from soils; soil type also affects uptake of Cd by plants. The Cd content of agricultural crops varies according to species and plants grown in the same soil. Accumulation of Cd decreases in the following order: leafy vegetables > root vegetables > grain crops [3-5].
Tungsten resources are abundant in Dayu County, Jiangxi Province, China, and Cd is a contaminant with tungsten ore mining. Industrialized tungsten mining since the 1960s has released wastewater with Cd from the ore dressing directly into the river. Irrigation with Cd-polluted river water has resulted in Cd pollution in soils. Dayu is a rice-growing area, where rice fields account for more than 95% of the total cultivated land area [6]. Lead–zinc mines that are abundant in Hezhang County, Guizhou Province, China, and Cd is concomitant with lead–zinc mining. Mineral waste from artisanal zinc smelting was piled in the farmland, and thus the soil was polluted with Cd [7]. The soil of Hezhang is suited for dryland agriculture, and the main crop is maize. Maize production accounts for about 55% of the county’s total grain, and rice cultivation is rare. The two counties share some commonalities. Both have had a similar mining history for almost a hundred years, and for both, the most severe pollution occurred from the 1970s until 2006. Large-scale mining stopped after 2006 in the two counties, but the long-term mining exploitation led to significantly higher Cd content in regions’ soil [7]. Because of the different means of pollution, soil properties, and crop species, the Cd enrichment of crops will differ between the two counties. To compare the characteristics of Cd accumulation in crops and assess residents’ exposure risks between the two different Cd-contaminated environments, two field surveys were carried out separately on Cd concentration of crops and diet exposure. The survey in Dayu was done in April 2007. The survey in Hezhang was done in April 2009. The Cd intake through ingestion was evaluated among the general population in the two polluted regions, and the results provide data for the assessment of human health hazards of Cd pollution for different environments.
Study population
There are 11 townships in Dayu County. According to the natural environmental conditions and lifestyle, townships irrigated by waste water that had rice Cd concentration ≥ 0.2 mg/kg were selected as the Cd-exposed area, whereas areas not irrigated by waste water and with a rice Cd concentration < 0.2 mg/kg were regarded as the control area. There are 27 townships in Hezhang County, and based on monitoring data from soil, the soil Cd content is in a range from 1.09 to 6.71 mg/ kg in the county. The townships with highest Cd content in the soil were selected as the Cd-exposed area. The townships with the lowest Cd content in the soil were selected as the control area. We selected one exposure and one Control Township from each of the two counties, Dayu and Hezhang.
Cluster random sampling was used to choose subjects from the selected townships, and age range spanned from childhood to old age to represent different physiological stages, except for the youngest age group, which is sorted by the interval of 5 years; the interval between the other age groups is 10 years. Males and females were evenly distributed in each age group.
Dietary data collection
A dietary recall survey was conducted only in contaminated areas. A three-day inquiry method and a food frequency questionnaire were used in the survey. In total 262 and 515 residents were followed for three days in Dayu and Hezhang, respectively, and food consumption data were collected.
Sample collection and test
Locally produced foods grown in the fields surrounding the village were collected. Samples were collected from the subjects’ households and stored in sealed polyethylene bags (colorless and transparent), and then sent to the lab quickly to detect Cd content. Foodstuff was sorted into two main categories: cereals and vegetables. Rice, wheat, and maize are the main cereals in China. Vegetables are divided into three subgroups: stem and root vegetables, leafy vegetables, and fruit vegetables, based on the China National Nutrition and Health Survey Workbook [8]. In total, 117 samples from one village in the exposure area and 94 samples from three villages in the control area were collected in Dayu County, whereas 735 samples from ten villages in the exposure area and 86 samples from three villages in the control area were collected in Hezhang County. Sampling site is showed in Figure 1. The Cd content in food was determined by atomic absorption spectrometry (AAS), and the results of Cd content in food were evaluated according to Chinese National Standards [9,10].
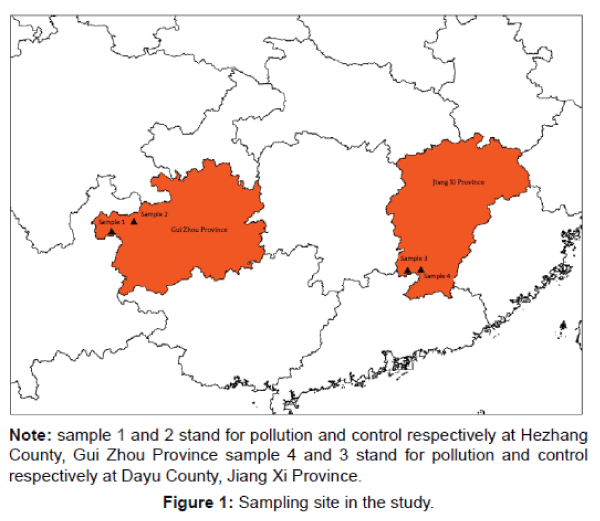
Note: sample 1 and 2 stand for pollution and control respectively at Hezhang County, Gui Zhou Province sample 4 and 3 stand for pollution and control respectively at Dayu County, Jiang Xi Province.
Figure 1: Sampling site in the study.
Quality control
Standard substances were used throughout the detection procedure for quality control. The Cd standard for rice (rice flour, GBW (E) 080684) and vegetables (tomato leaf, ESP-1) was obtained from the Center of National Standard Research of China. Relative error of Cd content in a standard substance between true value and measured value was in the range of 0.5–5.6%. The detection limit of AAS was 0.1 μg/l. No subject had responses below the detection limit.
Statistic method
Statistical analyses were performed using SPSS 15.0. Measurement data were described using means and standard deviation and were analyzed using the t-test to compare the means. Categorical data were described as the proportion and analyzed with the chi-square test. For all analyses, a P value < 0.05 was regarded as statistically significant.
Cadmium content in food
Results of Cd content in food are displayed in Table 1. All vegetable results are given in fresh weight except for rice and maize, which are in dried weight. According to FAO/WHO, maximum levels (MLs) for rice, leafy vegetables, stem and root vegetables, and fruit vegetables are 0.4 mg/kg, 0.2 mg/kg, 0.1 mg/kg, and 0.05 mg/kg, respectively (FAO/ WHO, 2014). Chinese National Standards on foods contaminants (GB2762-2005) are similar with the MLs except for rice (0.2 mg/ kg), so we used the Chinese National Standards to assess the result of Cd content in food. The mean of Cd content in food is over the MLs of the national standard in the Dayu exposure area. Further, Cd content decreased in the following order: rice > root vegetables > leafy vegetables > fruit vegetables, whereas there are a few samples of fruit vegetables in which the Cd content is over the MLs in the Dayu control area, and there is significant difference for both mean and exceeding ratio comparison between exposure and control in the Dayu region. As far as the Hezhang exposure area is concerned, food Cd contents are also over the MLs; however, the decreasing order is different from Dayu: leafy vegetables > root vegetables > maize > fruit vegetables, whereas Cd content in fruit vegetables is a little higher in the Hezhang control area, and the means and exceeding ratios are significantly different between exposure and control.
| Region | Type | Exposure area | Control area | ||||
|---|---|---|---|---|---|---|---|
| N | mean ± SD | Exceeding ratio (%) | N | mean ± SD | Exceeding ratio (%) | ||
| Dayu | rice | 53 | 0.536 ± 0.507* | 71.69a | 44 | 0.072 ± 0.040* | 0a |
| Stem and root vegetable | 30 | 0.127 ± 0.171* | 36.67a | 16 | 0.011 ± 0.011* | 0a | |
| leafy vegetable | 24 | 0.119 ± 0.176* | 20.83a | 24 | 0.021 ± 0.023* | 0a | |
| fruit vegetable | 10 | 0.027 ± 0.016* | 10 | 10 | 0.012 ± 0.015* | 10 | |
| Hezhang | maize | 158 | 0.137 ± 0.133* | 55.06a | 21 | 0.025 ± 0.023* | 0a |
| Stem and root vegetable | 249 | 0.211 ± 0.184* | 82.33a | 20 | 0.039 ± 0.027* | 0a | |
| leafy vegetable | 286 | 0.386 ± 0.698* | 51.40a | 10 | 0.050 ± 0.025* | 0a | |
| fruit vegetable | 42 | 0.130 ± 0.083 | 59.52 | 35 | 0.111 ± 0.084 | 45.71 | |
N: number of samples collected
*: mean comparison between exposure and control group within same region P<0.05.
a: Ratio comparison between exposure and control group within same region P<0.05.
Table 1: Cadmium content of locally produced food in the two regions.
General information on study subjects
The basic characteristics of study subjects are listed in Table 2. Age of subjects ranged from 2 to 75 years old, and gender was evenly distributed among age groups. We tested by ANOVA and chi square test and found no significant difference in mean age and age ratio between males and females within the same region (Dayu is F=0.172 and X2=5.192; Hezhang is F=0.568 and X2=5.186). We also compared the age ratio between Dayu and Hezhang, and the results show a difference in age structure between Dayu and Hezhang (male, X2=16.333, P=0.022, F=3.730, P=0.054; female, X2=31.526, P=0.000, F=4.814, P=0.029). As shown in Table 2, the 15-year-old group had a larger proportion in the Dayu region, which is the reason for the difference in age structure between Dayu and Hezhang. When we compared age structure between Dayu and Hezhang without the 15-year-old group, the result for males was X2=1.512, P=0.959, F=0.469, P=0.494, and X2=3.055, P=0.802, F=0.154, P=0.695 for females, so the difference existed only in the 15-year-old group. Overall, there was no difference in age distribution either between males and females or between Dayu and Hezhang, except in the 15-year-old age group.
| Dayu region | Hezhang region | |||||||
|---|---|---|---|---|---|---|---|---|
| Age group | Male | Female | Male | Female | ||||
| N | % | N | % | N | % | N | % | |
| 2~ | 11 | 8.4 | 5 | 3.8 | 20 | 8 | 14 | 5.3 |
| 6~ | 22 | 16.8 | 19 | 14.5 | 45 | 18.1 | 50 | 18.8 |
| 15~ | 43 | 32.8 | 44 | 33.6 | 39 | 15.7 | 30 | 11.3 |
| 25~ | 9 | 6.9 | 17 | 13 | 22 | 8.8 | 31 | 11.7 |
| 35~ | 14 | 10.7 | 12 | 9.2 | 39 | 15.7 | 44 | 16.5 |
| 45~ | 10 | 7.6 | 11 | 8.4 | 28 | 11.2 | 37 | 13.9 |
| 55~ | 12 | 9.2 | 12 | 9.2 | 28 | 11.2 | 31 | 11.7 |
| 65~ | 10 | 7.6 | 11 | 8.4 | 28 | 11.2 | 29 | 10.9 |
| Total | 131 | 100.0 | 131 | 100.0 | 249 | 100.0 | 266 | 100.0 |
N: number of subjects.
Table 2: Age and gender distribution of the study population.
Dietary consumption of the study population
Average total daily dietary consumption between genders differs among age groups. Total daily dietary consumption differs significantly for overall comparison of all ages in Dayu, however, no significant difference was found in Hezhang. t-tests show no statistically significant difference between males and females within any age group, except in the 6-year-old age group and 15-year-old age group in Dayu. Overall, the main feature of average total daily dietary consumption is the difference among different age groups, and there is little difference based on gender.
Figure 2 displays average total daily dietary consumption in a graph. The 2-year-old age group had the lowest consumption amount, and there was an upward trend with increasing age, with consumption amount reaching the highest levels in the 25- and 35-year-old age groups. Further, the 45-year-old age group showed a slow downward trend. The amount of average total daily dietary consumption was higher for males than that for females, with each age group in each region, whereas it was lower among people in Dayu compared with those in Hezhang. The average total daily dietary consumption rates are 450.1 g, 340.6 g, 677.6 g, and 598.5 g for Dayu males, Dayu females, Hezhang males, and Hezhang females, respectively.
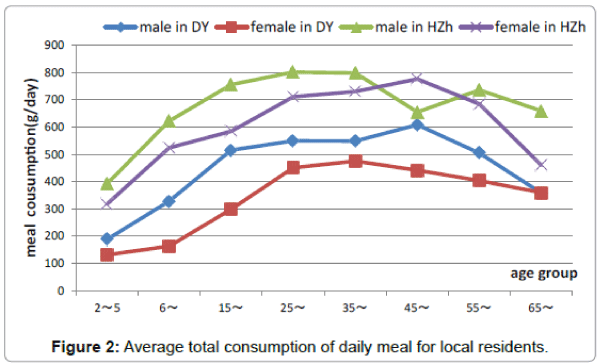
Figure 2: Average total consumption of daily meal for local residents.
Results of dietary cadmium intake
The approach used for estimating the daily intake of Cd is based on consumption and Cd concentration of each type of food. First, the Cd concentrations were multiplied by the amount of intake of each foodstuff to give the Cd intake for each food item that is one day’s data for an individual resident. We then used these data to calculate the average Cd intakes of the individual for each food item during the interviewing date. Finally, the average daily Cd intake of each foodstuff in each age group was attained from the average Cd intakes of the individual. The average daily Cd intake multiplied by the survivor days of each age group equals the cumulative Cd intake of each age group. The cumulative Cd intake of a population is the summary of all age groups. The average life expectancy is estimated as 75 years in China. For individuals, mean Cd content of each food type from the same village was used to calculate the Cd intake of each person. Crop Cd is a major source of exposure for most persons living under environmental Cd pollution, and because there are almost no data showing that Cd content of meat is over the standard in these region, meat Cd content is not taken into account in this study.
As seen in Table 3, the 2-year-old age group had the lowest daily Cd intake. Cd intake in the 15-year-old age group in Dayu was somewhat lower than expected. Moreover, excluding the 2- and 15-year-old groups, the average daily Cd intake was above 70 μg/day in all age groups. Average daily dietary Cd intakes of males and females differ from each other at all ages in each region. ANOVA results show that average daily Cd intake is significantly different for overall comparison of all ages in Dayu (F=6.453, P=0.000 for males and F=8.705, P=0.000 for females); however, the differences are not significant for overall comparison of all ages of males and slight for females in Hezhang (F=1.143, P=0.337 for males and F=2.381, P=0.022 for females).
| Dayu | Hezhang | |||||||
|---|---|---|---|---|---|---|---|---|
| Age group | Male | Female | Male | Female | ||||
| A(μg) | C(mg) | A(μg) | C(mg) | A(μg) | C(mg) | A(μg) | C(mg) | |
| 2~ | 78.59 | 118.14 | 39.6 | 79.34 | 50.46 | 73.67 | 29.87 | 43.61 |
| 6~ | 163.41 | 594.17 | 134.13 | 519.96 | 87.05 | 359.63 | 72.01 | 280.16 |
| 15~ | 52.17 | 784.59 | 35.23 | 648.53 | 94.82 | 705.72 | 82.62 | 581.73 |
| 25~ | 76.67 | 1064.44 | 113.65 | 1063.34 | 114.19 | 1122.52 | 91.98 | 917.45 |
| 35~ | 178 | 1714.15 | 195.79 | 1777.99 | 108.08 | 1517.01 | 97.89 | 1274.75 |
| 45~ | 286.73 | 2760.73 | 214.41 | 2560.6 | 91.91 | 1852.48 | 112.09 | 1683.88 |
| 55~ | 196.61 | 3478.36 | 215.25 | 3346.25 | 106.27 | 2240.37 | 97.06 | 2038.15 |
| 65~ | 139.41 | 3987.21 | 182.06 | 4010.79 | 103.31 | 2617.45 | 70.64 | 2295.99 |
Table 3: Average daily Cd intake and cumulative Cd intake from food among residents in the two regions.
To determine if there were gender differences for average daily dietary Cd, the ANOVA test was used to compare average daily dietary Cd between males and females in each region. Results showed no differences between males and females in either Dayu (F=0.212, P=0.646) or Hezhang (F=0.272, P=0.602). Then we use the t-test to compare average daily dietary Cd between males and females in each age group; there were no statistic differences between males and females within any age group. Overall, the main feature of average daily dietary Cd is the difference among different age groups, and there is little difference for gender.
Figure 3 displays the trend of average daily dietary Cd in different age groups; the features of trend variation are consistent for males and females in Dayu, except for those aged 6 years who had a slightly higher level. We found an upward trend with increasing age, until age 55, when a slow downward trend was shown. The trend variation for average daily dietary Cd in males coincide closely with that in females in Hezhang, and it shows a very slow upward trend with increasing age. Further, the variation between the age groups is small, and it shows a slow downward trend after age 55.
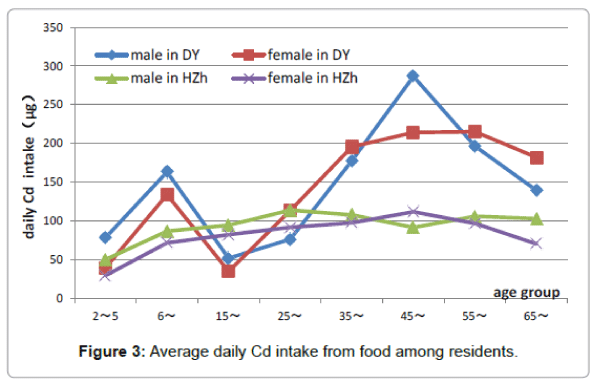
Figure 3: Average daily Cd intake from food among residents.
Figure 4 displays the trend of cumulative dietary Cd in different age groups. The trend variation is consistent for males and females in both regions, an upward trend with increasing age. Before age 25, the lines of cumulative dietary Cd for Dayu and Hezhang were very close with each other, and after age 25, it shows a steep upward trend in Dayu, whereas it shows a steady upward trend in Hezhang. The line of cumulative dietary Cd for males is almost above that for females, but it is reversed in the 65-year-old group in Dayu. Cumulative lifelong Cd is estimated to be 3617.77 mg and 4010.79 mg for males and females, respectively, in Dayu, and 2617.45 mg and 2295.99 mg for males and females, respectively, in Hezhang.
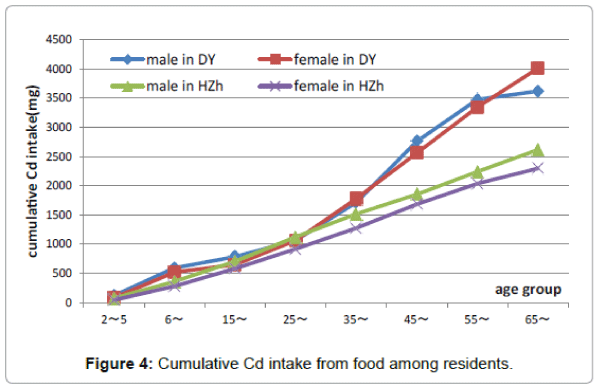
Figure 4: Cumulative Cd intake from food among residents.
To find the main factors affecting dietary Cd intake among the populations, the proportions of dietary consumption, as well as the proportion of the dietary Cd intake for each type of foodstuff, were calculated in each age group. Average specific dietary consumption (for specific foods, such as rice or maize) was divided by average total daily dietary consumption equal to the specific dietary proportion in total dietary, and average specific dietary Cd intake (such as rice or maize) was divided by average total daily dietary Cd intake equal to the specific dietary Cd intake proportion in total dietary Cd intake. The overall proportion of dietary consumption, as well as the proportion of the dietary Cd intake for males or females was averaged according to proportion in each age group. Results are shown in Figures 5A and 5B. As seen in the figure, rice has a large proportion of dietary consumption: the proportion is 80% and 83% for males and females, respectively, whereas in Dayu, the contribution of rice Cd to total dietary Cd intake was 96% and 97% for males and females. The proportion of rice Cd intake to dietary Cd intake is higher than the proportion of rice consumption to dietary consumption, which means that rice consumption has made a key contribution to Cd intake, and the high Cd content in rice further promotes the increase of this proportion. Maize is the largest proportion of dietary consumption: the proportion is 26% and 23% for males and females, respectively, in Hezhang, whereas contribution of maize Cd to total dietary Cd intake is 18% and 16%, for males and females, respectively. The proportion of maize Cd intake to dietary Cd intake is lower than the proportion of maize consumption to dietary consumption, which means that maize consumption has played a key role for dietary consumption contribution but not for the contribution to Cd intake because the low Cd content in maize decreases the proportion. For this reason, leafy vegetables are listed here, but it is obvious that leafy vegetables are not the main dietary consumption; the proportion is 17% and 16% for males and females, respectively, in Hezhang, whereas contribution of leafy vegetable Cd to total dietary Cd intake was 51% and 50% for males and females, respectively. The proportion of leafy vegetable Cd intake to dietary Cd intake is higher than the proportion of leafy vegetable consumption to dietary consumption, which means that although leafy vegetable consumption has not played a key role as a dietary contribution, the high Cd content in leafy vegetables increases its contribution to Cd intake. Overall, the main food for the contribution to Cd intake is rice in Dayu and it is leafy vegetables in Hezhang.
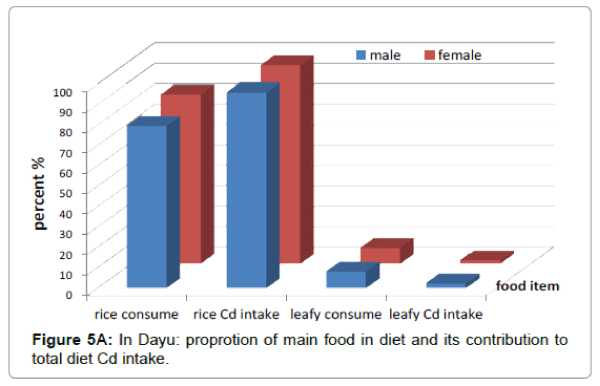
Figure 5A: In Dayu: proprotion of main food in diet and its contribution to total diet Cd intake.
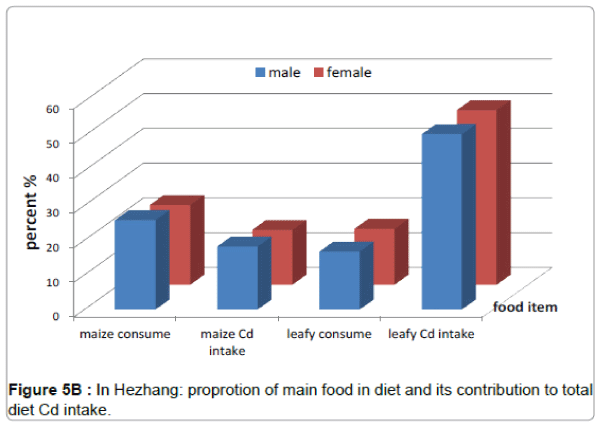
Figure 5B : In Hezhang: proprotion of main food in diet and its contribution to total diet Cd intake.
Cd exposure estimation is important in accessing the effect of exposure on human health for the population exposed; it has important implications for the prediction of human health hazards and in the prevention of environmental Cd pollution. Food is the most common routes of non-occupational exposure to Cd [11-13]. Our study found cereal and vegetables to have relatively high Cd content. The Cd contents of rice and root vegetables are outstanding in Dayu, while leafy and root vegetables contain relatively high Cd content in Hezhang; The variation feature of average daily dietary Cd intake with age group is similar to that of average total daily dietary consumption, which means that average daily dietary Cd intake and average total daily dietary consumption are correlated with each other closely, more dietary consumption results in more Cd intake. However, the variation of average daily dietary Cd intake with age group in Dayu differs from that in Hezhang. The variation of Cd intake is notable with increasing age in Dayu, but it shows a slowly increasing trend with increasing age in Hezhang. Dietary Cd intakes of residents in different regions of China are quite different; it ranges from 12.0 to 70 μg/day in a nopollution area, and it is still higher than that in developed countries (10-30 μg/day) [14]. Our study shows that residents in polluted regions take in much more Cd via food in comparison with those living in nonpolluted regions in China, and his intake is much higher than that found in European countries. However, our study is similar with the result from a study in a contaminated region of Thailand, where estimated dietary Cd exposures of 188-224 μg/day for males and 99-113 μg/day for females 20-59 years of age who never smoked were reported [15]. A survey in the Jinzu River Basin, in Japan, demonstrated that dietary Cd exposures of most people are 100–200 μg/day [16]. These studies show that higher Cd polluted areas are found mostly in Asia, and that the exposure situations are similar to each other.
13.4%, respectively; In contrast, vegetables contributed 34.4% of the total Cd for the south [14]. Our study agrees with previous studies in China, because Cd polluted regions usually are far from urban areas, so there are further remarkable regional characteristics for dietary Cd intake. Rice intake accounts for 80% and 83% of total dietary consumption, respectively, for males and females, in Dayu, but it is the absolute majority contribution to dietary Cd intake, and it accounted for 96% and 97% among males and females in Dayu. Actually, the fooditem contribution to dietary Cd intake we found is very similar to that in the Kakehashi River Basin, which showed that Cd levels in rice were representative of Cd intake, because over 70% of the total Cd intake came from rice (ATSDR) [19]. Although vegetables only make up 17% and 16% of the total dietary consumption for males and females in Hezhang, leafy vegetables are the major contribution to dietary Cd intake, accounting for 51% and 50% among males and females. Therefore, we can draw the conclusion that two major factors affect dietary Cd intake: one is food consumption, and the other is the Cd content in food. Food consumed in larger quantities made the greatest contribution to the dietary exposure. High or low Cd content may change the contribution to the dietary Cd exposure for different Cd-polluted regions, but it is necessary to identify major dietary patterns and consumption, to detect the Cd content that people consume. A combination of dietary consumption and Cd content assessment can lead to comprehensive evaluation of dietary Cd exposure in the general population.
Three approaches are used for estimating the daily intake of Cd in food [1]. Among them is the total-diet collection method, in which the total Cd intake is calculated as the product of the concentration and the estimated amount of food eaten, which is similar to the method used in our study. Estimation of daily Cd intake only reflects the degree of contamination and exposure to Cd at the point of investigation; it is cross-sectional and statically, it reflects little correlation between Cd intake and a gradual process of harm to the body; therefore, cumulative Cd intake was used to reflect the relationship between total Cd intake and injury. Some studies use mean daily intake levels in all people and multiply these with the people’s ages to assess the total cumulative lifetime Cd intake [16]; this method does not consider the different of diet consumption at different ages. Therefore, the estimated amount may be greater than the actual intake. Based on previously used methods, we calculate the cumulative Cd intake by multiplying average daily Cd intake and days of length of life at each age group, then the cumulative Cd intake of all age groups were summed up to get the total lifetime Cd intake. This method is better than the conventional method because the influence of age on diet consumption is taken into account. It was found that a non-smoking individual’s intake would at least be 4 grams of Cd in Dayu and 2 grams of Cd in Hezhang after lifetime exposure with the current pollution and lifestyle. A health-based guidance value for Cd of 7 μg/kg body weight (b.w.) per week (Provisional Tolerable Weekly Intake (PTWI)) was established previously by the Joint FAO/ WHO. This PTWI value corresponds to a daily tolerable intake level of 70 μg of Cd for the average 70-kg man and 60 μg of Cd per day for the average 60-kg woman. Further, an association between Cd exposure and increased urinary excretion of low molecular weight proteins has been noted in humans with a cumulative intake of about 2000 mg or more (for both men and women) [1]. While in regions we studied, no matter the levels of average daily intake of Cd or cumulative Cd intake has exceeded the threshold for health recommended by WHO. Therefore, measurement should be taken to prevent the harmful effects of Cd on human health through the food chain. Because of the different environmental Cd pollution sources and their different characteristics, the manner and extent of its influence on population health are not the same. Therefore, regions should adopt individual measures based on their own characteristics. Thus, more precautions should be noted in local seeded rice in Dayu. However, both regions should focus attention on leafy and root vegetables. Estimation of Cd exposure is very high in the two regions, and close attention should be paid to the health of the local residents.
The authors declare that there are no conflicts of interest.
We give special thanks to both Guizhou Province Center for Disease Control and Prevention and Jiangxi Province Center for Disease Control and Prevention for their great organization, management, and cooperation for the study. The authors also thank the administration and staff of the Center for Disease Control and Prevention of Dayu and Hezhang Counties, for their effective and efficient teamwork and continuous support in collecting information.