Forest Research: Open Access
Open Access
ISSN: 2168-9776
ISSN: 2168-9776
Research - (2020)Volume 9, Issue 2
Qualitative and quantitative data on floristic composition and species diversity of the woody plants on Jabal Eldair - Northern Kordofan State were collected from twenty three circular plots 0.1ha., between elevation ranged from 510 to 1200 m above sea level (asl), which later were divided into three vegetation communities (community I, community II and community III). According to the dominant plant species, to determine how woody plants species change with increasing altitude. A total number of 1147 plants from 47 species belonging to 22 families were sampled. Number of ecological parameters has been studied for each plant species and vegetation community. These parameters include number of individuals, also the frequency percentage, abundance, density, relative density and importance value index (IVI), in addition to numbers of ecological indices. Community III was found to be more diverse compared to Communities II and I, using Shannon diversity index (H). It also has the highest species richness and density than the other two Communities.
Species diversity; Phytosociological parameters; Woody vegetation
Topography is one variable that has shown to affect vegetation distribution [1-3]. Although topography is variable, composed of a number of factors, for descriptive and management purposes it is acceptable to analyze topography as a single factor affecting the structure and composition of a forest [4]. Biodiversity is the variability of plant, animal and microorganism in an ecosystem. Biological diversity has become one popular topic recently for discussion both in scientific and political forum at local, national regional and global level [5].
Phytosociology is dealing with the plant communities, their composition and development as well as the relationships between species within them. Phytosociology is useful to describe the population dynamics of each plant species occurring in a particular community as well as to understand how they relate to the other species of the same community [6].
Jabbal El-Dair is located in North Kordofan State. The area belongs to the low-rainfall woodland savanna [7]. This area was selected for this study for different reasons including: (a) Though the area of Jabbal El-Dair exhibits high diversity in woody vegetation, there is no detailed study regarding the composition and diversity of woody vegetation, (b) This study can help in producing a regional Flora which might be useful and more easier to be used by local staff, forestry students as well as scientists, (c) In the seventies and eighties of last century, this area likewise other areas in the country witnessed successive era of drought and this might affect the diversity and composition of plants in the Jebel, this inadition to the wrong practices of man and his animals.
This study aimed at assessing the impact of elevation on species diversity, and phytosociological parameters and to understand distribution pattern of species and similarity between communities.
Study area
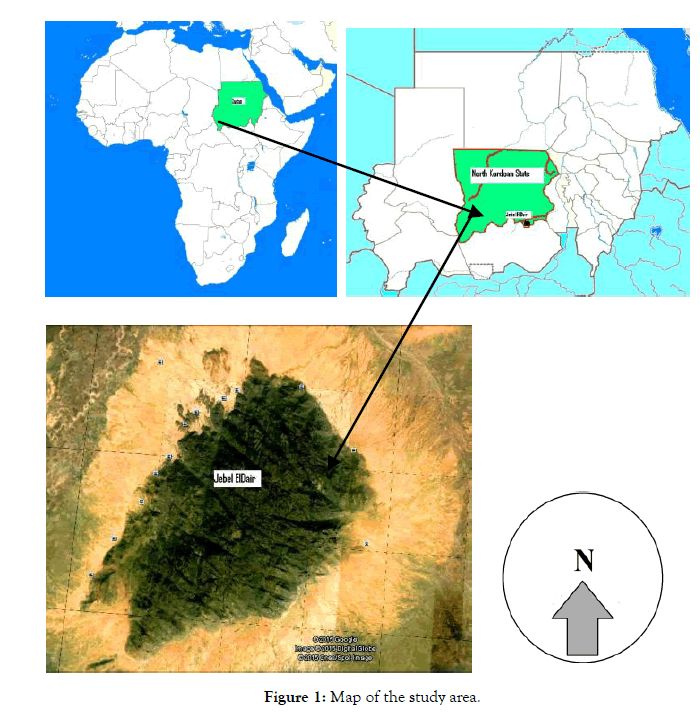
The study was conducted in Jebel El-Dair natural reserve Park, Northern Kordofan State of Sudan which is considered one of the important mountainous parks in Sudan. It was established in 2010 for the conservation of flora and fauna of the area. It covers an area of 314.45 km2 which lies between 12° 21`- 12° 32`N and 30° 35`-30° 35`E (Figure 1).

Figure 1: Map of the study area.
According to Das et al. and Ewusie [8,9], Jabal El-Dair belongs to low rainfall woodland savanna on clay, Acacia mellifera thorn land, where species composition dominated by A. mellifera stretches across belt between Kassala and Gadarif westwards to Abu Habil clay basins and northern piedmonts of Nuba Mountains. The rain fail varies from 300-400 mm/year. The under shrubs C. glandulosa and C. rotundifolia are common, B. senegalensis, B. aegyptiaca and D. cinerea are less common. Jabal El-Dair has separate vegetation types, and because of altitude, differ from the vegetation of the low plain around it.
Sampling methodology
A total of 23 sample plots were taken within six base line representing different sides of the study area. In each base line a systematic sampling was carried out, following elevation gradient, divided the study area into three communities (community (I) ranging from 510-599 m, community (II) from 600 – 780 m and community (III) from 780-1200 m. above sea level (asl.)). A minimum elevation of 200 separated plots. Sample plots were circular 0.1 ha. The radiuses of these plots were 17.84 m.
The collected plant specimens were identified to the species level by matching them with collections in the Forestry Research Centre Herbarium at Soba. The arrangement of families followed Angiosperm Phylogeny Group (LAPG) III system [10].
In order to assess the dominance of species in the vegetation communities, density, frequency and abundance were converted to relative values and summed to obtain importance value index (IVI) [11,12]. The species distribution profile was measured using Bio- Diversity Pro. software [13]. Species richness was determined as the total number of species present in the studied site, species diversity was measured using Shannon diversity index (H) [14]. Pielou index was used for estimation of species evenness (J) [15]. Margalef index used for estimation of Species richness (D) [16].
Jaccard index was used to determine the degree of similarity in species composition between the different sites [17]. The similarity dendrograms obtained from the results of cluster analysis were plotted. Data were analyzed using the program BioDiversity Pro (Version 2) [13].
Floristic composition
A total of 47 species 22 families of total species were recorded inside studied plots. The family Fabaceae was the largest one which represented by 15 species, followed by Malvaceae represented by 6 species and Combretaceae represented by 4 species and most of the other families were consisted of one species (Table 1).
| Family | Tree species | Vernacular name | Community 1 | Community 2 | Community 3 | Distribution | |||||||||
|---|---|---|---|---|---|---|---|---|---|---|---|---|---|---|---|
| RF | RA | RD | IVI | RF | RA | RD | IVI | RF | RA | RD | IVI | ||||
| Arecaceae | Hyphaene thebaica (Linn.) Mart. | Dom | 2.50 | 1.03 | 0.3 | 3.86 | Random | ||||||||
| Poaeaea | Oxytenanther aabyssinica (A. Rich.) Munro. | Gana | 2.10 | 1.2 | 1.16 | 5.82 | Aggregated | ||||||||
| Zygophyllacae | Balanites aegyptiaca (L.) Delile | Hijlij | 12.5 | 5.55 | 8.8 | 26.9 | 1.35 | 1.07 | 0.25 | 2.67 | Aggregated | ||||
| Fabaceae | Acacia mellifera (Vahl) Benth. | Kitir | 2.50 | 21.6 | 6.9 | 30.9 | 9.46 | 5.64 | 9.20 | 24.3 | 0.84 | 0.7 | 0.70 | 5.38 | Aggregated |
| Acacia oerfota (Forssk.) Schweinf | Laot | 2.50 | 10.3 | 3.3 | 16. | Aggregated | |||||||||
| Acacia seyal Del. | Talih | 2.50 | 1.0 | 0.3 | 3.86 | Random | |||||||||
| Acacia tortilis (Frosk.) Hayne subsp. raddiana | Sayal | 17.5 | 9.69 | 21.5 | 48.7 | 1.35 | 2.13 | 0.50 | 3.98 | Aggregated | |||||
| Albizia aylmeri Hutch | Sireira | 1.68 | 0.5 | 0.47 | 3.43 | Aggregated | |||||||||
| Albizia amara (Roxb.) Boiv. | Arad | 4.05 | 2.5 | 1.7 | 8.27 | Aggregated | |||||||||
| Albizia anthelmintica Brongn | Um Takirni | 1.35 | 11 | 0.3 | 2.67 | Random | |||||||||
| Bauhinia rufescens Lam. | Kulkul | 2.50 | 1.0 | 0.7 | 4.18 | Random | |||||||||
| Dichrostachyscinerea (L.) White & mArn. | Kadad | 2.71 | 19.7 | 9.2 | 31.6 | 17.8 | 29.4 | 29.4 | 54.9 | Aggregated | |||||
| Dalbergia melanoxylon Guill. & Perr. | Babanous | 0.84 | 0.2 | 0.23 | 2.36 | Random | |||||||||
| Faidher biaalbida (Del.) Chev. | Haraz | 2.50 | 1.0 | 0.7 | 6.68 | Random | |||||||||
| Indigofera  oblongifolia | Hinat Algrood | 5.00 | 8.8 | 5.5 | 19.3 | Aggregated | |||||||||
| Mundulea  sericea (Willd.) A. Chev. | Iram | 1.35 | 1.1 | 0.3 | 2.67 | 4.63 | 2.5 | 2.54 | 9.73 | Aggregated | |||||
| Senna alexandrina Mill. | Sanamaka | 2.50 | 3.1 | 1 | 6.56 | Aggregated | |||||||||
| Tamarindus indica L. | Aradeib | 1.35 | 1.1 | 0.3 | 2.67 | 2.10 | 1.2 | 1.16 | 5.8 | Aggregated | |||||
| Rhminaceae | Ziziphus abyssinica Hochst. ex A. Rich | NabagAlfeel | 0.84 | 0.2 | 0.23 | 2.36 | Random | ||||||||
| Ziziphus spina-christi (L.) Desf. | Sidir | 5.00 | 11 | 3.6 | 19.9 | 1.35 | 1.1 | 0.3 | 2.67 | Aggregated | |||||
| Moraceae | Ficus populifolia Vahl. | 1.35 | 1.1 | 0.3 | 2.67 | 0.84 | 0.2 | 0.23 | 2.36 | Random | |||||
| Euphorbiaceae | Croton zambesicus Muell | Um Gileila | 1.26 | 0.7 | 0.70 | 4.52 | Random | ||||||||
| Euphorbia candelabrum Trémaux ex Kotschy | Shagart Alsim | 0.84 | 0.2 | 0.23 | 2.36 | Random | |||||||||
| Combretaceae | Combretum aculeatum Vent. | 5.00 | 1.5 | 1 | 7.52 | Random | |||||||||
| Combretum collinum Fresen. subsp. binderaum (Kotschy) Okafor | 2.70 | 8 | 3.7 | 14.4 | 7.99 | 13.2 | 13.2 | 28.9 | Aggregated | ||||||
| Combretum molle G. Don | 5.41 | 2.4 | 2.2 | 10.1 | 4.63 | 7.6 | 7.64 | 20 | Aggregated | ||||||
| Terminalia brownii Fresen | 8.11 | 5.3 | 7.5 | 20.9 | 5.05 | 4.2 | 4.16 | 13.1 | Aggregated | ||||||
| Burseraceae | Boswellia papyrifera (Del.) Hochst. | 3.78 | 0.7 | 0.73 | 7.08 | Aggregated | |||||||||
| Commiphora africana (A. Rich) | 10.8 | 9.47 | 17.7 | 37.9 | 5.21 | 7.17 | 7.17 | 18.8 | Aggregated | ||||||
| Anacardiaceae | Sclerocarya birrea (A. Rich.) Hochst. | 1.35 | 2.13 | 0.5 | 3.98 | 2.10 | 1.2 | 1.16 | 5.82 | Aggregated | |||||
| Searsia pyroides (Burch.) Moffett | 1.35 | 1.07 | 0.3 | 2.67 | 1.68 | 0.9 | 0.93 | 5.17 | Random | ||||||
| Malvaceae | Azanza garckeana (F. Hoffm.) Exell & Hillc. | Nakhgar | 3.78 | 2.1 | 2.09 | 8.44 | Aggregated | ||||||||
| Grewia flavescens Juss. | Khelekhsan | 5.41 | 1.33 | 1.2 | 7.98 | 3.64 | 3.0 | 3.01 | 10.5 | Aggregated | |||||
| Grewia mollis Juss | Basham | 0.84 | 0.2 | 0.23 | 2.36 | Random | |||||||||
| Grewia tenax (Forsk.) Fiori. | Gideim | 10.0 | 1.8 | 2.3 | 14.1 | 1.35 | 4.26 | 1.0 | 6.61 | 0.84 | 0.2 | 0.23 | 2.36 | Aggregated | |
| Grewia villosa Willd. | Greigdan | 4.05 | 1.42 | 1.0 | 6.47 | 2.94 | 3.2 | 3.24 | 11.3 | Aggregated | |||||
| Sterculia setigera Del. | Tartar | 3.93 | 3.2 | 3.24 | 11.0 | Aggregated | |||||||||
| Sterculia setigera Del. | Tartar | 3.93 | 3.2 | 3.24 | 11.0 | Aggregated | |||||||||
| Capparaceae | Boscia angustifolia A. Rich. | Sreih | 6.76 | 4.05 | 4.7 | 15.5 | 0.84 | 0.2 | 0.23 | 2.36 | Aggregated | ||||
| Boscia senegalensis Lam. | Mikheit | 17.5 | 19.2 | 42.7 | 79.4 | 5.41 | 1.87 | 1.8 | 9.03 | 0.84 | 0.2 | 0.23 | 2.36 | Aggregated | |
| Olacaceae | Ximenia americana L. | Kalto | 6.76 | 1.92 | 2.2 | 10.9 | 2.52 | 2.1 | 2.09 | 8.46 | Aggregated | ||||
| Ebenaceae | Diospyros mespiliformisHochst. ex A. DC. | Gughan | 0.84 | 0.2 | 0.23 | 2.36 | Random | ||||||||
| Rubiaceae | Vangueria madagascariensis Gmel. | Kirkir | 0.84 | 0.2 | 0.23 | 2.36 | Random | ||||||||
| Loganiaceae | Strychnos innocua Del. | Abgawi gawi | 5.05 | 1.4 | 1.39 | 7.72 | Aggregated | ||||||||
| Apocynaceae | Adenium obesum (Forssk.) Roem & Schult. | Shagartelsim | 2.50 | 1.03 | 0.33 | 3.86 | Random | ||||||||
| Bignoniaceae | Stereospermum kunthianum Cham. | Khashkhashabiad | 2.70 | 1.60 | 0.75 | 5.05 | 1.12 | 0.9 | 0.93 | 5.89 | Random | ||||
| Lamiaceae | Premna resinosa (Hochst.) Schauer | Singeil | 5.00 | 2.06 | 1.3 | 8.36 | 10.8 | 17.7 | 33.1 | 61.6 | 7.74 | 10.6 | 10.6 | 24.8 | Aggregated |
| Apiaceae | Steganotaenia araliacea Hochst. | DaminAshara | 1.35 | 1.07 | 03 | 2.67 | 0.25 | 2.67 | Random | ||||||
Table 1: Phytosociological parameters and species distribution pattern.
However there were differences among elevation gradients. Fabaceae, Malvaceae and Combretaceae were well represented in all the three communities, but Fabaceae decreased with increment of elevation, it was most diverse at low altitude (community I). On the other hand the number of species in the Malvaceae and Combretaceae increased with the increment of altitude from one species at (community I) to 4 and 3 species at community (III).
The higher altitudes play an important role for conserving species diversity in both communities II & III.
Phytosociological parameters
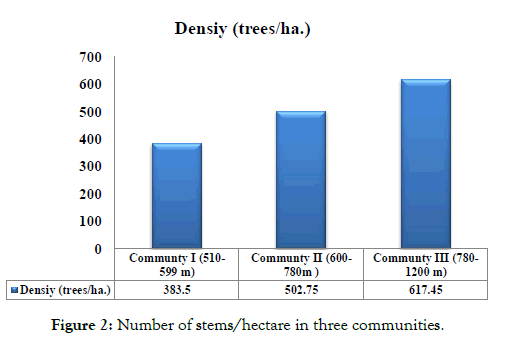
Density: The total density of all species was highest in community
III (617 individuals /ha), followed by community II (502 individuals/ha) and community I (383 individuals /ha) (Figure 2). While the highest species relative density was recorded by B. senegalensis (42.7%) in community I, followed by Premna resinosa (33.07%) in community II, and D. cinerea (29.38%) in community III, in addition to A. tortilis (Frosk.) Hayne subsp. raddiana (21.51) and C. africana (17.65%) (Table 1).

Figure 2: Number of stems/hectare in three communities.
Dominance: Dominance of species was assigned based on the calculated values of importance value index (IVI) It was found that in community I B. senegalensis was dominant species with highest IVI (79.42) followed by A. tortilis sub sp. raddiana (48.70). P. resinosa with IVI (61.60) was dominated in community II, followed by C. africana (37.92). While community III was dominated by D. cinerea (54.88) followed by C. hartmannianum (28.87) (Table 1).
The lowest elevation (community I) is characterized by the species of low rainfall woodland savanna zone such as A. tortilis subsp. raddiana, B. senegalensis and A. oerfota. While the other two elevations (Communities II&I) characterized by the species of hill catena`s which fall under the special areas of the low rainfall woodland savanna zone, such as S. setigera, S. birrea, S. innocua in addition to other savanna tree species [7].
Richness and diversity indices
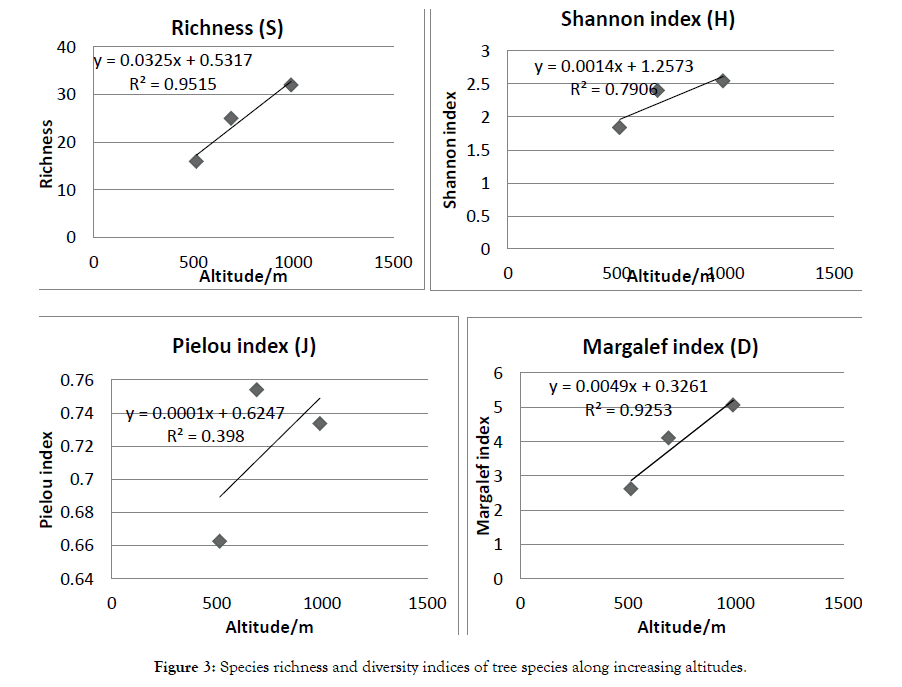
The results of this study revealed that the richness of studied communities was 16 in community (I) across 510-599 m altitudinal gradient, 25 in community (II) and 32 in community (III).
Floristic diversity in term of species richness, family’s richness and genera richness as well as species diversity indices showed general trend in relation to elevation. The number of families and genera followed the same pattern as species richness, with the maximum number of families (18 families), genera (27) and species (33) at community (III), whereas the minimum number of families (9), genera (13) and species (16) was recorded at community (I) (Table 2).
| Community and Average altitude/m |
Richness (S) | Shannon index (H) | Pielou index (J) | Margalef index (D) |
|---|---|---|---|---|
| Community [1] (514.5 m) |
16 | 1.84 | 0.66 | 2.62 |
| Community [2] (690 m) |
25 | 2.4 | 0.75 | 4.11 |
| Community [3] (990 m) |
32 | 2.54 | 0.734 | 5.06 |
Table 2: Richness and diversity indices of studied communities along different altitudes.
On the other hand community (III) showed the highest value of Shannon diversity index (H) with value (2.54), Pielou evenness index (0.734) and Margalef index (5.06), while the lowest values were recorded at zone (I), as follow, Shannon diversity index (H) with value (1.84), Pielou evenness index (0.66) and Margalef index (2.62) (Table 2).
From the above values, it is very clear that the species diversity increased with the increment of elevation, this agreed with the fact that reported in Rashad and Alabassia for the woody plants by Margalef [18].
A linear correlation analysis showed that species richness (r=0.9592, P=0.182479), Shannon (r =0.857737, P=0.343785), Pielou (r=0.579397, P=0.606652) and Margalef (r=0.94222, P=0.217507) diversity indices were positively correlated with altitude and not significant in diversity along the altitudinal gradient at p<0.05 (Figure 3).

Figure 3: Species richness and diversity indices of tree species along increasing altitudes.
The increment of plant species diversity with increment of elevation may be caused by different ecological factors such as differences in temperature between different elevations and differentiation of soils. The effect of elevation gradient in the species richness pattern is commonly explained by similar factors to the altitudinal gradient such as climatic factors, productivity, and other energy-related factors. Mishra [19] pointed out that many components of climate and environmental factors (e.g. Temperature, precipitation, seasonality and disturbance regime) vary along elevation gradients and ultimately create the variation in species richness. Elevation gradients create varied climates, along with resultant soil differentiation; promote the diversification of plant species [20-22]. In addition to intensive human activities such as shifting cultivation and collection of fire wood in lower elevations (community I), decreased the plant species diversity. Human activities largely impact the natural rate of change in biodiversity by influencing species invasion, displacement and extinction rates [23,24].
Similarity of communities
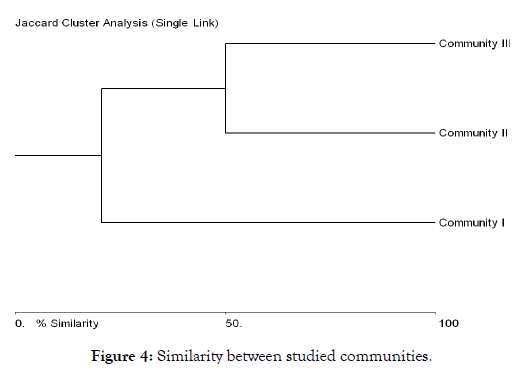
The overall species similarity according to Jaccard index was highest (50%) between community 2 and community 3, this may be attributed to the fact that the two sites were characterized by similar soils and relatively close elevations, in addition to difficulty of human and animal access, caused the highly similarity and diversity of both communities. On the other hand similarity between community 1 and community 2 was (20.588%). While community 1 and community 3 have least (9.09%) similarity in all species (Figure 4), this may be due to differences in elevations and soil types between the two sites.

Figure 4: Similarity between studied communities.
Species distribution
Distribution pattern of plant species in different habitats was assessed and result revealed that 18 species (38.3%) were randomly distributed and 29 species (61.7%) were aggregated this is an indication to the suitability of these habitats for the aggregated species (Table 1). The results are in agreement with [25] who stated that aggregated distribution indicated the habitat preference, while random distribution indicates that the environment in which these plant species grow is homogeneous and has many factors acting on the population [26].
The quantitative inventory of plant species diversity showed that a considerable variation in vegetation components throughout different communities. The lowest elevation (Community I) is characterized by the species of semi desert zone such as A. tortilis subsp. raddiana, B. senegalensis and A. oerfota. While the other two elevations (Communities II & III) characterized by the species of Savanna zone, such as S. setigera, S. birrea, S. innocuain addition to other savannah tree species.
The increment of plant species diversity and density with the increment of elevation may be caused by different ecological factors such as differences in temperature between different elevation and differentiation of soils. Elevation gradients create varied climates, along with resultant soil differentiation; promote the diversification of plant species. In addition to the intensive human activities such as shifting cultivation, over grazing and collection of fire wood in the lower elevations (Community I), decreased the plant species diversity whereas the difficulty of accessing the higher elevation, plays an important role for conserving species diversity in higher elevations (Communities II and III).
Citation: Ismail MI, (2020) Changes in Ecological Parameter of Woody Vegetation along Altitudinal Gradient in Jebel ElDair, North Kordofan, Sudan Forests. 9:228. doi: 10. 35248/2168-9776.20.9.228
Received: 31-May-2020 Accepted: 09-Jun-2020 Published: 16-Jul-2020 , DOI: 10.35248/2168-9776.20.9.228
Copyright: © 2020 Ismail MI. This is an open-access article distributed under the terms of the Creative Commons Attribution License, which permits unrestricted use, distribution, and reproduction in any medium, provided the original author and source are credited.