Advances in Automobile Engineering
Open Access
ISSN: 2167-7670
ISSN: 2167-7670
Research - (2023)Volume 12, Issue 2
Electric vehicles are the future of mobility. Along with the rapid accretion of EVs in the last few years, demand for quick charging, high efficiency, and longer battery life has increased. With faster charging-discharging cycles, there comes a challenge to maintain efficiency with faster heat dissipation. One such way is passive cooling using Phase Change Material (PCM). PCMs are widely used as Latent Thermal Energy Storage (TES) in thermal management systems because of their large latent heat and capabilities of maintaining a nearly constant temperature. A TES technology requires a number of scientific and technological challenges to be addressed including TES materials, components, and devices. In this paper, Analysis was done on 18650 Li-ion cells for various discharge rates using PCM. Comparative computational fluid dynamic analysis for all discharge rates with different cooling techniques was performed and it gives insights into the performance of techniques under observation.
Phase change material; Passive cooling; Active cooling; Battery thermal management; Computational fluid dynamic analysis; Latent thermal energy storage
With the increasing demand of EVs, there’s a more increasing need over improved performance of these electric vehicles quick charging ability, increased power density of the batteries, faster charging-discharging cycles, etc. can be solutions [1]. To cater this, a common solution lies with the thermal management system of the batteries, specifically the lithium ion batteries which are efficient till current date. In thermal management system, an efficient way of cooling of these lithium ion battery packs will be really helpful, to all the above up gradations expected. The different ways of cooling are as follows (Figure 1).

Figure 1: Different ways of battery cooling.
However among all types of cooling methods, passive cooling using Phase Change Materials (PCM), serves as the efficient and optimized way to drive away the heat. Here, the battery cells are surrounded by Phase Change Material (PCM) which is expected to drive away and store the heat. This method is also called as passive cooling technique. The use of this is quite common for cooling the fluids in thermal power plants, however using this technique in EVs is first of its kind [2].
Thermal Energy Storage (TES) is a form of energy storage system, material gains energy when there is increase in its temperature, and loses it when decreasing. This property makes TES possible to use different materials with different thermal properties and achieve various results which can lead to different thermal energy storage applications (e.g. heating and cooling). TES can help to equalize energy demand and supply on a daily, weekly and even seasonal basis, presented in thermal systems. TES can also reduce CO2 emissions, peak demand, energy consumption and costs; while also increasing the overall efficiency of energy systems [3].
Several scientists have reviewed PCMs from the point of view of their applications, materials, numerical models; etc. Thus, some significant parameters have been established for the application and study of PCMs, such as desirable characteristics of materials, requirements of the LHTESS, initial classification of PCMs and latent heat measurement techniques. Additional contributions have been performed by Warwood, et al. presented a novel method for thermal management of cylindrical battery cells to reduce internal thermal resistance inside the cell. In this work, internal heat pipe system using metallic discs is developed for battery cooling. Results shown that heat pipe system gives better cooling as compared with other approaches. Parsons and Mackin predicted transient thermal behaviour of commercial LiB pack (15 cells, 48 V) used in unmanned ground vehicle using commercial ANSYS Fluent package. Furthermore, a passive thermal management system comprising of a composite Expanded Graphite (EG) matrix infiltrated with a phase-changing paraffin wax was used to redesign battery pack [4]. The simulation was then conducted with similar loading conditions, peak power draw and time. The maximum temperature built up in battery pack with passive thermal management system was 50.30°C which is lower than previous design. Zhu, et al. investigated effect of adding Copper Nanowires (CuNWs) and Copper Nanoparticles (CuNPs) on thermal conductivity of dimethicone nanocomposites. Due to addition of these filler, the thermal conductivity of composites was increased. Salameh, et al. applied passive cooling system incorporating Phase Change Composite material (PCC) and an on-board intelligent battery management system. As an outcome of this work, monitoring and ensuring safe operation of battery accurately became possible as it estimates the thermal state of charge of PCC at every sections of battery pack. Wang, et al. discussed relative advantages and disadvantages of lithium-ion batteries for its use in EVs and HEVs [5]. Importance of Battery Thermal Management (BTM) for safe operation due to risk of fire catching and exploding is also highlighted. Hwang, et al. Developed Computational Fluid Dynamics (CFD) model of an existing commercial battery pack to determine effect of ventilation inlet and outlet location and battery cell gap on rate of heat generation and temperature distribution. With the help of CFD study, the locations of inlet and outlet and battery cell gap were optimized [6]. With improved design, it is found that rate heat dissipation was increased by 3.8%. Furthermore, the temperature difference between points of higher temperature to point of lower temperature was reduced from 6.04°C to 3.67°C. Yu, et al. presented a composite cooling system for LiB that combine’s high thermal conductivity and high latent heat of PCMs with heat pipe [7]. Temperature distribution in LiB at different heat generation rates and atmospheric temperatures was predicted using three-dimensional heat transfer simulation. It was found that proposed composite system maintains the temperature of battery below 40.2°C under normal working conditions. It was concluded that, composite cooling system proves efficient to PCM cooling system at high heat generation rate and high ambient temperature. Shembekar, et al. [8] CFD analysis is carried out to explore and report the effect of fin orientation on heat transfer enhancement of paraffin PCM filled in an internally finned spherical capsule. Keeping the same surface area of fin but oriented differently in spherical capsule is undertaken for the computational analysis. Manthan Disale presented a study on numerical modelling of single phase liquid immersion cooling and its velocity, pressure and temperature contours along with 2D plots of temperature variation (average, max) w.r.t time. Some authors have presented specific reviews for numerical models, such as Voller, et al. and Samarskii, et al. in which phase change formulations and numerical procedures were pointed out. Hu and argyropoulos focused their study mainly on latent heat formulation. Ma and Zhang have reviewed numerical models for the velocity transition between solid and liquid and performed tests and comparisons between different models [8].
Despite the large number of papers regarding PCMs, very few are specifically about numerical modeling features. In the present paper, we analyze the behavior of physical model and CFD model. The present paper has been divided into four main parts:
• Apparatus design for the experimental and simulation setup.
• Computational fluid dynamic analysis of designed apparatus using PCM.
• Computational fluid dynamic analysis of existing active cooling system.
• Comparative analysis between obtained results from simulation and experimentation [9].
Setup for experimentation and CFD analysis

Figure 2: Thermocouple arrangement.
This kind of arrangements was made to examine the temperature gradient around the length of cell (Figures 2 and 3).

Figure 3: Experimental setup for the battery testing.
Equipment’s used in this experiment:
• 18650 battery cell in test casing.
• Battery charger-discharger system for varying discharging rate (from 1 C to 3 C).
• Data acquisition system for temperature data.
• Thermocouple mounted around the battery cell on surficial level.
• Computer system to plot and analyse data extracted.
Battery cell specification
For the experimentation purpose we chose the samsung 25R (INR18650-25R) battery which have the 2500 mAh capacity most of the electric vehicles around the world uses the same battery in their battery packs, more specifications of the battery is mentioned in the following Table 1.
| Item | Specification |
|---|---|
| Nominal discharge capacity | 2,500 mAh |
| Charge: 1.25 A, 4.20 V, CCCV 125 mA cut-off Discharge: 0.2 C, 2.5 V discharge cut-off |
|
| Nominal voltage | 3.6 V |
| Standard charge | CCC V, 1.25 A, 4.20 V ± 0.05 V, 125 mA cut-off |
| Rapid charge | CCC V, 4 A, 4.20 V ± 0.05 V, 100 mA cut-off |
| Charging time | Standard charge: 180 min/125 mA cut-off |
| Rapid charge: 60 min (at 25°C)/100 mA cut-off | |
| Max. continuous discharge (Continuous) | 20 A (at 25°C), 60% at 250 cycles |
| Discharge cut-off voltage end of discharge | 2.5 V |
| Cell weight | 45.0 gmax |
| Cell dimension | Height: 64.85 mm ± 0.15 mm Diameter: 18.33 mm ± 0.07 mm |
| Charge: 0°C to 50°C | |
| Operating temperature (surface temperature) | (Recommended recharge release <45°C) |
| Discharge: -20°C to 75°C | |
| (Recommended re-discharge release <60°C) | |
| Storage temperature (recovery 90% after storage) | 1.5 year-30°C~25°C (1*) |
| 3 months-30°C~45°C (1*) | |
| 1 month-30°C~60°C (1*) |
Battery cycler specification
Discharging device or Battery cycler helps in testing the battery performance and for this purpose we conducted the experiments on ZKETECH EBD-A20H equipment. ZKETECH EBD-A20H is a DC electronic load with multiple battery discharge modes and suitable for various battery capacity tests and power tests [10-12].
Capacity fading of Li-ion batteries was studied at room temperature for battery with and without CPCM. The battery was cycled at 0.8°C charge rate (Around 2 A i.e. 2.5 hr.) C/1 discharge rate (one-hour discharge), C/2 discharge rate (halfhour discharge) C/3 discharge rate (Twenty-minute discharge). The module temperature, voltage, current, and charge and discharge capacities were measured and analyzed to evaluate cycle life of the tested modules.
Following are the battery cycler specifications:
• Power supply: DC 12 V/1 A.
• Voltage setting: 0.00 V-30.00 V, minimum step is 0.01 V.
• Current setting: 0.1 A-20.00 A, minimum step is 0.01 A (Current automatically limits when power is overrun).
• Test mode: DSC-CC: constant discharge current for testing battery capacity or supply current/DSC-CP: Constant discharge power for simulating constant power equipment or testing power supply.
• Voltage test: 0.000 V-4.500 V (low pressure) accuracy to 0.003 V, error ± 0.5%/4.50 V-30.00 V (high pressure) accuracy to 0.01 V, error ± 0.5%.
• Current test: 0.10 A-20.00 A, accuracy to 0.01 A, error ± 0.5%.
• Capacity test: Within 10 Ah, resolution is 0.001 Ah/10 Ah-100 Ah resolution is 0.01 Ah/Above 100 Ah resolution is 0.1 Ah.
• Discharge power: Max 200 W (It should be controlled within 90% for a long time working).
Data logger specification
For this particular experiment we have used the MK-16DL datalogger. The DL-35 utilizes a high contrast 3.5 inch color active matrix tft LED display with 16 channels data.
Thermocouple specification
Mainly three thermocouples were used to take the temperature data for the cells, for all the experiments two thermocouples were placed at the ends of battery; the third thermocouple was connected to the battery at middle position. This kind of arrangement was made to examine the temperature gradient around the length of cell. Following are the specification of thermocouple (Table 2).
| Sr. no. | Description | Specifications |
|---|---|---|
| 1 | Type of thermocouple | K type (Chromel-Alumel). |
| 2 | Tip | Ungrounded junction. |
| 3 | Lead resistance | Bidder to specify. |
| 4 | Color code | Red -ve, Yellow +ve for flying wires. |
| 5 | Range | 0°C-500°C |
| 6 | Applicable standards | |
| ASTM-E-235 | Standard specification for K type sheathed thermocouples for high reliability applications. | |
| IEC-584 | For thermocouple tolerances. | |
| ASTM-E-1652 | For magnesia. | |
Table 2: Thermocouple specification.
Cell was placed in paraffin of thickness 3 mm and set to discharge by 1 C, 2 C and 3 C discharge rate and its temperature is monitored as 307.0457, 309.7412 and 318.35 K.
Governing equations
• The governing differential equations used for fluid flow are:
• Mass conservation equation
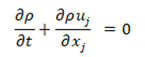
• Momentum conservation equation
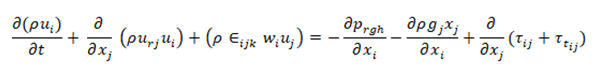
• Energy conservation equation
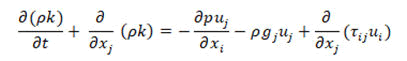
• Pressure equation
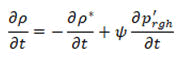
For the solid regions in the geometry only energy equation has to be solved. The energy equation gives temporal change of enthalpy of the solid which is equal to the divergence of the heat conducted through the solid:
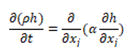
Where, h is the specific enthalpy, α=k/cp is the thermal diffusivity and ρ density. For the coupling between solid and fluid media,
At interface between solid s and fluid f the temperature T for both phases is same.
Tf=Ts
Furthermore the heat flux entering one region leaves and enters the second region. If we neglect radiation the above expression can be written as:
Qf= -Qs
If we neglect radiation the above expression can be written as:
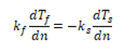
Represents the direction normal to wall. kf and ks are thermal conductivity of the fluid and solid.
Simulation procedure
Geometrical details: The CFD setup consists the assembly of cell placed in a casing stacked with PCM surrounding the cell (Figure 4 and Table 3).

Figure 4: Testing setup.
| Sr. no. | Part | Dimension |
|---|---|---|
| 1 | Cell | Dia-18 mm |
| Hgt-65 mm | ||
| 2 | PCM | ID-18 mm, OD-21 mm |
| Hgt-64 mm | ||
| 3 | Casing | ID-21 mm, OD-22 mm |
| Hgt-65 mm |
Table 3: Geometric specification of setup.
CAD model of passive cooling components
Battery cell: As mentioned above, cell used for experimentation was 18650 Li-ion battery cell. The cell was modelled in the design modeler of ansys fluent 2022 R1 Workbench (Figures 5-7).

Figure 5: Front view.

Figure 6: Isometric view.

Figure 7: Position of cell in setup.
Phase change material: Paraffin wax is used as PCM for experimentation and CFD analysis. It is considered to be less flammable and thermally more stable than any other organic PCM’s (Figures 8-10).

Figure 8: Front view.

Figure 9: Isometric view.

Figure 10: Position of PCM in setup.
Casing: The casing used for experimentation and CFD analysis was a customized 3D printed polymer module consisting of Li-ion cell (Type 18650) surrounded with PCM (Figures 11 and 12).

Figure 11: Isometric view.

Figure 12: Position of casing in setup.
CAD model of active cooling components
Active cooling is a technique where coolant is pumped to substantially boost the convective heat transfer coefficient of the system and decrease the overall temperature of the battery. The active cooling setup consists of a cylindrical duct with a heat transfer fluid entering the duct from inlet at the top and then exiting from outlet at the bottom with cell placed in the center of the arrangement. Here two fluids/coolant were taken into consideration- air and ethylene glycol (Figures 13 and 14).

Figure 13: Casing for active cooling.

Figure 14: Fluid space in the casing.
Mesh: Meshing of all the components was done in ANSYS fluent 2022 R1 meshing workbench. Several grid size checks were done. Following is the meshing data (Figures 15 and 16).
Passive cooling: Following is the meshing data for passive cooling setup: Table 4.
| Sr. no. | Parameter | Values |
|---|---|---|
| 1 | Element size | 1.2 mm |
| 2 | Skewness | 0.22782 |
| 3 | Orthogonal quality | 0.77106 |
| 4 | Element number | 509734 |
Table 4: Meshing data for passive cooling.

Figure 15: Meshed passive cooling model.

Figure 16: Meshed active cooling model.
Active cooling: Following is meshing data for active cooling setup: Table 5.
| Sr. no. | Parameter | Values |
|---|---|---|
| 1 | Element size | 1.3 mm |
| 2 | Skewness | 0.23152 |
| 3 | Orthogonal quality | 0.76594 |
| 4 | Element number | 505235 |
Table 5: Meshing data for active cooling.
Material properties and boundary condition
Cell material properties: Table 6.
| Sr. no. | Property | Value (SI unit) |
|---|---|---|
| 1 | Density | 2630 kg/m3 |
| 2 | Specific heat | 1282 J/Kg K |
| 3 | Thermal conductivity | 0.5 W/m K |
| 4 | Electric conductivity | 2 e+10 S/m |
Table 6: Material properties of cell.
PCM material properties: Table 7.
| Sr. no. | Property | Value (SI unit) |
|---|---|---|
| 1 | Density | 880 kg/m3 |
| 2 | Specific heat | 2000 J/KgK |
| 3 | Thermal conductivity | 0.3 W/mK |
| 4 | Viscosity | 0.0269 Kg/ms |
| 5 | Solidus temperature | 315 K |
| 6 | Liquidus temperature | 335 K |
Table 7: Material properties of phase change material.
Casing material properties: Table 8.
| Sr. no. | Property | Value (SI unit) |
|---|---|---|
| 1 | Density | 1240 kg/m3 |
| 2 | Specific heat | 1800 J/Kg K |
| 3 | Thermal conductivity | 0.13 W/m K |
| 4 | Electrical conductivity | 1e-12 S/m |
Table 8: Material properties of casing.
Air material properties: Table 9.
| Sr. no. | Property | Value (SI unit) |
|---|---|---|
| 1 | Density | 1.225 kg/m3 |
| 2 | Specific heat | 1006.43 J/Kg K |
| 3 | Thermal conductivity | 0.0242 W/m K |
| 4 | Viscosity | 1.7894e-05 Kg/m s |
Table 9: Material properties of air as heat transfer fluid.
Ethylene glycol material properties: Table 10.
| Sr. no. | Property | Value (SI unit) |
|---|---|---|
| 1 | Density | 1111.4 kg/m3 |
| 2 | Specific heat | 2415 J/Kg K |
| 3 | Thermal conductivity | 0.252 W/m K |
| 4 | Viscosity | 0.157 Kg/m s |
Table 10: Material properties of ethylene glycol as heat transfer fluid.
Boundary condition: Table 11.
| Settings | Values |
|---|---|
| Initial temperature | 300 K |
| Battery model | MSMD model |
| E-Chemistry model | NTGK empirical model |
| Initial DoD | 0.5 |
| Reference capacity | 10 ah |
| Nominal cell capacity | 2.5 ah |
| Maximum cell voltage | 4.2 V |
| Minimum cell voltage | 2.5 V |
| C-rate | 1 C, 2 C, 3 C |
| Convective heat transfer coefficient | 4.7296 W/m2 K |
| Fluid inlet velocity | 0.5 m/s |
| Gauge pressure | 0 Pa |
| Flow | Laminar |
| Gravitational acceleration | -9.81 m/s2 |
Table 11: Initial boundary conditions and settings.
Solver
There were total 9 models that were analyzed-(1) passive model at 1 C, 2 C and 3 C rate (2) active model at 1 C, 2 C and 3 C rate for air and liquid cooling. Cell temperature profile was observed using pressure based segregated algorithm solver.
CFD analysis for proposed PCM was conducted on 18650 Li-ion single battery/cell. The initial temperature for all the components of the apparatus including the battery/cell for all tests was 27°C (300 K). During bare discharge (without any cooling equipment), the battery temperature was raised up to 35.7°C, 42.5°C and 48.8°C for 1 C, 2 C and 3 C discharge rates respectively. Whereas with PCM the temperatures were controlled to 32.9°C, 34.1°C and 43.3°C for 1 C, 2 C and 3 C discharge rates respectively.
Figures 17-19 shows the temperature contours obtained from CFD results when cell discharged at 1 C discharge rate i.e. cell will take 3600 sec (60 min or 1 hr). From Table 12 it can be inferred that there is considerable difference between the experimental and CFD results whereas there is not much of a difference between the CFD results for active and passive cooling techniques. Contour obtained by using PCM for 1 C.

Figure 17: Cell contour obtained by using PCM for 1C.

Figure 18: Cell contour obtained by using air cooling for 1 C.
| Sr. no. | Cooling technique | C-rate | Temperature(K) |
|---|---|---|---|
| 1 | Phase change material | 1 C | 306.2 |
| 2 | Air cooling | 1 C | 307.4 |
| 3 | Glycol cooling | 1 C | 307 |
Table 12: Maximum cell temperature at 1 C discharge rate.

Figure 19: Cell contour obtained by using ethylene glycol cooling for 1 C.
Based on the results mentioned above, following graph was plotted. It can be observed that for 1 C discharge cycle-active glycol cooling works more efficiently than the other two cooling techniques implemented. Temperature difference for all the techniques taken into consideration in mentioned in Table 13 (Figure 20).

Figure 20: Comparison of battery cell temperature using cooling technique for 1 C discharge rate.
| Sr. no. | Cooling technique | Discharge cycle | Cell temperature (K) |
|---|---|---|---|
| 1 | Phase change material | 1 C | 306.1481 |
| 2 | Air cooling | 1 C | 306.8336 |
| 3 | Glycol cooling | 1 C | 305.828 |
Table 13: Cell temperature values obtained from CFD for 1 C discharge.
Figures 21-23 shows the temperature contours obtained from CFD results when cell discharged at 2 C discharge rate i.e. cell will take 1800 sec (30 min or 0.5 hr). From Table 14 it can be inferred that there is considerable difference between the experimental and CFD results whereas there not much of a difference between the CFD results for active and passive cooling techniques.

Figure 21: Cell contour obtained by using PCM.

Figure 22: Cell contour obtained by using air cooling.

Figure 23: Cell contour obtained by using ethylene glycol cooling.
| Sr. no. | Cooling technique | C-rate | Temperature (K) |
|---|---|---|---|
| 1 | Phase change material | 1 C | 309.2 |
| 2 | Air cooling | 1 C | 312.9 |
| 3 | Glycol cooling | 1 C | 309.8 |
Table 14: Maximum cell temperature at 2 C discharge rate.
Based on the results mentioned above, following graph was plotted. It can be observed that for 2 C discharge cycle active glycol works more efficiently than the other two cooling techniques implemented. Temperature difference for all the techniques taken into consideration in mentioned in Table 15 and Figure 24.

Figure 24: Comparison of battery cell temperature using cooling technique for 2 C discharge rate.
| Sr.no. | Cooling technique | Discharge cycle | Cell temperature (K) |
|---|---|---|---|
| 1 | Phase change material | 2 C | 308.0699 |
| 2 | Air cooling | 2 C | 310.2315 |
| 3 | Glycol cooling | 2 C | 306.1809 |
Table 15: Cell temperature values obtained from CFD for 2 C discharge.
Figures 25-27 shows the temperature contours obtained from CFD results when cell was discharged at 3 C discharge rate i.e. cell will take 1200 sec (20 min or 0.33 hr). From Table 16 it can be inferred that there is considerable difference between the experimental and CFD results whereas there not much of a difference between the CFD results for active and passive cooling techniques.

Figure 25: Cell Contour obtained by using PCM.

Figure 26: Cell contour obtained by using air cooling.

Figure 27: Cell contour obtained by using ethylene glycol cooling.
| Sr. no. | Cooling technique | C-rate | Temperature (K) |
|---|---|---|---|
| 1 | Phase change material | 3 C | 316.9 |
| 2 | Air cooling | 3 C | 318.2 |
| 3 | Glycol cooling | 3 C | 315.3 |
Table 16: Maximum cell temperature at 3 C discharge rate.
Based on the results mentioned above, following graph was plotted. It can be observed that for 3 C discharge cycle active glycol cooling works more efficiently than the other two cooling techniques implemented. Temperature value of cell for all the techniques taken into consideration are mentioned in Tables 17-21 and Figure 28.
| Sr.no. | Cooling technique | Discharge cycle | Cell temperature (K) |
|---|---|---|---|
| 1 | Phase change material | 3 C | 316.4202 |
| 2 | Air cooling | 3 C | 317.8424 |
| 3 | Glycol cooling | 3 C | 315.7251 |
Table 17: Cell temperature values obtained from CFD for 3 C discharge.

Figure 28: Comparison of battery cell temperature using cooling technique for 3 C discharge rate.
| Sr.no. | Discharge cycle | Experimental value using PCM | CFD value using PCM | Temperature difference |
|---|---|---|---|---|
| 1 | 1 C | 307.0457 | 306.1481 | 0.8976 |
| 2 | 2 C | 309.7412 | 308.0699 | 1.6713 |
| 3 | 3 C | 318.35 | 316.4202 | 1.9298 |
Table 18: Temperature comparison of bare cell with and without PCM.
| Sr. no. | Cooling technique | C-rate | Temperature difference with PCM (K) |
|---|---|---|---|
| 1 | Air cooling | 1 C | -0.6875 |
| 2 | Glycol cooling | 1 C | 0.3181 |
Table 19: Temperature comparison of active cooling with passive cooling for 1 C discharge rate.
| Sr. no. | Cooling technique | C-rate | Temperature difference with PCM (K) |
|---|---|---|---|
| 1 | Air cooling | 2 C | -2.1616 |
| 2 | Glycol cooling | 2 C | 1.889 |
Table 20: Temperature comparison of active cooling with passive cooling for 2 C discharge rate.
| Sr. no. | Cooling technique | C-rate | Temperature difference with PCM(K) |
|---|---|---|---|
| 1 | Air cooling | 3 C | -1.4222 |
| 2 | Glycol cooling | 3 C | 0.6851 |
Table 21: Temperature comparison of active cooling with passive cooling for 3 C discharge rate.
Note: ‘-’ denotes temperature lower than PCM and ‘+’ denotes temperature higher than PCM
Computational fluid dynamic analysis for 18650 lithium-ion battery/cell has been done using phase change material and validated against experimental setup consisting of pcm and CFD Model of active air and glycol cooling is implemented. Following conclusions can be drawn from above mentioned graphs and simulation results:
• Cell temperature when compared for 1 C, 2 C and 3 C
discharge rate shows temperature difference of -0.6875,
-2.1616 K and -1.4222 K when active glycol cools and passive
cooling using PCM is used.
• Cell temperature when compared for 1 C, 2 C and 3 C
discharge rate shows temperature difference of +0.3181,
+1.8890 K and +0.6851 K when active air cooling and passive
cooling using PCM is used.
• Battery thermal management systems work effectively for
higher discharge rates, for 2 C or more than 2 C rate. Active
glycol cooling was found efficient for low (1 C) and high (3 C)
discharge rates while cooling done using PCM stands second
and active air cooling after that.
New battery technology breakthrough is happening rapidly. Advanced new batteries are currently being developed, with some already on the market. The latest generation of grid scale storage batteries has a higher capacity, a higher efficiency, and is longer-lasting. As per the research, active cooling technique using ethylene glycol tends to be more efficient than passive cooling using phase change material. But the issue with active cooling compared to passive cooling is mainly the financial costs and energy consumption. Because of active cooling's high energy requirement, it makes it much less energy efficient as well as less cost efficient.
Citation: Salunkhe A (2023) CFD Simulation for Thermal Management System (Passive PCM Cooling) of Lithium Ion Batteries in EVs. Adv Automob Eng. 12:230.
Received: 19-Jan-2023, Manuscript No. AAE-23-21473; Editor assigned: 23-Jan-2023, Pre QC No. AAE-23-21473 (PQ); Reviewed: 06-Feb-2023, QC No. AAE-23-21473; Revised: 12-Apr-2023, Manuscript No. AAE-23-21473 (R); Published: 19-Apr-2023 , DOI: 10.35248/2167-7670.23.12.230
Copyright: © 2023 Salunkhe A. This is an open-access article distributed under the terms of the Creative Commons Attribution License, which permits unrestricted use, distribution, and reproduction in any medium, provided the original author and source are credited.