Journal of Aeronautics & Aerospace Engineering
Open Access
ISSN: 2168-9792
ISSN: 2168-9792
Research Article - (2015) Volume 4, Issue 1
Numerical simulations are performed for flow over Phoenix entry vehicle at Mars at zero angle of Attack and Mach number 10. Flow field features like bow shock, shear layers, expansion fan and separation bubble will be captured using CFD commercial package FLUENT. The computed wall data of pressure and temperature will be compared with experimental results at Mars atmospheric conditions. This project deals with the study of flow over Phoenix entry vehicle at Mach number 10. The concept of atmospheric entry has applications in various fields. Vehicles that typically undergo this process include exo-orbital trajectories. In this project, the type of entry vehicle considered is entry capsule, which enters Mars atmosphere from an orbit. The primary design consideration of entry capsule requires large spherical nose radius of their fore body that gives high aerodynamic drag and a short body length for reducing the total structural weight and the ballistic coefficient.
<Keywords: Phoenix entry vehicle; CFD; Aerodynamic drag; Mach number 10
Motivated by the curiosity about the universe origin, the search for the extraterrestrial intelligence, and the interest in the space recourses exploitation, exploration missions to Mars have been carried out several times since 1960s. THE Phoenix Mission was launched on Delta II rocket to mars. Phoenix is designed to study the history of water and search for complex organic molecules in the ice-rich soil of the Martian arctic [1].
In order to know about the planets and the natural satellites present in our solar system, there is a need for us to enter an orbit around that plant or satellite and observe them. For better understanding, we might even have to send rovers onto the surface of the planet or satellite to conduct experiments and if possible, bring them back to Earth. For this to happen, the space probe must pass through their atmosphere, reach the surface intact, conduct experiments there, travel back to Earth and perform another entry phase in order to reach Earth’s surface with the data collected. For this to happen, the entry vehicle must be designed accordingly.
Atmospheric entry refers to the movement of human made or natural objects as they enter the atmospheric of a planet from outer space, in the case of Earth from an altitude above the “edge of space” [2]. The vehicle which enters into the atmospheric conditions from the outer space is known as Entry Vehicle. Entry vehicle design addresses the design of controlled entry vehicles which are intended to reach the planetary surface intact. Vehicles that typically undergo this process include ones returning from orbit and ones on exo-orbital trajectories.
The use of CFD methods can valuable knowledge for future spacecrafts such as crew exploration vehicle, especially with the recent call to move back to the old Apollo shaped entry vehicle capsule rather than the usage of space shuttles. Hence, we choose to so analysis on entry capsules. The Phoenix Mars Lander seeks to verify the presence of water and habitable conditions in the Martian arctic.
Study the history of water by examining water-ice below the Martian surface.
• Determine if the Martian article soil could support life. • The details of design model are indicated in Figure 1 and also mentioned clear specifications in Table 1.
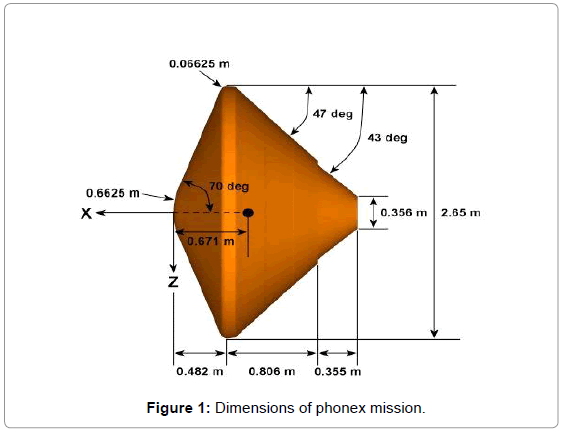
Figure 1: Dimensions of phonex mission.
| Specifications | Values |
|---|---|
| Diameter, m | 2.65 |
| Entry mass, kg | 602 |
| Relative entry velocity (km/s) | 5.5 |
| Relative entry FPA (deg) | -13.2 |
| Free stream Mach number at | 1.65 |
| parachute deployment | |
| Hypersonic α (deg) | 0 |
| Control | Non-spinning |
Table 1: Phonex specifications.
Objectives of this paper are to find:
▪ The entry vehicles considered and Martian entry capsules.
▪ In the present project, CFD analysis is done on two design configurations of Martian entry capsules, PHOENIX using software FLUENT.
▪ A study is taken up on the flow fields featured around the capsule at Mach number 10.
Numerical simulation methods
Computational Fluid Dynamics technique was undertaken to predict the aerodynamic force for the Mars entry vehicle. A finite volume approach was used to solve the full Navier– Stokes flow field equations for calorically perfect gas [3]. The code used the van Leer flux-vector splitting method for the inviscid fluxes with the 2nd order correction using the van Leer limiter. For time integration, the noniterative implicit method was used for rapid convergence.
Constant inflow condition was imposed on the far field boundary, and the extrapolation was used on the outflow boundary in all solutions. Non-slip wall boundary condition was implemented and the thermal state of the surface is radiative equilibrium with a fixed surface emissivity of 0.78.
The flow field is assumed to be steady and laminar. Unsteady effects are weak at these high speeds for long duration entry flight, and moreover, unsteady aerodynamic contribution is negligibly small in the after body. Transition to turbulence could occur but is weak due to low Reynolds number in the relatively thin Martian atmosphere.
where the reference viscosity μ0=1.48 × 10⁻⁵ kg/(m•s), the reference temperature T0=293.15 K, and the Sutherland constant C=240 K. Sutherland’s law agrees well with theoretical calculation.
Engineering prediction methods
Surface panel method was used to calculate the surface pressure coefficient for rapid prediction. The pressure coefficient for each individual element is the function of inflow velocity vector, the element area and the surface normal vector of the given element, and has no relation with the neighbor element [4]. The total aerodynamic coefficients are then calculated by integrating the panel pressure coefficient along the total surface.
The main work of the surface panel method is to calculate the surface pressure coefficient. Multiple engineering methods to predict the surface pressure coefficient have been developed so far, with their peculiar applications. The modified Newtonian theory is believed to be quite suitable for hypersonic aerodynamics prediction of blunt body, such as reentry shapes, Mars entry capsules, etc. The modified Newtonian formula can be described as:
Cp = Cpmas(V¯T/Voe)2
It can be seen that the stagnation pressure coefficient is the only function of inflow Mach number and the specific heat ratio. It is noted that the modified Newtonian formula is valid for windward region, and the coefficient in the leeward region is assumed to be zero because the pressure effect here is negligibly weak [5]. The velocity ratio is the cosine of the angle between the inflow velocity and the surface normal vector.
Effective specific heat ratio method
Multi component mixture exists in the Martian atmosphere, including approximately 95% CO2, 3% N2, 2% Ar and other negligible species. Since the real values of specific heat ratio markedly decrease at high-Mach-number flight conditions when the gas goes across the shock, effective specific heat ratio was specified to take the non-air and high-temperature real-gas effects into account. The post-shock specific heat ratio, which only depends on the local temperature for thermal perfect gas, is expected to be the effective value γeff. Considering the vibration excitation, the local specific heat ratio is:
where m is the number of gas species, wj is the mass fraction the species j. For each species, cP and cV are determined by molecular transitional, rotational and vibrational energy, so we
cP = cV + R
Validation case
The validation model is a scaled 70° sphere-cone configuration with the available numerical and experimental data. The wind tunnel experiment use CO2 as the test gas with the inflow enthalpy of 1.89 MJ/ kg (U∞=1908 m/s, p∞=1010 Pa). Calculated results from numerical simulation and engineering prediction based on the effective specific heat ratio method are compared against the experimental data [6]. The calculation results of the surface pressure from both two mentioned approaches, the DPLR data and the experimental data are all shown in Figure 2 for comparison. The comparison highlights a good agreement between calculated and experimental data, thus confirming reliability of the numerical simulations and engineering prediction for Mars entry capsules.
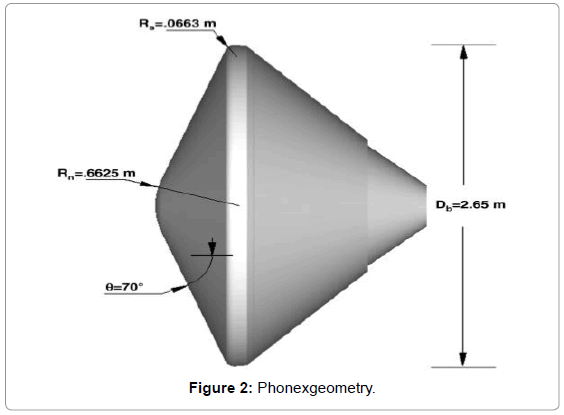
Figure 2: Phonexgeometry.
The various materials that can be used for different temperatures are mentioned in Table 2.
| Materials | Energy to | Melting |
|---|---|---|
| vaporize, Btu/lb | Temperature, R0 | |
| Tungsten | 1870 | 6500 |
| Titanium | 3865 | 3700 |
| Beryllium oxide | 13400 | 2900 |
| Graphite | 28700 | 6800 |
Table 2: Materials that can be used for the heat shield.
Here, Btu means the British thermal unit which is a traditional unit of energy equal to about 1,055.05585 joules. It is approximately the amount of energy needed to heat 1 pound (0.454 kg) of water from 276.9 K to 277.4 K.
Spacecraft specifications are Mass: The lift-off mass was 1,350 kg (2,980 lb), including 852 kg (1,878 lb) of propellant Bus: The spacecraft’s bus is a modified I-1 K structure and propulsion hardware configuration, similar to Chandrayaan-1, India’s lunar orbiter that operated from 2008 to 2009, with specific improvements and upgrades needed for a Mars mission. The satellite structure is constructed of an aluminium and composite fibre reinforced plastic (CFRP). Power: Electric power is generated by three solar array panels of 1.8 m × 1.4 m (5 ft 11 in × 4 ft 7 in) each (7.56 m2 (81.4 sq ft) total), for a maximum of 840 watts of power generation in Mars orbit. Electricity is stored in a 36 Ah Lithium-ion battery.
Propulsion: A liquid fuel engine with a thrust of 440 newton is used for orbit raising and insertion into Mars orbit. The orbiter also has eight 22-newton thrusters for attitude control. Its propellant mass is 852 kg (1,878 lb).
Atmospheric conditions taken in software to process the flow analysis are mentioned in the below Table 3.
| Parameters | MARS | EARTH |
|---|---|---|
| Surface gravity (g) | 3.71m/s2 | 9.8m/s2 |
| Surface heat at constant pressure(Cp) | 841 J/Kg-K | 1006.43 J/Kg-K |
| Thermal conductivity (k) | 0.01633w/m/k | 0.0242w/m/k |
| Viscosity | 1.51e-05kg/m-s | 1.716e-05kg/m-s |
Table 3: Initial conditions given in FLUENT.
Geometry and grid generation
The proposed geometry for aerodynamic performance analysis is the Mars phonex vehicle with sphere-cone fore body and threesectional- cone after body as described in Figure 2.
Two-dimensional surface grid is required for rapid aerodynamic prediction using the panel method, while full three-dimensional grid is necessary for numerical simulation of overall flow field. The computational grid for phonex vehicle configuration is a multi-block structured grid, mainly growing from the surface grid taking the boundary layer into consideration [7]. To assure accurate prediction, the grid is everywhere orthogonal to the body at the surface. Grid independence analysis shows that grids for the wall cell Reynolds number Rec=ρ∞U∞dw/μ∞ can fulfill the accuracy requirement of aerodynamics analysis, where dw is the normal grid distance close to the wall. Figure 3 shows both the two-dimensional surface grid and the grid on the symmetry plane.
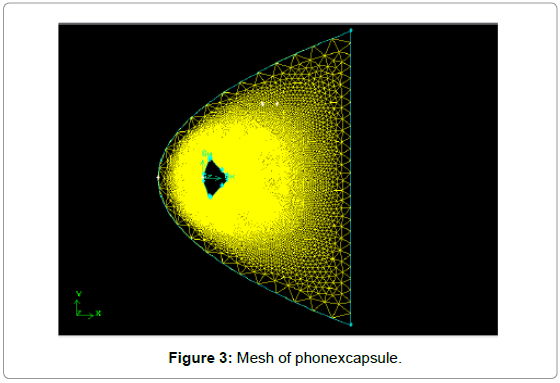
Figure 3: Mesh of phonexcapsule.
Mars entry flow field
In order to figure out the detailed hypersonic flow field, steady numerical simulations for a specific hypersonic flight state are herein performed. The flight speed is 3300 m/s and the Mach number is 10.
Hypersonic flow field for the phonex entry vehicle is complicated, especially for the vortex flow. Figure 4 shows the main steady structure of the hypersonic flow on the symmetry plane. A strong bow shock wave is detached from the surface and lies very close to the heat shield [8]. The gas across the shock wave is compressed to form a shock layer,much thinner than that of the air flow. Inflow uniform streamlines are deflected across the shock and travel around the body (Figure 5). Expansion waves occur near the shoulder due to large deflection angle. The gas gets accelerated in this region and merges into the external inviscid flow downstream from the shoulder. The heat shield boundary layer thickness increases from the stagnation point to the shoulder, and the shear layer appears after the shoulder, resulting in local vortex motion. Consequently, flow separation arises on the backshell (Figure 6). A large region of recirculating flow leads to relatively low pressure distribution on the backshell, which has a negligible contribution to the total coefficients. The wake flow after the capsule meets and then accumulates to form the recompression waves, which are nearly parallel to the inflow direction, and grow weaker to the outer flow.
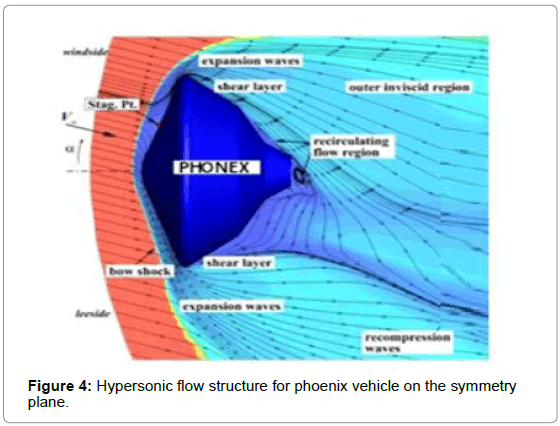
Figure 4: Hypersonic flow structure for phoenix vehicle on the symmetry plane.
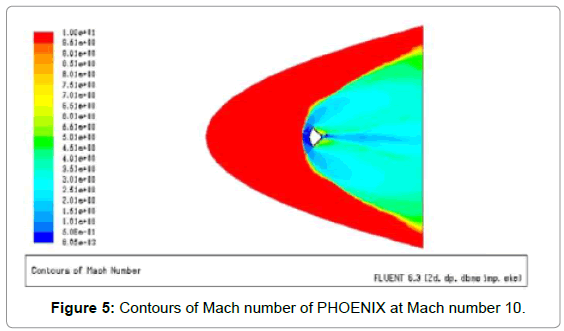
Figure 5: Contours of Mach number of PHOENIX at Mach number 10.
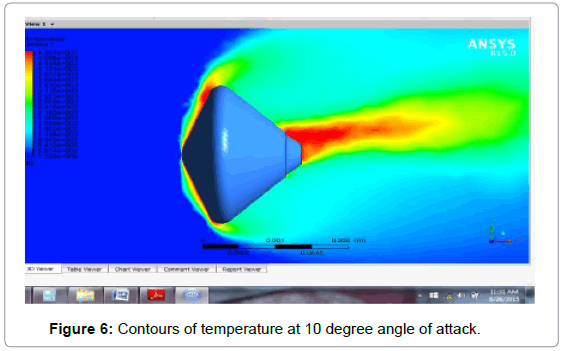
Figure 6: Contours of temperature at 10 degree angle of attack.
Below, in figures are images of the Mach number and pressure coefficient contours over PHOENIX capsule at mach number 10.
We can observe from the above contour that distinct shock wave that forms. The velocity magnitude scalar clearly illustrates the flow of the air coming to a slow halt as it gets closer and closer to the heat shield of the vehicle. In the Figure 5, of the pressure gradient scalar, we can observe a very similar shape for the shock wave; however, we also observe an expansion shock beginning to form from the corners of the craft. This is due to the fact that air cannot turn quickly enough around those corners.
The flow expands around the corners and separates to form a large recirculation region behind the vehicle. The flow in this region is highly unsteady and three dimensional with a large range of length and time scales. The shear layers enclosing the recirculation region come together at the neck region. A recompression shock is formed at this point that turns the outer flow to make it parallel to the vehicle axis.
Apart from the above observation it is found that variations of pressure and temperature is minimum at at 10 degrees angle of attack compare to the other angle of attack at Mach no 10 (Table 4).
| AOA | TEMPARATURE | PRESSURE | VELOCITY |
|---|---|---|---|
| 0 | 5.00e+003 | 6.23e+006 | 1.311e+004 |
| 10 | 4.957e+003 | 1.595e+007 | 3.109e+003 |
| 15 | 4.951e+003 | 1.557e+007 | 3.105e+003 |
Table 4: Various properties at different angle of attack.
Flow over PHOENIX entry capsules is computed at Mach number 10 using commercial CFD software FLUENT for ideal gas model. Turbulent model is considered. Results were obtained for various angles of attack. All essential flow field features are fairly well captured such as bow shock wave, expansion on the corner, recompression shock wave and re-circulation in the base region.
The following observations can be made about the flow characteristics from the results obtained for the configurations considered:
• Sonic line occurs near the junction between the fore body heat shield and the corner fillet of capsule
• The shock wave formed comes closer to the body with increase in Mach number
• At high speeds, even a slight change in the angle of attack can severely alter the activity of the entry capsule including the shock wave which plays a major factor in the fate of the craft
• With increase in angle of attack, the flow region affected increases and effective pressure and temperature decreases
• We have also seen that a change in the capsule shape can alter the wake formation behind the craft, which changes the deceleration.
• The flow characteristics obtained from the present study agree quite well with those obtained by earlier investigators.
This research was supported by Dr Satya Narayana Gupta, Department of Aeronautical engineering in MLR Institute of technology, Hyderabad.