Journal of Leukemia
Open Access
ISSN: 2329-6917
ISSN: 2329-6917
Research Article - (2014) Volume 2, Issue 4
Keywords: Radiotherapy; Lymphoma; Toxicity; Second malignancies; Lung and Heart sparing
Hodgkin lymphoma belongs to the group of malignancies with a high curability rate, as the 5-year relative survival is close to 84% for all forms of Hodgkin lymphoma combined, as a result of treatment based on chemotherapy and radiotherapy [1]. Progress in the management of Hodgkin lymphoma is related to the development of combination chemotherapy regimens and progress in radiotherapy techniques. However, these treatments are accompanied by late adverse effects such as cardiac toxicity and a risk of second cancers such as lung cancer and breast cancer for women [2-8]. The benefit-risk balance of the various treatment regimens must therefore be carefully assessed in order to achieve optimal disease control without increasing the risk of longterm sequelae.
The toxicity of radiotherapy can be decreased in three ways: reduce the dose, reduce treatment volumes and use innovative radiotherapy techniques such as Intensity-Modulated Radiotherapy (IMRT) [8]. The classical dose of 44 Gy has been reduced to 30-36 Gy. Similarly, treatment volumes have been reduced by replacing subtotal lymphoid irradiation by “involved-field” (IF) radiotherapy, which only includes lymph node territories initially invaded, then “involved-node” radiotherapy, only including invaded lymph nodes, which is currently at the stage of clinical evaluation [9]. In contrast, the respective roles of the various radiotherapy techniques in the treatment of Hodgkin’s lymphoma differ from one radiotherapy centre to another and no consensus has been reached on this subject.
Several comparative dosimetric studies have demonstrated improved coverage of target volumes and better sparing of certain organs at risk when IF radiotherapy is delivered by classical IMRT compared to three-dimensional conformal radiotherapy (3DCRT) for patients with supradiaphragmatic Hodgkin lymphoma, which could result in a reduction of late radiation-induced toxicity [10-12].
Few data are currently available concerning the use of tomotherapy in this indication [13]. The objective of this dosimetric study was to compare 3DCRT treatment plans and tomotherapy treatment plans in women treated by IF radiotherapy at a dose of 30 Gy and at a dose of 30 Gy plus 6 Gy for Hodgkin lymphoma in order to determine the place of tomotherapy in this indication.
Patient selection
This dosimetric study was based on 14 female patients with a median age of 23 years (range: 16-45 years) treated at Institute Curie for histologically documented stage II supradiaphragmatic Hodgkin lymphoma treated by a sequential combination of chemotherapy and radiotherapy. All patients were assessed by FDG PET before and after chemotherapy. All patients received ABVD and/or BEACOPP chemotherapy followed by “involved-field” radiotherapy to a total dose of 30 Gy with a 6 Gy boost to the residual tumour for 7 patients. Patient characteristics are shown in (Table 1).
| Characteristics | |
|---|---|
| Age | |
| - median | 23 years [16-45] |
| Women | 14 (100%) |
| Histology: - sclero-nodular | 14 (100%) |
| Ann Arbor classification - stage II | 14 (100%) |
| Chemotherapy : | |
| - 3 ABVD | 4 (29%) |
| - 4 ABVD | 7 (50%) |
| - 2 BEACOPP + 2 ABVD | 3 (21%) |
| Irradiation at the dose of 30 Gy : | 7 (50%) |
| - volume of PTV 30 Gy in 3D-CRT (median) | 620 cm3 [272-1536] |
| - médiastinal invasion alone | 2 (14%) |
| - mediastinal and pericardial invasion | 1 (7%) |
| - mediastinal and cervical invasion | 3 (22%) |
| - mediastinal, cervical and axillary invasion | 1 (7%) |
| Irradiation at the dose of 30 Gy + 6 Gy on the residual tumor : | 7 (50%) |
| - volume of PTV 30 Gy in 3D-CRT (median) | 506 [341-898] |
| - médiastinal invasion alone | 3 (22%) |
| - mediastinal and pericardial invasion | 2 (14%) |
| - mediastinal and cervical invasion | 1 (7%) |
| - mediastinal, cervical and axillary invasion | 1 (7%) |
Table 1: Patient characteristics (n=14).
Radiotherapy simulation
Simulation in the treatment position was based on two CT scans with a slice thickness of 3 mm about two weeks before starting radiotherapy: unenhanced CT followed by contrast-enhanced CT. Patients were positioned in the supine position with their arms above the head. A personalized immobilization mask was created for each patient. CT acquisition was performed under free breathing conditions.
Definition of radiotherapy volumes
CT and FDG PET performed before chemotherapy were fused with CT performed during radiotherapy simulation. Contouring was performed with Eclipse software (Varian Medical Systems, Palo Alto, USA) for all treatment plans. The Clinical Target Volume (CTV) was determined by the same radiation oncologist. Clinical target volumes treated at the total dose of 30 Gy corresponded to initially invaded lymph nodes according to the “involved-field” modality with the following modifications: cervical lymph nodes situated above the larynx were irradiated only when they were initially invaded; right and left supraclavicular lymph nodes were irradiated only when the mediastinum was initially invaded; the lower limit of the mediastinal field did not extend beyond the level of the initially invaded lymph nodes [14]. In the case of residual tumour on contrast-enhanced CT and/or FDG PET, a clinical target volume was determined to continue irradiation to a dose of 6 Gy. For the Planning Target Volume (PTV), a 10 mm margin was added to the CTV. The following organs at risk were delineated: spinal canal, heart, left and right lung, oesophagus, trachea, thyroid, left and right breasts. The origins of the left and right coronary arteries were contoured according to the anatomical atlas. The dose to healthy tissues was also studied by measuring the doses delivered to the external contour (extending 5 cm on either side of the PTV) without the PTV.
Treatment plans
Dosimetries were calculated by Eclipse software (Varian Medical Systems, Palo Alto, CA, USA) and Tomotherapy software (Tomotherapy Incorporated, Madison, WI, USA) for tomotherapy plans. Dose constraints are presented in (Table 2).
| Parameters | Objectives |
|---|---|
| PTV | |
| - V95 Gy | 95 % |
| Lungs | V20 Gy < 35% V30 Gy < 20 % |
| Heart | V30 Gy < 40 % Mean dose < 20 Gy |
| Left and right parotid (if high cervical irradiation) | V26 Gy ≤ 50 % |
| Canal médullaire | Maximum dose < 30 Gy |
Table 2: Dose constraints to target volumes and organs at risk.
3DCRT treatment plan
3DCRT ballistics are based on 6 MV or 20 MV beams using a multi-leaf collimator.
• In the absence of residual tumour after chemotherapy, a total dose of 30 Gy in 15 fractions (2 Gy per fraction) was prescribed to the isocentre of the 30 Gy PTV.
• In the presence of residual tumour after chemotherapy, an initial treatment plan delivering a dose of 30 Gy in 15 fractions (2 Gy per fraction) to the isocentre of the 30 Gy PTV was prescribed followed by a second plan delivering a dose of 6 Gy in 3 fractions (2 Gy per fraction) to the isocentre of the 36 Gy PTV.
To improve dosimetry, a field-in-field technique was used for treatment plans, when necessary. Dosimetries were calculated with Eclipse software using a convolution-superposition dose calculation algorithm in order to take into account the heterogeneities for a Varian Clinac accelerator.
Tomotherapy treatment plan: Tomotherapy treatment plans were elaborated for each patient using the same simulation CT scan as 3DCRT treatment plans. The same PTV and the same organs at risk were therefore used for 3DCRT and tomotherapy treatment plans. Tomotherapy treatment plans presented the following parameters: field width: 2.5 cm, pitch: 0.287 and modulation factor: 3. Dose constraints to target volumes and organs at risk were identical to those used for 3DCRT.
• In the absence of residual tumour after chemotherapy, a total dose of 30 Gy in 15 fractions (2 Gy per fraction) was prescribed to the 30 Gy PTV.
• In the presence of residual tumour after chemotherapy, simultaneous integrated boost (SIB) tomotherapy was performed. PTVtomo 30 Gy and PTV 36 Gy were contoured separately (Figure 1-4). PTVtomo 30 Gy in tomotherapy therefore corresponded to PTV 30 Gy in 3DCRT minus PTV 36 Gy with a 5 mm margin between PTVtomo 30 Gy and PTV 36 Gy. With the SIB technique, treatments of PTVtomo 30 Gy and PTV 36 Gy were combined in a single treatment plan. An alternative schedule to the sequential schedule was therefore defined: by using the linear quadratic model of cell survival, we calculated the total dose and the dose per fraction for PTVtomo 30 Gy and PTV 36 Gy to ensure that they were biologically equivalent to the total dose delivered to PTV 30 Gy and PTV 36 Gy by 2 Gy fractions in the sequential schedule. A α/β ratio of 10 Gy was chosen for tumour response and a α/β ratio of 3 Gy was chosen for late response of normal tissues. A dose of 30.5 Gy in 17 fractions (1.8 Gy per fraction) was therefore prescribed to PTVtomo 30 Gy and a dose of 35.7 Gy in 17 fractions (2.1 Gy per fraction) was prescribed to PTV 36 Gy.

Figure 1: Tomotherapy plan (left) and 3DCRT plan (right): PTVtomo 30 Gy (blue on left) with tomotherapy corresponds to PTV 30 Gy (blue on right) with 3DCRT minus PTV 36 Gy (magenta) with a 5 mm margin between PTVtomo 30 Gy and PTV 36 Gy.

Figure 2: Comparison of isodoses from 4 Gy to 38.5 Gy between tomotherapy (left) and 3DCRT (right) treatment plans for a patient with Hodgkin lymphoma invading anterior mediastinal lymph nodes treated up to a dose of 36 Gy. This qualitative dosimetric comparison demonstrates an increase of the volumes exposed to a dose of 4 Gy with tomotherapy compared to 3DCRT.

Figure 3: Comparison of isodoses from 27 Gy (90% of the dose to PTV 30 Gy) to 38.5 Gy (107% of the dose to PTV 36 Gy) between tomotherapy (left) and 3DCRT (right) treatment plans for a patient with Hodgkin lymphoma invading anterior mediastinal lymph nodes treated up to a dose of 36 Gy. This qualitative dosimetric comparison demonstrates an improvement of the conformation and homogeneity of the dose with tomotherapy compared to 3DCRT.

Figure 4: Comparison of dose-volume histograms of the tomotherapy (left) and 3DCRT (right) treatment plans for the same patient with Hodgkin lymphoma invading anterior mediastinal lymph nodes treated up to a dose of 36 Gy. Tomotherapy allowed a reduction of the volumes of heart (red) and lungs (blue), right breast (green) and left breast (yellow) exposed to high doses with a corresponding increase of the volumes exposed to low doses.
Dosimetries were calculated by inverse planning with Tomotherapy software. For each patient, tomotherapy treatment plans were optimized in order to be able to deliver irradiation under real conditions.
Evaluation
Three dosimetric studies were performed:
− Comparison of 3DCRT and tomotherapy treatment plans for 7 patients with no residual tumour treated at the dose of 30 Gy
− Comparison of 3DCRT and tomotherapy treatment plans for 7 patients with residual tumour treated at the dose of 30 Gy with a 6 Gy boost to the residual tumour.
− Comparison of 3DCRT and tomotherapy treatment plans for all patients (N=14)
Summation of 3DCRT treatment plans comprising PTV 30 Gy and PTV 36 Gy was performed to allow dosimetric comparison with SIB tomotherapy plans.
3DCRT and tomotherapy plans were compared quantitatively by analysis of physical doses on dose-volume histograms and qualitatively by visualization of isodose curves. The parameters analysed for PTV included mean dose, V90%, V95%, V100%, V107% of the prescribed dose, Conformity Index (CI) and Homogeneity Index (HI).
The RTOG (Radiation Therapy Oncology Group) conformity index (CI) was defined by the following formula [15]:
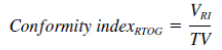
(TV: Target volume; VRI: prescription isodose volume)
The RTOG homogeneity index (HI) was defined by the following formula:
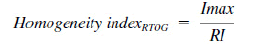
(Imax: Maximum isodose in the target volume; RI: Reference Isodose)
Parameters analysed for organs at risk included: mean dose, maximum dose, V4Gy, V10Gy, V20Gy, V30Gy and V36Gy for the right breast, left breast, lungs, heart, origin of the right coronary artery, origin of the left coronary artery, oesophagus and healthy tissues. The following parameters were analysed for the thyroid: mean dose, median dose, V18Gy, V26Gy and the parameters analysed for the spinal canal and trachea were maximum dose and mean dose, respectively.
Statistical analysis
Median values for each dosimetric parameter derived from dosevolume histograms of 3DCRT and tomotherapy treatment plans were compared by a nonparametric test for paired series (Wilcoxon test) using GraphPad Prism 5 software (Graph Pad Software, San Diego, CA, USA). Differences were considered to be significant for p<0.05.
Evaluation of tomotherapy and 3DCRT treatment plans at the dose of 30 Gy
Doses to target volumes: The mean doses delivered to the PTV 30 Gy were equivalent with 3DCRT and tomotherapy with significantly improved V90 and V95. The Conformity Index (CI) was better with tomotherapy (1.4) than with 3DCRT (2.9) (p=0.01). The homogeneity index was also better on tomotherapy plans (p=0.03) (Table 3).
| Paramètres | 3D-CRT | Tomotherapy | P |
|---|---|---|---|
| PTV 30 Gy | |||
| - Mean Dose | 30.1 (± 0.4) | 30.3 (± 0.9) | NS* |
| - V90 (%) | 98.1 (± 2.3) | 99.9 (± 0.1) | 0.03 |
| - V95 (%) | 94.7 (± 4.4) | 98,7 (± 0.8) | 0.03 |
| - V100 (%) | 63 (± 16.5) | 52.2 (± 5) | NS |
| - V107 (%) | 1.2 (± 1.7) | 0 | NS |
| - Conformity index | 2.9 (± 0.8) | 1.4 (± 0.2) | 0.01 |
| - Homogeneity index | 2.9 (± 4.2) | 0.5 (± 0.07) | 0.03 |
Table 3: Comparison of doses to the target volume.
Doses to organs at risk
• Right and left breasts
No significant difference in terms of the mean dose to the right breast and the left breast was observed between 3DCRT and tomotherapy, but, as expected, the V4 was higher with tomotherapy than with 3DCRT. Tomotherapy allowed a reduction of the maximum dose and a reduction of V15Gy and V20Gy for the right breast only (p=0.03) (Table 4).
| Parameters | 3D-CRT | P | |||
|---|---|---|---|---|---|
| Mean | Median | Mean | Median | ||
| Right breast | |||||
| - Mean dose (Gy) | 2.3 | 1.6 | 3.6 | 3.6 | NS* |
| - Maximum dose (Gy) | 26.4 | 29.5 | 18.4 | 20.4 | 0.03 |
| - V4 Gy (%) | 8.1 | 6.9 | 35.4 | 30.6 | 0.01 |
| - V10 Gy (%) | 7.3 | 5.3 | 10.5 | 6.1 | NS |
| - V15 Gy (%) | 5 | 3.9 | 2.1 | 0.6 | 0.03 |
| - V20 Gy (%) | 3.9 | 2.6 | 0.1 | 0.1 | 0.03 |
| - V30 Gy (%) | 0.5 | 1.3 | 0 | 0 | NS |
| Left breast | |||||
| - Mean dose (Gy) | 5 | 1.9 | 5.6 | 4.5 | NS |
| - Maximum dose (Gy) | 27.6 | 30.9 | 25 | 28.4 | NS |
| - V4 Gy (%) | 22.3 | 8.2 | 41.2 | 35 | 0.01 |
| - V10 Gy (%) | 18 | 5.7 | 22.8 | 15.8 | NS |
| - V15 Gy (%) | 14.9 | 3.2 | 10.9 | 6.4 | NS |
| - V20 Gy (%) | 13.1 | 2.6 | 5.5 | 1.6 | NS |
| - V30 Gy (%) | 1.1 | 0.5 | 0.3 | 0 | NS |
Table 4: Comparison of mean and median dosimetric parameters for the breasts.
• Lungs
Tomotherapy did not allow any reduction of the mean dose to the lungs. Volumes exposed to low doses were increased with tomotherapy and volumes exposed to doses greater than or equal to 20 Gy were increased with 3DCRT. The median V20Gy with tomotherapy and 3DCRT was therefore 16.2% and 23.9%, respectively (p=0.01) (Table 5).
| Parameters | 3D-CRT | Tomotherapy | P | ||
|---|---|---|---|---|---|
| Mean | Median | Mean | Median | ||
| Lungs - Mean dose (Gy) - Maximum dose (Gy) - V4 Gy (%) - V10 Gy (%) - V15 Gy (%) - V20 Gy (%) - V30 Gy (%) |
9.6 31.6 42.4 31.7 28.2 25.6 9.8 |
8.7 31.4 35.55 28.9 26.1 23.9 6.8 |
9.5 32.5 62 38.2 24.8 16.2 2.3 |
11.1 32.3 63.8 46.3 27.7 16.1 1.4 |
NS* NS 0,03 0,04 NS 0,01 0,04 |
Table 5: Comparison of mean and median dosimetric parameters for the lungs.
• Heart and origins of the coronary arteries
A reduction of the mean doses to the heart and V15Gy and V20Gy was observed with tomotherapy compared to 3DCRT (p=0.03, p=0.03 and p=0.01, respectively). No significant difference was observed between tomotherapy and 3DCRT in terms of dosimetric parameters of the origins of the coronary arteries (Table 6).
| Parameters | 3D-CRT | Tomotherapy | P | ||
|---|---|---|---|---|---|
| Mean | Median | Mean | Median | ||
| Heart - Mean dose (Gy) - Maximum dose (Gy) - V4 Gy (%) - V10 Gy (%) - V15 Gy (%) - V20 Gy (%) - V30 Gy (%) |
11.7 30.3 45 39.6 36.4 34.1 16.6 |
8.4 30.6 35.2 29.9 26.5 23.1 0.3 |
9 30 51.2 33.7 24.7 18.6 3.4 |
7 31 43.7 26.2 13.1 6.6 0.2 |
0.03 NS* NS NS 0.03 0.01 NS |
| Origin of right coronary artery - Mean dose (Gy) - Maximum dose (Gy) - V4 Gy (%) - V10 Gy (%) - V15 Gy (%) - V20 Gy Gy (%) - V30 Gy (%) |
24.4 25.4 85.7 85.7 84.2 81.2 37.6 |
29.6 29.8 100 100 100 100 31.8 |
21.4 22.9 85.7 77.9 71.4 71.4 25 |
25.8 27 100 100 100 100 0 |
NS NS NS NS NS NS NS |
| Origin of left coronary artery - Mean dose (Gy) - Maximum dose (Gy) - V4 Gy (%) - V10Gy (%) - V15 Gy (%) - V20 Gy (%) - V30 Gy (%) |
24.6 26.4 85.7 84.2 82.1 79.7 34.1 |
26.7 30 100 100 100 100 19.9 |
22.9 25.6 96.8 85.5 84.2 77 30 |
24.1 27.4 100 100 100 100 0 |
NS NS NS NS NS NS NS |
Table 6: Comparison of mean and median dosimetric parameters for the heart and the origins of the coronary arteries.
• Oesophagus
No significant difference in terms of dosimetric parameters of the oesophagus was observed between tomotherapy and 3DCRT (Table 7).
| Parameters | 3D-CRT | Tomotherapy | P | ||
|---|---|---|---|---|---|
| Mean | Median | Mean | Median | ||
| Esophagus | |||||
| - Mean dose (Gy) - Maximum dose (Gy) - V4 Gy (%) - V10 Gy (%) - V15 Gy (%) - V20 Gy (%) - V30 Gy (%) |
22.8 31.4 80.3 76.9 75.7 73.4 37.1 |
24 31.5 84.1 80.8 79.3 77.9 20.6 |
21.1 31.9 81.3 73.2 70 65.8 32.7 |
22 31.8 85.4 74.5 71.9 67.6 31.6 |
NS* NS NS NS NS NS NS |
Table 7: Comparison of mean and median dosimetric parameters for the esophagus.
• Spinal canal, trachea and thyroid
The maximum dose to the spinal canal was lower with tomotherapy than with 3DCRT (21.3 Gy vs 31.2 Gy; p=0.01). No significant difference in terms of the mean dose to the trachea was demonstrated, while the mean dose to the thyroid was lower with tomotherapy (26.1 Gy vs 28 Gy; p=0.03) (Table 8).
| Parameters | 3D-CRT | Tomotherapy | P | ||
|---|---|---|---|---|---|
| Mean | Median | Mean | Median | ||
| Spinal canal | |||||
| - Maximum dose (Gy) | 31.6 | 31.2 | 22.6 | 21.3 | 0.01 |
| Trachea - Mean dose (Gy) |
31.4 |
28.7 |
31.5 |
28 |
NS* |
| Thyroid - Mean dose (Gy) - V18 Gy (%) - V25 Gy (%) |
26 85.9 75 |
28 97.6 80.3 |
24 76 66.7 |
26.1 84.9 68.5 |
0.03 NS NS |
Table 8: Comparison of mean and median dosimetric parameters for the spinal canal, trachea and thyroid.
Healthy tissues
A significant increase in the volumes exposed to a dose of 4 Gy was observed with tomotherapy compared to 3DCRT (62.4% vs 35.1%; p=0.03). On the other hand, larger volumes were exposed to doses greater than or equal to 15 Gy with 3DCRT compared to tomotherapy (p=0.01) (Table 9).
| Parameters | 3D-CRT | Tomotherapy | P | ||
|---|---|---|---|---|---|
| Mean | Median | Mean | Median | ||
| Healthy tissue | |||||
| - Mean dose (Gy) | 8.2 | 7 | 7.9 | 8.1 | NS* |
| - Maximum dose (Gy) | 32.5 | 32.1 | 33.4 | 33.4 | NS |
| - V4 Gy (%) | 35.8 | 35.1 | 54.2 | 62.4 | 0,03 |
| - V10 Gy (%) | 28 | 23.8 | 29.8 | 29.1 | NS |
| - V15 Gy (%) | 24.6 | 21 | 18.7 | 16.5 | 0,01 |
| - V20 Gy (%) | 21.7 | 18.4 | 11.7 | 9.6 | 0,01 |
| - V30 Gy (%) | 7 | 4.7 | 1.1 | 1 | 0,01 |
Table 9: Comparison of mean and median dosimetric parameters for healthy tissues.
Evaluation of tomotherapy and 3DCRT treatment plans at the dose of 30 Gy with a 6 Gy boost to the residual tumour
Doses to target volumes
Dosimetric parameters of the PTV 30 Gy were equivalent with 3DCRT and tomotherapy. For PTV 36 Gy, the conformity index (CI) was better with tomotherapy than with 3DCRT (1.2 vs 5; p=0.01), with no difference in terms of the homogeneity index (Table 10).
| Parameters | 3D-CRT | Tomotherapy | P |
|---|---|---|---|
| PTV 30 Gy | |||
| - V90 (%) | 99.9 (± 0.3) | 99.8 (± 0.3) | NS* |
| - V95 (%) | 98.8 (± 1.5) | 99 (± 0.9) | NS |
| - V100 (%) | 86.7 (± 13.2) | 79.9 (± 8.1) | NS |
| PTV 36 Gy | |||
| - Mean dose | 36.5 (± 0.2) | 36 (± 0,1) | 0.01 |
| - V90 (%) | 99.6 (± 0.5) | 100 | NS |
| - V95 (%) | 98.6 (± 2.1) | 99 (± 1.5) | NS |
| - V100 (%) | 80 (± 12.6) | 54.9 (± 3.9) | 0.03 |
| - V107 (%) | 0 | 0 | NS |
| - Conformity index | 5 (± 1.2) | 1.2 (± 0.2) | 0.01 |
| - Homogeneity index | 0.7 (± 0.2) | 0.5 (± 0.1) | NS |
Table 10: Comparison of doses to target volumes.
Doses to organs at risk
• Right and left breasts
No significant difference in terms of mean dose to the right breast and the left breast was observed between 3DCRT and tomotherapy. Maximum doses were significantly lower with tomotherapy (p=0.01). V4Gy and V10Gy were significantly increased with tomotherapy compared to 3DCRT (p=0.01), while V20Gy and V30Gy were significantly decreased (Table 11).
| Parameters | 3D-CRT | Tomotherapy | P | ||
|---|---|---|---|---|---|
| Mean | Median | Mean | Median | ||
| Right breast | |||||
| - Mean dose (Gy) | 52.1 | 1.9 | 4.3 | 3 | NS* |
| - Maximum dose (Gy) | 32.29 | 32.4 | 21.8 | 21.8 | 0.01 |
| - V4 Gy (%) | 19.5 | 8 | 39.8 | 24.1 | 0.01 |
| - V10 Gy (%) | 15.8 | 6 | 11.6 | 4.7 | NS |
| - V15 Gy (%) | 13.8 | 3.9 | 4.3 | 1.9 | NS |
| - V20 Gy (%) | 12.5 | 3.2 | 1.2 | 0 | 0.01 |
| - V30 Gy (%) - V36 Gy (%) |
3.2 0 |
0.9 0 |
0 0 |
0 0 |
0.03 _ |
| Left breast | |||||
| - Mean dose (Gy) | 6,5 | 2 | 5.9 | 2.6 | NS |
| - Maximum dose (Gy) | 34.3 | 34.8 | 26.6 | 16,2 | 0.01 |
| - V4 Gy (%) | 23.8 | 8.3 | 41.5 | 25.7 | 0.01 |
| - V10 Gy (%) | 19.3 | 6.2 | 22.5 | 0.4 | NS |
| - V15 Gy (%) | 17.4 | 5.1 | 13.6 | 0 | NS |
| - V20 Gy (%) | 16 | 4.1 | 6.2 | 0 | 0.04 |
| - V30 Gy (%) | 6.7 | 4.5 | 0.4 | 0 | 0.03 |
| - V36 Gy (%) | 1.6 | 0 | 0.1 | 0 | NS |
Table 11: Comparison of mean and median dosimetric parameters for the breasts.
• Lungs
Tomotherapy did not decrease the mean dose delivered to the lungs. Volumes exposed to low doses were significantly increased with tomotherapy (V4Gy and V10Gy) and volumes exposed to doses greater than or equal to 20 Gy were significantly increased with 3DCRT (Table 12).
| Parameters | 3D-CRT | Tomotherapy | P | ||
|---|---|---|---|---|---|
| Mean | Median | Mean | Median | ||
| Lungs | |||||
| - Mean dose (Gy) | 9.7 | 8.6 | 10.3 | 10.3 | NS* |
| - Dmax (Gy) | 36.8 | 37.4 | 37.3 | 37.5 | NS |
| - V4 Gy (%) | 40.9 | 36.6 | 66.3 | 60.9 | 0.01 |
| - V10 Gy (%) | 31.6 | 29.6 | 44.4 | 42.8 | 0.01 |
| - V15 Gy (%) | 28.1 | 27.2 | 24.5 | 27.7 | NS |
| - V20 Gy (%) | 25.2 | 25.6 | 16 | 16.6 | 0.01 |
| - V30 Gy (%) | 13.4 | 12.4 | 3.6 | 3.3 | 0.01 |
| - V36 Gy (%) | 1.4 | 1.1 | 0.2 | 0.1 | 0.03 |
Table 12: Comparison of mean and median dosimetric parameters for the lungs.
• Heart and origins of the coronary arteries
A reduction of V20Gy for the heart was only observed with tomotherapy compared to 3DCRT (23.6% vs 35.9%; p=0.01). No significant difference in terms of dosimetric parameters of the origins of the coronary arteries was observed between tomotherapy and 3DCRT (Table 13).
| Parameters | 3D-CRT | Tomotherapy | P | ||
|---|---|---|---|---|---|
| Mean | Median | Mean | Median | ||
| Heart - Mean dose (Gy) - Maximum dose (Gy) - V4 Gy (%) - V10 Gy (%) - V15 Gy (%) - V20 Gy (%) - V30 Gy Gy (%) - V36 Gy Gy (%) |
11.4 34.2 45.5 39.4 34.8 31.8 14.7 1.3 |
12.2 35.3 45 40.6 38.4 35.9 10.1 0 |
10.5 34.4 54.2 41.6 30.9 23.2 8.3 0.4 |
10.7 34.2 44.7 37.6 31.1 23.6 7.2 0 |
NS* NS NS NS NS 0,01 NS NS |
| Origin of right coronary artery - Mean dose (Gy) - Maximum dose (Gy) - V4 Gy (%) - V10 Gy (%) - V15 Gy (%) - V20 Gy (%) - V30 Gy Gy (%) - V36 Gy Gy (%) |
28.8 29,5 (± 11.9) 85.7 (± 37.8) 85.7 (± 37.8) 85.7 (± 37.8) 85.7 (± 37.8) 71.4 (± 38.8) 16.8 (± 37.2) |
32.2 34 100 100 100 100 100 0 |
29.3 (± 10.7) 30.9 (± 9.8) 97.7 (± 6.1) 85.7 (± 37.8) 85.7 (± 37.8) 85.7 (± 37.8) 74.8 (± 43.5) 18.8 (± 23.7) |
32,3 34 100 100 100 100 100 0 |
NS NS NS _ _ _ NS NS |
| Origin of left coronary artery - Mean dose (Gy) - Maximum dose (Gy) - V4 Gy (%) - V10 Gy (%) - V15 Gy (%) - V20 Gy (%) - V30 Gy Gy (%) - V36 Gy Gy (%) |
26.8 29.9 98.5 93.2 86.1 77.1 42.9 0 |
29.5 30 100 100 100 100 0.8 0 |
26.9 28.2 100 100 100 86 40.5 10.2 |
28.3 29.7 100 100 100 100 0 0 |
NS NS NS NS NS NS NS NS |
Table 13: Comparison of mean and median dosimetric parameters for the heart and the origins of the coronary arteries.
• Oesophagus
Tomotherapy allowed a slight reduction of the mean dose delivered to the oesophagus compared to 3DCRT (21.7 Gy vs 26 Gy; p=0.01). No significant difference was observed between tomotherapy and 3DCRT for the other dosimetric parameters of the oesophagus (Table 14).
| Parameters | 3D-CRT | Tomotherapy | P | ||
|---|---|---|---|---|---|
| Mean | Median | Mean | Median | ||
| Esophagus | |||||
| - Mean dose (Gy) | 25.5 | 26 | 22,1 | 21.7 | 0.01 |
| - Maximum dose (Gy) | 36.6 | 36.7 | 36 | 36.9 | NS* |
| - V4 Gy (%) | 84 | 90 | 85,2 | 85.5 | NS |
| - V10 Gy (%) | 79,4 | 80.3 | 77,1 | 74.3 | NS |
| - V15 Gy (%) | 76.9 | 78.6 | 70,7 | 66.8 | NS |
| - V20 Gy (%) | 74.5 | 76.6 | 64,5 | 63.8 | NS |
| - V30 Gy (%) | 54.9 | 52.6 | 36,7 | 35.1 | NS |
| - V36 Gy (%) | 12.7 | 9,8 | 3.7 | 3.4 | NS |
Table 14: Comparison of mean and median dosimetric parameters for the esophagus.
• Spinal canal, trachea and thyroid
A significant reduction of the maximum dose to the spinal canal was observed with tomotherapy compared to 3DCRT (24.2 Gy vs 36.9 Gy; p=0.01) and a reduction of the mean dose to the trachea was observed with tomotherapy compared to 3DCRT (27.1 Gy vs 31.5 Gy; p=0.01). The mean dose to the thyroid was significantly increased with tomotherapy (23.6 Gy vs 15.4 Gy; p=0.03) (Table 15).
| parameters | 3D-CRT | Tomotherapy | p | ||
|---|---|---|---|---|---|
| Mean | Median | Mean | Median | ||
| Spinal canal - Maximum dose (Gy) |
36.1 | 36.9 | 23.6 | 24.2 | 0.01 |
| Trachea - Mean dose (Gy) |
30.4 | 31.5 | 27 | 27.1 | 0.01 |
| Thyroid - Mean dose (Gy) - V18 Gy (%) - V25 Gy (%) |
20.4 59.5 58.1 |
15.4 45.8 43.1 |
20.1 58.4 47.8 |
23.6 59.5 37.3 |
0,03 NS* NS |
Table 15: Comparison of mean and median dosimetric parameters for the spinal canal, trachea and thyroid.
• Healthy tissues
A significant increase of volumes exposed to a dose of 4 Gy was observed with tomotherapy compared to 3DCRT (58.9% vs 31.2%; p=0.01), while significantly larger volumes were exposed to doses greater than or equal to 15 Gy with 3DCRT compared to tomotherapy (Table 16).
| Parameters | 3D-CRT | Tomotherapy | P | ||
|---|---|---|---|---|---|
| Mean | Median | Mean | Median | ||
| Healthy tissue | |||||
| - Mean dose (Gy) | 8.5 | 8.3 | 8.5 | 8.3 | NS* |
| - Maximum dose (Gy) | 38 | 37.9 | 37.4 | 38.1 | NS |
| - V4 Gy (%) | 32.4 | 31.2 | 58.4 | 58.9 | 0.01 |
| - V10 Gy (%) | 27.2 | 27.3 | 33.7 | 33.6 | NS |
| - V15 Gy (%) | 24.2 | 24.6 | 18.7 | 16.4 | 0.01 |
| - V20 Gy (%) | 21.7 | 22.7 | 14.6 | 12.3 | 0.04 |
| - V30 Gy (%) | 11.2 | 12.2 | 2.7 | 1.3 | 0.02 |
| - V36 Gy (%) | 1.5 | 0.6 | 0.2 | 0.1 | 0.01 |
Table 16: Comparison of mean and median dosimetric parameters for healthy tissues.
Evaluation of tomotherapy and 3DCRT treatment plans for the 14 patients
Right and left breasts: No significant difference in terms of the mean dose to the right breast and left breast was observed between tomotherapy and 3DCRT, but a significant increase of V4Gy (p=0.0001) and a significant reduction of V20Gy and V30Gy were observed with tomotherapy compared to 3DCRT (Table 17).
| Parameters | 3D-CRT | Tomotherapy | P | ||
|---|---|---|---|---|---|
| Mean | Median | Mean | Median | ||
| Right breast | |||||
| - Mean dose (Gy) | 3.7 | 1.9 | 4 | 3.3 | NS* |
| - Maximum dose (Gy) | 29.7 | 30.8 | 20.1 | 20.8 | 0.0002 |
| - V4 Gy (%) | 15.2 | 8.6 | 37.2 | 24.9 | 0.0001 |
| - V10 Gy (%) | 11.6 | 6.3 | 11.1 | 5.4 | NS |
| - V15 Gy (%) | 9.4 | 4.2 | 3.2 | 1.3 | 0.004 |
| - V20 Gy (%) | 8.2 | 3.4 | 0.7 | 0 | 0.0002 |
| - V30 Gy (%) | 1.9 | 0 | 0 | 0 | 0.01 |
| Left breast | |||||
| - Mean dose (Gy) | 5.7 | 2.5 | 5.7 | 4.6 | NS |
| - Maximum dose (Gy) | 31 | 31.5 | 25.8 | 27 | 0.0009 |
| - V4 Gy (%) | 23 | 10.8 | 41.9 | 33.5 | 0.0001 |
| - V10 Gy (%) | 18.7 | 7.8 | 22.7 | 13.8 | NS |
| - V15 Gy (%) | 16.2 | 5 | 12.2 | 4.7 | NS |
| - V20 Gy (%) | 14.5 | 4 | 5.8 | 1.5 | 0.0024 |
| - V30 Gy (%) | 3.9 | 1 | 0.4 | 0 | 0.01 |
Table 17: Comparison of mean and median dosimetric parameters for the breasts.
Lungs: Tomotherapy did not allow any reduction of the mean dose to the lungs. Volumes exposed to low doses (V4Gy and V10Gy) were significantly increased with tomotherapy and volumes exposed to doses greater than or equal to 20 Gy were significantly increased with 3DCRT (Table 18).
| Parameters | 3D-CRT | Tomotherapy | P | ||
|---|---|---|---|---|---|
| Mean | Median | Mean | Median | ||
| Lungs | |||||
| - Mean dose (Gy) | 9.6 | 9.5 | 9.9 | 10.5 | NS* |
| - Maximum dose (Gy) | 34.2 | 32.8 | 34.9 | 35.6 | NS |
| - V4 Gy (%) | 41.6 | 38.3 | 64.1 | 62.3 | 0.0002 |
| - V10 Gy (%) | 31.7 | 32 | 41.3 | 42.9 | 0.0004 |
| - V15 Gy (%) | 28.1 | 28.9 | 26.7 | 27.7 | NS |
| - V20 Gy (%) | 25.4 | 26.3 | 16.1 | 16.3 | 0.0001 |
| - V30 Gy (%) | 11.6 | 12.1 | 2.9 | 2.8 | 0.0006 |
Table 18: Mean comparison and dosimetric parameter medians for the lungs.
Heart
Tomotherapy allowed a reduction of the mean dose to the heart compared to 3DCRT (7.4 Gy vs 9.6 Gy; p=0.02). V4Gy was significantly increased with tomotherapy and volumes exposed to doses greater than or equal to 20 Gy were significantly increased with 3DCRT (Table 19).
| Parameters | 3D-CRT | Tomotherapy | P | ||
|---|---|---|---|---|---|
| Mean | Median | Mean | Median | ||
| Heart | |||||
| - Mean dose (Gy) | 11.5 | 9.6 | 9.7 | 7.4 | 0,02 |
| - Maximum dose (Gy) | 32.3 | 31.6 | 32.2 | 31.9 | NS* |
| - V4 Gy (%) | 45.2 | 42.4 | 54.7 | 44.2 | 0.002 |
| - V10 Gy (%) | 39 | 33.6 | 37.6 | 27.9 | NS |
| - V15 Gy (%) | 35.6 | 31.1 | 27.8 | 21.1 | 0.02 |
| - V20 Gy (%) | 33 | 28.5 | 20.9 | 16 | 0.0001 |
| - V30 Gy (%) | 15.6 | 5.2 | 5.8 | 2.7 | 0.04 |
Table 19: Comparison of mean and median dosimetric parameters for the heart.
Oesophagus
Tomotherapy allowed a slight reduction of the mean dose delivered to the oesophagus compared to 3DCRT (21.9 Gy vs 24.7 Gy; p=0.005) together with a reduction of V20Gy (65.6% vs 76.5%; p=0.02) (Table 20).
| Parameters | 3D-CRT | Tomotherapy | P | ||
|---|---|---|---|---|---|
| Mean | Median | Mean | Median | ||
| Esophagus | |||||
| - Mean dose (Gy) | 24.1 | 24.7 | 21.6 | 21.9 | 0.005 |
| - Maximum dose (Gy) | 34 | 33.9 | 34 | 33.4 | NS* |
| - V4 Gy (%) | 82.1 | 84.2 | 83.2 | 85.5 | NS |
| - V10 Gy (%) | 78.1 | 79.8 | 75.2 | 74.4 | NS |
| - V15 Gy (%) | 76.3 | 78.2 | 70.3 | 69.5 | NS |
| - V20 Gy (%) | 74 | 76.5 | 65.1 | 65.6 | 0.02 |
| - V30 Gy (%) | 46 | 50.8 | 34.7 | 33.5 | NS |
Table 20: Comparison of mean and median dosimetric parameters for the esophagus.
Spinal canal, trachea and thyroid
A significant reduction of the maximum dose to the spinal canal was observed with tomotherapy compared to 3DCRT (23.7 Gy vs 33.4 Gy; p=0.0001). A significant reduction of the mean dose to the trachea was observed with tomotherapy compared to 3DCRT (28.1 Gy vs 30.1 Gy; p=0.02). The thyroid volume receiving a dose of 25 Gy (V25Gy) was significantly decreased with tomotherapy (53.9% vs 80.3%; p=0.005) (Table 21).
| Parameters | 3D-CRT | Tomotherapy | P | ||
|---|---|---|---|---|---|
| Mean | Median | Mean | Median | ||
| Spinal canal - Maximum dose (Gy) |
33.9 |
33.4 |
23.1 |
23.7 |
0.0001 |
| Trachea - Mean dose (Gy) |
29.6 |
30.1 |
27.5 |
28.1 |
0.02 |
| Thyroid - Mean dose (Gy) - V18 Gy (%) - V25 Gy (%) |
23.2 72.7 66.6 |
28 97 80.3 |
22.4 67.2 57.3 |
24.1 75 53.9 |
NS* NS 0.005 |
Table 21: Comparison of mean and median dosimetric parameters for the spinal canal, trachea and thyroid.
Healthy tissues
No significant difference in mean doses to healthy tissues was observed between tomotherapy and 3DCRT treatment plans. A significant increase of V4Gy and V10Gy was observed with tomotherapy compared to 3DCRT. Significantly larger volumes were exposed to doses greater than or equal to 15 Gy with 3DCRT compared to tomotherapy (Table 22).
| Parameters | 3D-CRT | Tomotherapy | p | ||
|---|---|---|---|---|---|
| Mean | Median | Mean | Median | ||
| Healthy tissue | |||||
| - Mean dose (Gy) | 8.3 | 7.8 | 8.1 | 8.2 | NS* |
| - Maximum dose (Gy) | 35.2 | 35.8 | 35.4 | 34.5 | NS |
| - V4 Gy (%) | 34.1 | 31.7 | 56.3 | 60.3 | 0.0002 |
| - V410Gy (%) | 27.6 | 26.1 | 31.8 | 29.7 | 0.02 |
| - V15 Gy (%) | 24.4 | 23.5 | 19.7 | 16.4 | 0.005 |
| - V20 Gy (%) | 21.7 | 21.3 | 13.1 | 9.8 | 0.0004 |
| - V30 Gy (%) | 9.1 | 9.4 | 1.9 | 1.3 | 0.001 |
Table 22: Comparison of mean and median dosimetric parameters for healthy tissues.
Compared to 3DCRT, tomotherapy delivered low doses of 4 Gy to larger volumes of the breast, lungs and healthy tissues, while decreasing the volumes exposed to intermediate-to-high doses. No correlation was observed between breast volumes and the dose received by the breasts in this study.
The heart was also more effectively spared by tomotherapy, as the mean dose to the heart was comparable to that delivered by 3DCRT, but with a 27% reduction of V20Gy (23.2% vs 31.8%; p=0.01). Although tomotherapy allowed better protection of the heart and therefore a lower risk of cardiac complications, it failed to lower the risk of coronary artery disease.
The relative reduction of the maximum dose received by the spinal canal was 32% (23.1 Gy vs 33.9 Gy; p=0.0001); this dose reduction was related to dose constraints determined before inverse planning. Reduction of the dose delivered to the spinal cord can be useful when subsequent irradiation is necessary.
Quantitative comparisons with dosimetric studies performed according to the “involved-field” concept comparing IMRT and 3DCRT techniques are difficult due to the small number of patients included, the variable total radiation doses and the use of different dosimetric parameters in these studies.
Better heart sparing, especially in the presence of anterior mediastinal invasion, has been reported by other dosimetric studies evaluating IMRT. In the study by Goodman et al., IMRT allowed a reduction of the mean dose to the heart and lungs [10]. According to Girinsky et al., the mean V30Gy to the heart was 14% with IMRT and 19.7% with 3DCRT, which corresponds to a 29% relative reduction [11]. Nieder et al. reported that IMRT failed to improve coverage of target volumes compared to 3DCRT, but allowed a reduction of the median dose to the heart, a reduction of the breast volumes exposed to high doses and an increase of breast volumes exposed to low doses [16]. De Sanctis et al. also reported an increase of the breast volumes exposed to low-dose irradiation (V5Gy and V10Gy) [12].
This reduction of the doses delivered to the heart with tomotherapy was achieved at the cost of an increased volume of organs at risk exposed to low doses, especially the breasts and lungs. Although a reduction of the volumes exposed to intermediate-to-high doses with 3DCRT may be associated with a decreased risk of second cancer, the effect of an increased volume of healthy tissues exposed to low doses of radiotherapy remains unknown at the present time [17-19]. Consequently, in the absence of data concerning the risk of second cancer, the benefit-risk balance of “involved-field” tomotherapy appears to be favourable when the heart is included in irradiation fields in order to decrease long-term cardiac toxicities, but with no associated reduction of the risk of coronary artery disease and myocardial infarction [20,21]. More generally, age at the time of diagnosis, the presence of cardiac or pulmonary comorbidity, the patient’s anatomy and staging of Hodgkin lymphoma must be taken into account in the choice of radiotherapy technique in order to achieve an optimal benefit-risk balance.
In order to lower the risk of subsequent breast cancer, it may be recommended to contour the mammary gland and store the dosevolume histogram in the patient’s file, especially in the case of young women under the age of 30 due to the increased radio sensitivity of the breast at this age.
The choice of radiotherapy technique to treat supradiaphragmatic Hodgkin lymphoma must be based on individual criteria such as anatomy, age at the time of diagnosis and the presence of cardiac or pulmonary comorbidity. Approaches comprising the use of IMRT techniques and reduction of irradiation volumes by “involved-node” radiotherapy are currently under evaluation in order to further reduce late toxicities of irradiation for patients with Hodgkin lymphoma [22].
This is the first study to evaluate the impact of “involved-field” tomotherapy on coverage of target volumes and sparing of organs at risk. This study demonstrated improvement of the conformity index and homogeneity index for PTV 30 Gy and improvement of the conformity index for PTV 36 Gy. The dosimetric study also demonstrated dosimetric advantages of tomotherapy in terms of cardiac protection, particularly in patients with anterior mediastinal lymph node invasion. Tomotherapy allowed better sparing of breast, lung and healthy tissue volumes exposed to high doses.