Forest Research: Open Access
Open Access
ISSN: 2168-9776
ISSN: 2168-9776
Research Article - (2018) Volume 7, Issue 1
To predict the distribution of Mikania micrantha, one of the most harmful invasive plants in Guangzhou City, the author selected relevant environmental factors and established a feasible simple model based on BP neural network to use its strong nonlinear ability in this paper. From this model, it is concluded that the distribution possibility of Mikania micrantha in Liwan District, Yuexiu District and Haizhu District is near 0, which are classified as regions without invasion risk; the distribution possibility in Conghua District and Huadu District is 60% and 69.3% respectively, which are defined as regions with low invasion risk; the distribution possibility in Baiyun District, Panyu District, Zengcheng District and Nansha District are much higher, which are identified as regions with high invasion risk; while the distribution possibility in Luogang District, Tianhe District and Huangpu District are the highest, which are determined as regions with highest risk.
<Keywords: Mikania micrantha; Spatial distribution; Predict; BP neural network; Guangzhou city
Overview
With the development of modern transportation system, exotic species have been spreading over almost the whole ecosystem on the Earth, posing a serious threat to biological diversity and ecological productivity, which has drawn great attention from the international scientific community and other societies. According to recent studies, 20% of flora in most countries is exotic, and bio-invasion has become one of the three most critical environmental problems in the 21st century, leading to enormous global economic losses [1-5].
In reports submitted by the United States, India and South Africa to the United Nations, average direct and indirect annual economic losses of these three countries reach $150 billion, $130 billion and $80 billion respectively. In China, economic loss from several major invasive species reaches ¥57.4 billion every year [6,7].
According to preliminary surveys, there are at least 300 types of invasive plants, 40 types of invasive animals and 11 types of invasive microorganisms in China, of which the few most threatening plants spreading uncontrolled in China are Mikania micrantha invading Guangdong Province, Alternanthera philoxeroides and Eichhornia crassipes introduced as fodder, and Spartina anglica introduced to help control coastal erosion. It is widely known that exotic invasive species and harmful plants have greatly endangered China’s ecological environment, biodiversity, social economy and personal security [8-10].
Mikania micrantha
Mikania micrantha , subordinated to compositae, is a vigorously growing perennial creeper with long thin stems. Often multi-branched, it can reproduce by both sexual and asexual modes. It is originated from Central America and has been widely spread to tropical zones in Asia. Due to its extremely rapid spreading speed, it is also called “Milea- minute Weed” in English [11,12]. In 1919 or so, M. micrantha emerged in Hong Kong, China as weed. In 1984, it was discovered in Shenzhen. Since 2008, it has been widely spread in the Pearl River Delta Region [13-15]. So far, most studies on M. micrantha have focused on biological control and integrated treatment technology. For example, Dutta studied chemical control of M. micrantha in 1968; domestic researchers like Li and Ze did researches on weed-control techniques for M. micrantha [16-19].
Since there is little research on the spreading mechanism of M. micrantha , no perfect solution has been found to control weed. As a result, it has become urgent to investigate the factors affecting its distribution and to explore the potential geological and geographical distribution range, as it is a necessary prerequisite to formulate concrete control strategies. In recent years, statistical techniques based on artificial neural network theory, as a subdiscipline of mathematics, have been widely applied to predict the distribution of species [20-22]. This paper established a simple and feasible BP neural network model, whose strong nonlinear ability is utilized, to predict the potential distribution of M. micrantha in Guangzhou City by studying 14 environmental factors affecting its distribution, providing aid in formulating a reasonable control scheme.
Research area
Guangzhou City spans from 112°57' E to 114°03' E in longitude and 22°26' N to 23°56' N in latitude, covering an area of 7,434.4 km2, of which 122,700 hm2 is arable land and 309,200 hm2 is forest. Its terrain is complicated, with an altitude generally increasing from south to north. The highest mountain here is Tiantang Peak, which stands 1,210 meters above sea level in the junction of Conghua District and Longmen County in the north. As a city located in the south subtropical zone, Guangzhou City has a typical monsoon oceanic climate, with an average temperature of 21.4°C~21.9°C, an annual rainfall of 1,689.3 mm~1,876.5 mm, an annual sunshine duration of 1,875.1 hours~1,959.9 hours, and an annual average high humidity of 80%.
With a population of 14 million, it is one of the most populous metropolitan agglomerations in the world and has been a major trade hub for over 2,000 years. Consequently, it has a high risk of invasion from exotic species.
In this distribution risk study, a grid map drawn with ArcGIS provided by Guangzhou Geographic Information Center has been used, which is 1: 1,000,000 in scale with several layers. In total, there are 268 grids, each of which is 27.75 km × 27.75 km in size. Those areas less than a grid are counted in the next latitude zone (Figure 1).
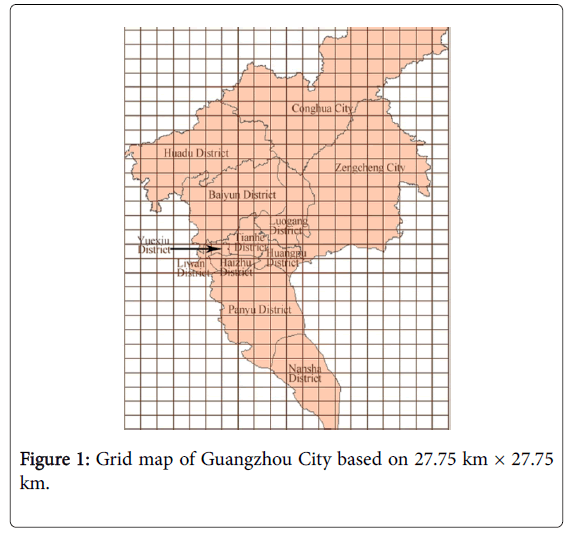
Figure 1: Grid map of Guangzhou City based on 27.75 km × 27.75 km.
The major invasion habitats of M. micrantha in coastal area of Guangdong Province are natural secondary forests, water conservation forests, croplands, reclaimed wasteland, coastal mudflats and beaches along mangrove forests [23]. It is mainly distributed in Luogang District, Zengcheng District, Nansha District, Panyu District, Baiyun District and Huangpu District. The total invasion area is about 4,000 hm2, of which 1,000 hm2 is forest. With the invasion of M. micrantha crops, trees and other plants are withered or rotted because M. micrantha is growing rapidly with flourishing foliage intercepting sunlight, and seriously affecting their photosynthesis. Consequently, fruit trees and crops have a worse harvest; forest and woodland are damaged and degraded, seriously threatening land productivity and ecological stability in Guangzhou City.
Mikania micrantha sample data
M. micrantha distribution data is obtained from investigation of 30 sample lands in various districts of Guangzhou City provided by Guangzhou Academy of Forestry (Figure 2). The data includes GPS geographical coordinates, altitude, gradient, slope aspect, slope position and damage area.
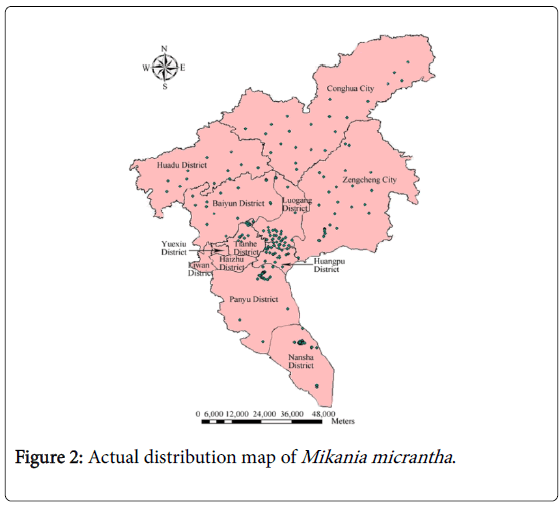
Figure 2: Actual distribution map of Mikania micrantha .
Environmental factor data
Environmental factors are grouped into three categories: (1) meteorological data (including average annual temperature, maximum/minimum temperature, relative humidity, rainfall, rainfall in the wettest season, rainfall in the driest season, number of days when daily rainfall ≥ 0.1 mm and average annual sunshine duration); (2) topographic data (including altitude, gradient, slope aspect and slope position); (3) soil data including soil temperature.
Conceptual BP neural network model
BP network, also called error back propagation neural network, is a multilayer feedforward network composed of nonlinear transformation units [24]. It comprises input layer, hidden layer (single-layer or multi-layer) and output layer. To predict the potential distribution of M. micrantha , impact factors are marked with corresponding GPS coordinates for real-time monitoring or survey, so that a potential spatial distribution maps of M. micrantha is drawn. Please refer to Figure 3 for flow chart of the conceptual model.
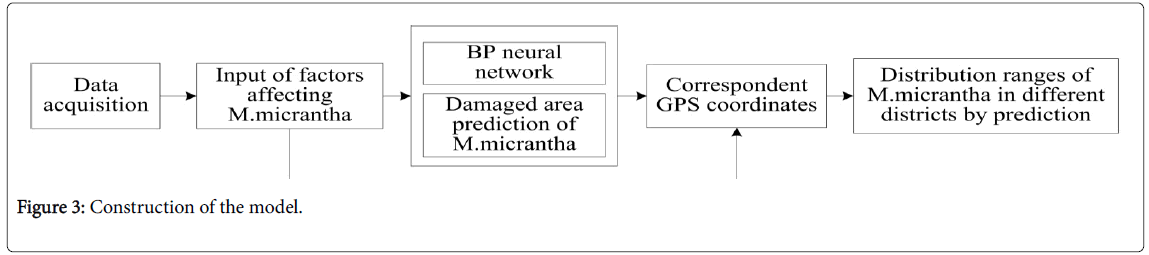
Figure 3: Construction of the model.
Establishment of BP neural network model
Determination of model structure: Set the number of neurons in input layer and output layer: In this BP neural network model, 14 environmental factors affecting the growth of Mikania micrantha are set in the input layer, while the various corresponding damaged GPS points are set in the output layer.
Arrange the BP network: According to BP neural network theory, a continuous function in any closed interval can be approached by a single hidden layer. Therefore, a three-layer BP neural network able to complete arbitrary mapping from n-dimension to m-dimension is applied in this paper (Figure 4).
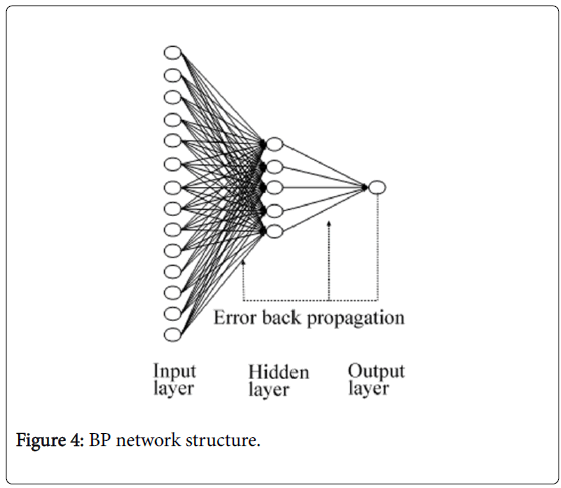
Figure 4: BP network structure.
Set the number of units in the hidden layer: The number of units in the hidden layer is directly related to the number of input/output units. Besides, if the number is too large, a too long learning time is required, samples not studied cannot be identified, and a poor tolerance will be got. To get the optimal unit number, the author applied the following calculation method:
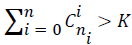 where k is the number of samples; ni is the number of units in hidden layer; n is the number of input units; and i is a constant in [0, n]. When
  .
.
 where n1 is the number of units in the hidden layer; n is the number of input units; m is the number of output units; and a is a constant in [1,10].
n1 = log2n where n1 is the number of units in the hidden layer; and n is the number of input units.After analysis, it is learned that five is the optimal units in the hidden layer.
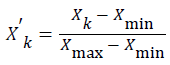
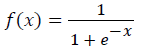
Pre-processing of input data: In practice, since the span of collected data is relatively big and different input data vectors have different dimensions, data must be standardized before network training is conducted to avoid overfitting in computation. The methods of standardization include zero-mean standard deviation, and normalization etc. Here, Formula (1) in [0,1], is applied for data preprocessing.
 (1)
(1)
In the formula: Xmax and Xmin are the maximum and minimum value of factor variables in each group respectively; Xk and X'k are the factor variable values in each group before and after standardization respectively.
Establishment of network model: Choose a transfer function for units in each layer: S (sigmoid) function is often adopted as the transfer function in BP network:
 (2)
(2)
Under specific circumstance, a pureline function may be applied. If sigmoid function is applied in the last layer of BP network, the whole network output will be confined in a small range (a continuous quantity between 0 and 1); if pureline function is applied in the last layer of BP network, the whole network output can be an arbitrary value.
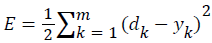
Error function (also called optimized objective function):
 (3)
(3)
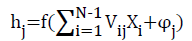
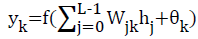
Output units in the interlayer and the output layer are:
 (4)
(4)
 (5)
(5)
Complete network learning: In MATLAB, either incremental mode or batch mode is applied for training network. In this study, batch mode is chosen, as the convergence rate of batch mode is higher than that of the incremental mode for large quantity of samples and it can be applied for many improved fast training algorithms. As is shown in Figure 5, as a dynamic knowledge base, constant weight is required to be modified in the learning process of BP neural network, which has memory to improve learning accuracy.
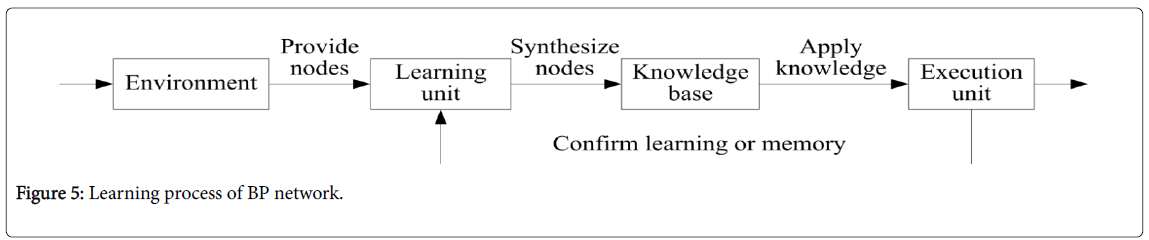
Figure 5: Learning process of BP network.
Modify weight: In this paper, LM algorithm is applied in the BP neuron network model to modify weights for nonlinear optimization. As a transformation of Newton method, it is used to minimize a function which is the sum of squares of other nonlinear functions. At present, it is the fastest algorithm to compute medium-scale feedforward networks (up to hundreds of connections weight).
Steps of weight modification based on LM algorithm
Step (1) set an initial weight vector quantity randomly; set target error ε, k :=1;
Step (2) compute the corresponding Jacobi matrix of weight vector quantity according to formula (1);
Step (3) search according to the following formulas:
ΔWij(n)=-[JT(Wij(n))+μkI]-1 JT(x)e(x)Wij(n+1)=Wij(n)+ ΔWij(n)
Step (4) if E(Wij(n)£ε), the algorithm terminates and weight vector quantity meeting the accuracy requirements can be gained; otherwise,
turn to Step (5);
Step (5) 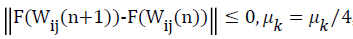 otherwise, μk=μk×4, and turn to Step (3).
For the definition of Jacobi matrix J in the above algorithms, please refer to the following equation:
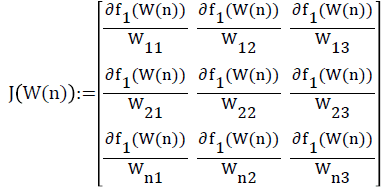 (6)
(6)
Verification of BP network: BP network structure of the model can be developed by training 280 groups of field research data in 9 districts. To verify the feasibility and validity of the model, the author selected 12 groups of field research data not trained, input them into the model, and then took both input and output value with mean-square deviations. Figure 6 shows the training error curve when the error is 1e-2, and 206 times of convergence training are conducted. Figures 7 and 8 show the mean-square deviations and the comparison of the predicted and actual values in 130 times of non-convergence training and 206 times of convergence training respectively. By comparing the two experiments, it is found that mean-square deviations are obviously reduced after convergence training, with a predicted error of 0~3 m2 z. Therefore, the established BP neural network prediction model has proved a relatively high precision and a favorable traceability, with a predicted value feasible to replace the field research value.
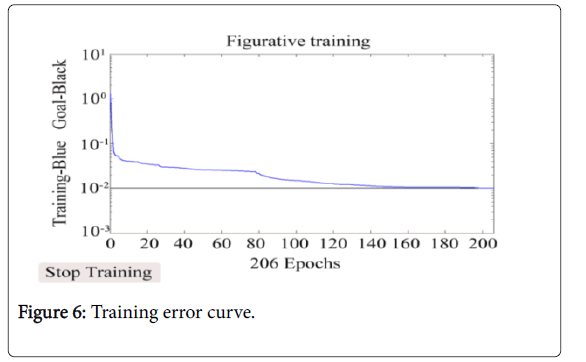
Figure 6: Training error curve.
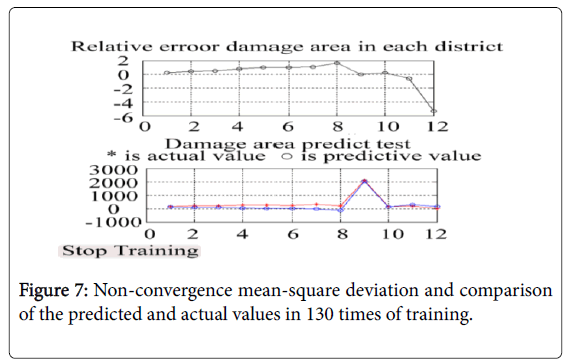
Figure 7: Non-convergence mean-square deviation and comparison of the predicted and actual values in 130 times of training.
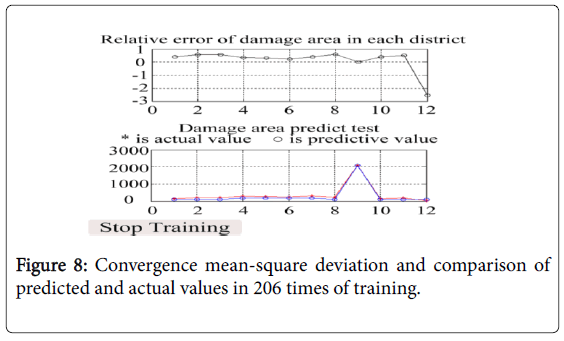
Figure 8: Convergence mean-square deviation and comparison of predicted and actual values in 206 times of training.
Prediction of Mikania micrantha’s distribution
After investigation, the author set 200 GPS sample points in each district of the 12 administrative districts in Guangzhou City, input 14 impact factor values of each point, and got the output as the predicted distribution areas.
To get the Mikania micrantha distribution value in Guangzhou City, the distribution ratio is defined as Pi=Si/S'i, where Si refers to predicted area of Mikania micrantha in different districts of Guangzhou City; S'i refers to the area of the administrative districts. I=1,2…, 12. Please refer Table 1 for values of Si, S'i, and Pi.
| No. | Administrative districts | Predicted area Si/hm2 | Area of administrative districts S'i/hm2 | Distribution ratio Pi/% |
|---|---|---|---|---|
| 1 | Yuexiu District | 0.000 000 02 | 3 380 | 5.92-12 |
| 2 | Liwan District | 0.000 000 09 | 6 240 | 1.43E-11 |
| 3 | Haizhu District | 0.000 000 13 | 9 040 | 1.44E-11 |
| 4 | Conghua City | 60 | 197 450 | 3.04E-4 |
| 5 | Huadu District | 69.3 | 96 800 | 7.16E-4 |
| 6 | Baiyun District | 273.4 | 104 270 | 2.62E-3 |
| 7 | Panyu District | 253.7 | 78 615 | 3.23E-3 |
| 8 | Zengcheng City | 613.3 | 161 600 | 3.80E-3 |
| 9 | Nansha District | 286.9 | 54 412 | 5.27E-3 |
| 10 | Tianhe District | 166.7 | 9 633 | 1.73E-2 |
| 11 | Luogang District | 1 513.6 | 38 906 | 3.89E-2 |
| 12 | Huangpu District | 1 033.4 | 12 170 | 8.49E-2 |
Table 1: Area of administrative districts in guangzhou, predicted area of Mikanla micrantha and its istribtion ratio
Thus, the Mikania micrantha distribution in the district is reflected by Pi. The higher the value is, the wider the distribution is in the district, i.e., the area is more suitable for Mikania micrantha to grow. Figure 9 shows the results of the 12 distribution regions by means of clustering, of which P1, P2, and P3 fall into the first category, P4 and P5 fall to the second category, P6, P7, P8 and P9 fall to the third category, and P10, P11, and P12 fall to the fourth category. Based on the value of , the distribution regions are divided into four categories: unsuitable regions, lowly suitable regions, suitable regions and highly suitable regions (Figure 10). Unsuitable regions include Liwan District, Yuexiu District and Haizhu District; lowly suitable regions include Conghua City and Huadu District; suitable regions include Baiyun District, Panyu District, Zengcheng City and Nansha District; and highly suitable regions include Luogang District, Tianhe District and Huangpu District.
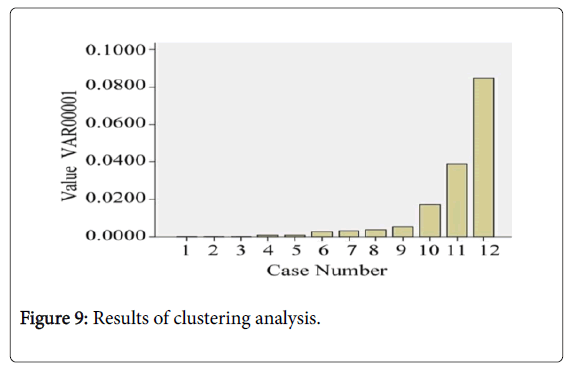
Figure 9: Results of clustering analysis.
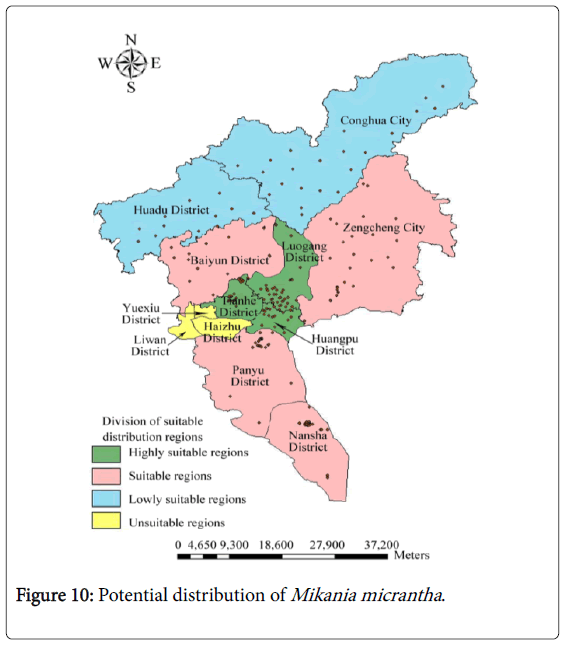
Figure 10: Potential distribution of Mikania micrantha .
This research establishes a BP neural network-based model to predict the potential spatial distribution of M. micrantha in Guangzhou City based on LM algorithm with a number of data samples. After comparing the model results with experiment data, it is discovered that they are in good agreement with each other. To predict the distribution, BP neural network model has following advantages:
First, it is an effective method to solve agriculture and forestry problems with advanced algorithms. It can predict the results automatically and precisely with good traceability, once the data for research is input, effectively avoiding complicated data analysis and tedious counting.
Second, it can predict the distribution more precisely than overall prediction, as it can avoid mutual interference among impact factors in different districts.
Third, it can be used repeatedly anywhere. To deal with different predicting objects, users only need to manually change input parameters instead of establishing a new model. As a result, it is much more time efficient than traditional statistical and analytical models when used in both scientific and field research.
However, further studies on topological structure, training efficiency, the improvement of generalization ability, and the model of information treatment, etc. are needed for applications of neural network models in prediction.
Besides, the BP neural network model applied in this research has its own shortcomings. First, the model is greatly limited by the number of training samples, so the precision of the prediction model would be affected to some extent. Second, there is no fixed pattern to determine the threshold values and weight, learning rate and the minimum error in the model. Third, due to the lack of standard procedure, it needs more time to develop than statistic models.
This paper is based on the key research project in Hunan and general item in Education Department of Hunan, which are “Natural disasters data based on satellite remote sensing monitoring interpretation technology research” (Item number: 2016SK2088), and “Research on the village economic development in Xiangxi under the perspective of targeted poverty alleviation” (Item number: 17C1679). Thanks to Professor Gui Zhang for providing remote sensing data and guidance, and my junior fellow apprentice for inspiration in the written process. Here, I wish to express my heartfelt thanks.