Journal of Cell Science & Therapy
Open Access
ISSN: 2157-7013
ISSN: 2157-7013
Research Article - (2017) Volume 8, Issue 6
The characterizations of green synthesized gold nanoparticles (AuNPs) prepared using Ocimum sanctum leaf extract were done by UV-Spectrophotometer at 500-540 nm. The XRD data obtained were found similar to gold JCPDS File No- 04-0784. SEM and TEM analysis of AuNPs revealed spherical shape and size of 200 nm. Further FT-IR data indicated the various biomolecules present in Ocimum sanctum leaf extract provides stability to gold nanoparticles synthesis. The AuNPs were studied for their anti-cancer activity on Dalton’s lymphoma (DL) cells and the results obtained with IC50 value of < 50 ng/ml performed by MTT assay. Further, to confirm anti-tumor potential and the mode of action of the synthesized AuNPs, cell viability assay, nuclear morphology, DNA fragmentation assay, mitochondrial membrane potential (ΔΨm) analysis, and cell cycle analysis were done using DL cells. DL cells treated with the AuNPs showed reduced cell viability, altered nuclear morphology, typical apoptotic DNA ladder formation and apoptosis. From the above finding it can be concluded that the AuNPs have potential to decrease the proliferation of tumor cells and enhanced the production of ROS. Gold nanoparticles used in cancer detection and diagnosis/treatment are mainly in preclinical stages of cancer development.
Keywords: AuNPs; Ocimum sanctum; Daltons lymphoma cells; Anti-tumor activity
Nanoscience has focused in the area of drug delivery by utilization of materials at the level of atoms, molecules, supramolecular structures and their distinctive features at nanoscale. In present scenario, nanoparticles (NPs) have drawn marvelous concern due to their valuable contribution on vast fields such as biomedical, sensor, optical, electronic, catalytic application and cancer therapeutics [1].
Several reports have been published for the biosynthetic preparation of nanomaterial. In the traditional system, several plants have been reported for the treatment of diseases. Ocimum sanctum (Toulouse) is one of the potent plant whose all plant parts (leaves, stem, flower, root, seeds and even whole plant) use for the treatment of diseases such as of bronchitis, malaria, diarrhoea, dysentery, arthritis, insect bites, skin disease and so on. Although, plant extract/ phytochemicals are of highquality options for the cancer treatment, beside there are some restrictions, including poor bioavailability and solubility [2]. In this scenario, nanoscience might be playing a vital and noteworthy role to conquer the restrictions of conventional treatment strategies. Plant extracts have excellent properties for the synthesis of novel nanoparticles, including gold [3-5]. However, which constituents are the major players in plant leaf extracts that lead to the formation of nanoparticles is yet to be established [6]. Biosynthesis of nanoparticles by plant extract has several advantages and cost effective with high potential [7-11].
Gold nanoparticles are the exceptional element which has been used to treat different pathophysiological conditions like anti-malarial and anti-arthritic agent, anti-HIV including cancer diagnostics and therapy. Gold nanoparticles (AuNPs), in particular, it has major role in biomedical applications because they are biocompatible and high surface is easy to modify due to the strong ability of AuNPs to bind to - SH- and -NH2- containing molecules such as organic molecules such as drugs, peptides, antibodies, etc. [12]. AuNPs have been used as antiangiogenesis, anti-malarial and anti-arthritic agent, anti-HIV [13]. Moreover, gold nanoparticles are used for delivering molecules into cells to slow down cancer cell growth and/or kill cancerous cells [14].
Tumor milieu contains malignant and non malignant cells such as endothelial cells, fibroblasts, and various cells derived from the bone marrow and suffering from the high scarcity of oxygen, nutrients and metabolic products. Tumor cell produces copious amounts of CC chemokines such as CC chemokine ligand (CCL)1, CCl2, CCl3, CCl4, CCl5 and VGEF, CSF-1 which attract for immune cells including M1 phenotype of macrophages to the tumor site [15-21]. As a consequence immune system fails to protect form tumor burden by downregulating the function of T cells, B cells, NK cells and dysfunction of visceral organ failure.
Keeping the immunomodulatory function of gold nanoparticle in mind, In the present investigation the Ocimum sanctum (Tulsi) induced synthesis of the AuNPs was done. The NPs were characterized by UV-visible spectroscopy, FTIR spectroscopy, XRD, TEM and anticancer potential was evaluated on Dalton’s lymphoma. DL cells treated with the AuNPs showed reduced cell viability, altered mitochondrial membrane potential (ΔΨm), change in nuclear morphology and DNA fragmentation ladder pattern as compared to control. These findings accounts that the Ocimum sanctum (Tulsi) induced biosynthesis of the AuNPs showed significant anti-tumor potential against invasive growth of Dalton’s lymphoma cells.
Reagents
Gold chloride (HAuCl4) and MTT and concanavalin-A were purchased from Sigma Aldrich, Bangalore, India. Sodium citrate tribasic dehydrate (C6H5Na3O7.2H2O) was purchased from Super Religare Laboratories (SRL), Mumbai, India. RPMI 1640 culture medium was obtained from HiMedia, Mumbai, India. Foetal bovine serum (FBS) was obtained from Invitrogen, CA, USA, with PE from eBiosciences, San Diego, CA, USA. LPS, DCFH-DA, PMA, RH-123, DAPI, Hoechst 33258, PI and Phalloidin were obtained from Sigma Chemical Co. (St. Louis, MO, USA). Na2HPO4, KH2PO4, formaldehyde, trypsin and acetone were purchased from Qualigens, Mumbai, India. All other chemicals otherwise stated were obtained from Qualigens.
Animals and tumor model
Inbred populations of BALB/c (H2d) strain of mice of either sex were used at 8-12 weeks of age. BALB/c (H2d) strain of mice was kept in conventional cages (six animals in each cage) and received sterilized food and water ad libitum . Experimental animals were inspected daily for survival. All animals were kept and maintained with utmost care under the guidelines of the Animal Ethical Committee, Banaras Hindu University, Varanasi, India.
For tumor system, healthy mice of either sex at 8-12 weeks of age were injected intraperitoneally (i.p.) with 1.0 × 10⁶ non-Hodgkin type of Dalton’s lymphoma (DL cells) in 0.5 ml sterile PBS. The DL cells for transplantation were obtained from ascitic fluid of DL-bearing mice, where the yield of the cells is higher and maintained in an ascitic form in vivo by serial transplantation.
Synthesis of gold nanoparticles by Tulsi (Osmium sanctum)
Gold nanoparticle was synthesized as per previously described method [22,23]. In brief, 100 g of freshly harvested leaf of tulsi (Osmium sanctum ) was taken and washed gently with distilled water. Then the freshly washed leaf was kept in conical flask in 100 ml of deionized water in water bath at 74°C for 1 h. After 1 h leaf extract was collected and centrifuge at 1500 rpm for 15 min at 4°C. Finally supernatant was filtered with 0.2 μm Whatman filter paper and collects in a clean flask and stare at 4°C. Further, 1 mM HAuCl4 solution (Figure 1) was prepared using deionized water of 10 ml of the solution mixture was added in the 30 ml of leaf extract.
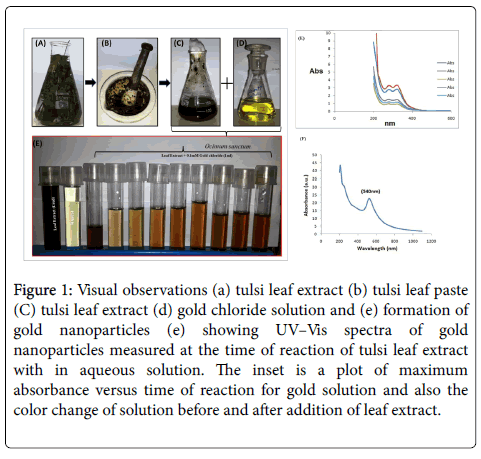
Figure 1: Visual observations (a) tulsi leaf extract (b) tulsi leaf paste (C) tulsi leaf extract (d) gold chloride solution and (e) formation of gold nanoparticles (e) showing UV–Vis spectra of gold nanoparticles measured at the time of reaction of tulsi leaf extract with in aqueous solution. The inset is a plot of maximum absorbance versus time of reaction for gold solution and also the color change of solution before and after addition of leaf extract.
Then the conical flask was kept in a shaker at 37°C for 24 h for the synthesis of nano-particles and UV spectra were taken at different times at day 1, 2, 3, 4, 5, 10 and 15. After synthesis of Gold nanoparticles (Au NPs) the whole supernatant was collected and centrifuged at 11500 rpm for 15 min at 4°C, the supernatant was discarded and the pellet was washed with dH2O thrice and the final pellet suspended in dH2O and sonicated. The sample was collected, lyophilized and characterized by following techniques.
Ultraviolet-visible spectroscopic analysis followed by sonication and lyophilization
Synthesized Au NPs by reduction with Sodium citrate tribasic dehydrate (C6H5Na3O7.2H2O) was observed through UV-Vis spectroscopy in 300-1200 nm range. Naturally synthesized AuNPs (540 nm) of diameter gave sharp peak in the visible region of the electromagnetic spectrum. [22,24]. In brief, samples were kept in the ice in 20 ml of centrifuge tube and provide ultrasonic vibration for the 2 min with the time gap of 30 second per cycle using. Further sample was Lyophilized using Christ Alpha 1-2 Lyophilizer for preparation of powdered AuNPs.
Characterization of AuNPs
FTIR measurements of the powdered purified AuNPs were assessed using Perkin Elmer, Spectrum Two FTIR (Waltham, MA, USA) system in the diffused reflectance mode. To obtain good signal/noise ratio, 512 scans/sample were recorded. The spectral range from 4000-400 cm-1 with resolution of 4 cm-1 powder samples for the FTIR obtained were similar as for powder diffraction measurements [25,26]. To obtain XRD patterns of the AuNPs, the AuNPs were subjected to XRD analysis at 45 kV and 40 mA with 2θ° in the range from 0to 80angle [27,28] (Figure 2).
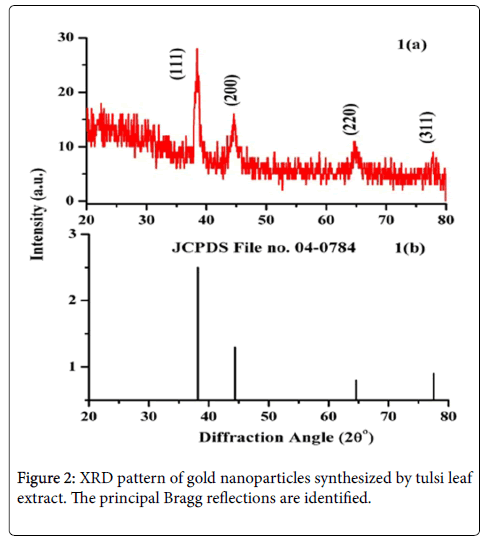
Figure 2: XRD pattern of gold nanoparticles synthesized by tulsi leaf extract. The principal Bragg reflections are identified.
The shape and Size of the synthesized AuNPs were obtained in colloidal solution using transmission electron microscope (HR-TEM), Tecnai 20G2 FEI, Oregon, USA [24]. Microphotographs of the NPs were captured at 50-200 KV. The morphological observation and characterization of AuNPs samples were done by using scanning electron microscope (Zieas-EVO LS-10) at 25 kV at LV mode [24].
Anti-cancer effect of the synthesized nanoparticles
Trypan blue dye exclusion and MTTassay: DL cells harvested from tumor bearing mice were seeded at a cell density of 1 × 10⁶ in the culture medium. DL cells pulsed with or without LPS and Au NPs and incubated for time periods of 24 h in 5% CO2 incubator (Shella, Oregon, CA, USA). After incubation, cell viability was determined using exclusion by the trypan blue method. [18]. For MTT assay cells were treated with 5 mg/ml MTT and incubated for 4 h and then 0.04 M HCl/ isopropanol were added. Viable cells were determined by the absorbance at 570 nm and IC50 value was calculated [29].
Confocal Imaging for Nuclear morphology and mitochondrial membrane potential (ΔΨm) by Rh-123assay: The DL cells were cultured in 5% CO2 at 37°C with and without LPS and AuNPs for 24 h. Cells were harvested and spread over pre-coated air dried poly-lysine coated glass slide, air dried and fixed with 4% PFA for 2 h at room temperature. Slide was washed and incubated with 0.1% triton X-100 for 15 minutes followed by washing with PBS and stained for 15 min with DAPI (Sigma, USA). The cell was mounted in anti quenching dye Daboco and observed under confocal microscope [16]. For mitochondrial membrane potential analysis, similar preparations was done with the cells fixed over slide and stained for 45 min with RH-123 dye in dark conditioned at RT, washed with PBS and further stained with Hoechst 33342 for 5 min. Cell mounted in Daboco and observed under a confocal microscope [30].
Flowcytometry for mitochondrial membrane potential (ΔΨm) by Rh-123: For flow cytometry based analysis for mitochondrial membrane potential (ΔΨm) by Rh-123 cells were treated with and without LPS and AuNPs for 24 h. Cell was harvested stained for 45 min with RH-123 dye in dark conditioned at RT. The cell was washed twice with 0.1% sodium azide containing 0.1% BSA in PBS for 10 min at 2500 rpm at 4°C. Further cells were kept in 0.2 ml sheath fluid in ice for Flow cytometry mitochondrial membrane potential observation (B D Biosciences, Mountain View, CA, USA) [31].
DNA fragmentation assay: DL cells with and without LPS and AuNPs treated for 24 h. The whole media of cultures were collected and centrifuged at 2500 rpm for 12 minutes. TES lysis buffer (20 mM EDTA, 100 mM Tris (pH-8), 0.8% SDS (w/v) in 10 ml distilled water) was added into cultured cell and mixed by wide bore pipette, then 10 μl RNase for 30 min at 37°C, further 10 μl of proteinase K added to the cell and incubate at for 50°C for 90 min. 5 μl of 5x loading dye were added to the sample added and observed into 1.5% agarose gel in TAE containing 0.5 ug/ml EtBr [29].
Flow cytometry analysis of cell cycle progression assay: After treatment cells were harvested and the pellet was resuspended in 0.5 ml saponin-propidium iodide (PI) cocktail. The procedure was carried out in the dark. All tubes were incubated at 4°C for overnight in dark at 4°C for 20 min and without washing cells were analyzed by Flowcytometry (BD Biosciences, Mountain View, CA, USA) to determine the percentage of cells in each phase of the cell cycle [32,33].
DCF-DA staining for ROS expression: Macrophage were cultured in medium with or without LPS and SeNPs and incubated for time periods of 24 h. After that cell was harvested from the medium by centrifugation at 1200 rpm for 10 min, cell washed twice with chilled PBS followed by centrifugation and incubated for 20 min with DCFDA stain. Cell were spread over pre coated polylysine glass slide and air dried and fixed, mounted with anti-quenching dye DABCO and observed under florescence microscope equipped with FTIC filter [26].
Fluorescent spectroscopy for estimation of ROS in medium: After treatments, Macrophage was harvested by centrifugation at 2500 rpm for 10 min, cell washed twice with chilled PBS and incubated for 20 min with DCFDA stain at the concentration of 20 mM. Cell was harvested from the medium and pellet was discarded and supernatant collected and observed under florescence spectrometer with FTIC filter range using Hitachi f-2500 spectrophotometer at 519 nm.
RNI estimation assay: Briefly, 50 μl sample (culture supernatant) harvested from cultured medium was seeded into 96-well flat-bottom culture plates and treated with equal volume of Griess reagent (1% sulfanilamide, 0.1% Naphthalene-ethylene-diaminedihidrochloride and 2.5% H3PO4) and left for 10 min at room temperature. Absorbance was measured at 540 nm with micro plate reader (Bio- Rad, 680, Bangalore, India). Nitrite concentration was determined by using Sodium nitrite as a standard. The chemicals used for preparation of Griess reagent were obtained from Sigma Chemical Co., St. Louis, USA [26].
ROI estimation assay: ROI production was determined by measuring H2O2 production in the culture supernatant of Macrophage cultured in the same conditions of stimulation and pretreatment as in the case of NO. H2O2 was measured by the TISO4. Briefly,
Cells were harvested by centrifugation at 1200rpm for 10 min, washed twice with chilled PBS. Cells were incubated with TiSO4 (0.1% in 20% H2SO4) for 10 min at RT. Supernatant was collected by centrifugation and absorbance measured at 410 nm on ELISA plate reader.
Statistical analysis
Each value represents the Mean SEM of three independent experiments in each group except for in vitro stimulation experiments where three independent experiments were conducted. Data are analyzed by using two-tailed student’s t-test on statistical software package Sigma Plot, version 12.0. A value of p< 0.05 was considered significant.
Synthesis of gold nanoparticles
Formation of gold nanoparticles by reduction of aqueous metal ions during exposure of heat to the plant extract may be easily followed by UV-visible spectroscopy. It is well known that the gold nanoparticles exhibit wine red color in solution. The production and stabilization of the reduced AuNPs in the colloidal solution were monitored by UVvisible spectrophotometer and is shown in (Figure 1a) UV-visible spectroscopy is techniques to identify the formation of the AuNPs in aqueous solution. Au NPs are known to exhibit at maximum in the range of 200 to 800 nm. The synthesis of Au NPs was monitored at 24 h. The AuNPs synthesized by sodium citrate are positioned at 540 nm. Similarly, Skirtach et al. reported that the gold NPs were absorbed at 540 nm, and it was synthesized using P. aeruginosa. The reduction of gold ions occurs comparatively slowly, but the AuNPs are found to be very stable in the colloidal suspension. (Figure 1b). The appearance of ruby wine red color is the characteristics of gold nanoparticles. UV spectra were taken at different time interval, such as 1 day, 2 day, 3 day, 4 day 5 day, 10 day and 15 day (Figure 1c). It clearly indicates the formation of gold nanoparticles. This color formation belongs to the surface Plasmon vibration of the metal nanoparticles. In case of gold nanoparticles, the narrow surface Plasmon resonance band occurred at 520 nm as shown in figures.
Structural characterizations
X-ray diffraction (XRD): The X-ray diffraction is used to identify the phase and crystallinity of the synthesized materials.
The XRD pattern of the AuNPs was recorded in the range of 10 - 80°. The XRD patterns match well with the JCPDS File no. 04-0784. The phase of the AU NPs was identified as cubic with space group Fm3m (225) having lattice parameter a = b = c = 4.0786 Å and α = β = γ = 90̊̊. The indexing of the XRD peaks was done using JCPDS File no. 04-0784 (Figure 2). The fraction between the intensity of the (200), (220) and (311) diffraction peaks is much lower and the lattice plane (111) is predominant. The remaining peaks may be due to leaf extract and other details of gold nanoparticles were tabulated in Table 1.
| Peak indexing from d – spacing | |||||||||||||||||
|---|---|---|---|---|---|---|---|---|---|---|---|---|---|---|---|---|---|
| 2θ | d | 1000/d2 | (1000/d2)/60.62 | hkl | Intensity | ||||||||||||
| 38.439 | 2.34-5.4756 | 1.82 | 3 | 111 | 28 | ||||||||||||
| 44.626 | 2.03-4.1209 | 242.67 | 4 | 200 | 16 | ||||||||||||
| 64.947 | 1.43-2.0449 | 489.02 | 8 | 220 | 11 | ||||||||||||
| Experimental and standard diffraction angles of silver specimen | |||||||||||||||||
| Experimental diffraction angle [2θ in degrees] | Standard diffraction angle[2θin degrees] JCPDS Gold: File no. 04-0784 |
||||||||||||||||
| 38.4386 | 38.184 | ||||||||||||||||
| Ratio between the intensities of the diffraction peaks | |||||||||||||||||
| Diffraction Peaks | Sample Value | Conventional Value | |||||||||||||||
| 200 and 111 | 0.57 | 0.52 | |||||||||||||||
| 220 and 111 | 0.39 | 0.32 | |||||||||||||||
| The grain size of gold nanopowder | |||||||||||||||||
| 2θ degree of intense peak (deg) | hkl | FWHM of Intense peak ( β) radians | Size of the partcle (D) nm |
d-spacing nm | Lattice parameter (α) Å | ||||||||||||
| 38.4386 | 111 | 0.7812 | 11 | 0.234196 | 4.0786 A | ||||||||||||
| 44.626 | 200 | 0.6298 | 14 | 0.203056 | |||||||||||||
| 64.9466 | 220 | 1.152 | 8 | 0.14347 | |||||||||||||
| The crystallinity index of gold nanoparticle Nanoparticles | |||||||||||||||||
| Sample | Dp (nm) | Dcry (nm) | Icry (unitless) | Particle Type | |||||||||||||
| Au-NPs | 16 nm | 11 | 1.45 | Polycrystaline | |||||||||||||
| XRD Parameters of gold nanoparticles | |||||||||||||||||
| Parameters | Values | ||||||||||||||||
| Structure | Fcc | ||||||||||||||||
| Space group | Fm-3m ( 225) | ||||||||||||||||
| Point group | M3m | ||||||||||||||||
| Packing fraction | 0.74 | ||||||||||||||||
| Symmetry of lattice | Cubic | ||||||||||||||||
| Particle size | 16nm | ||||||||||||||||
| Bond Angle | α= β = γ = 90° | ||||||||||||||||
| Lattice parameters | a=b=c=4.0786Å | ||||||||||||||||
| Vol.unit cell (V) | 67.85 Å | ||||||||||||||||
| Radius of Atom | 144 | ||||||||||||||||
| Density (p) | 19.30 g/cm3 | ||||||||||||||||
|
Dislocation Density |
7.6 × 10¹⁴ m-2 |
||||||||||||||||
|
Mass |
196.97 |
||||||||||||||||
Table 1: X-ray diffraction data analysis.
Scanning electron microscopy (SEM): In the SEM an electron beam is focused into affine probe and subsequently raster over a small rectangular zone. As the electron beam interact with the NPs sample, it creates various signals (secondary electron, internal currents, photon emission, etc.) can be detected. The image scanned by SEM is shown in Figure 3a. The particles are of different shapes and size and they are also agglomerated.
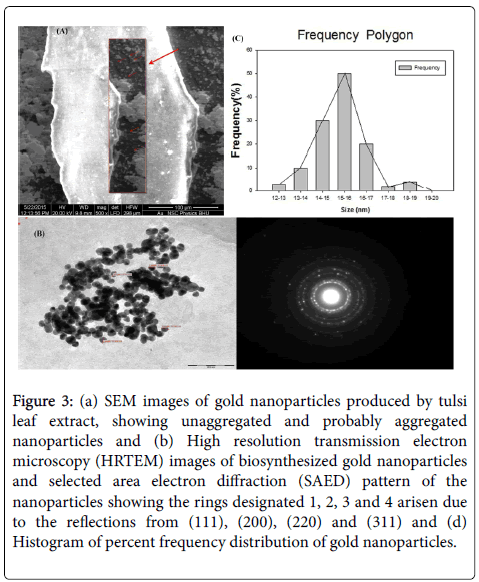
Figure 3: (a) SEM images of gold nanoparticles produced by tulsi leaf extract, showing unaggregated and probably aggregated nanoparticles and (b) High resolution transmission electron microscopy (HRTEM) images of biosynthesized gold nanoparticles and selected area electron diffraction (SAED) pattern of the nanoparticles showing the rings designated 1, 2, 3 and 4 arisen due to the reflections from (111), (200), (220) and (311) and (d) Histogram of percent frequency distribution of gold nanoparticles.
Transmission electron microscopy (TEM): TEM is a technique to achieve remarkable resolution and is used to see the morphological nature of the material. It gives an idea about the particle shape and size up to a nanoscale range. In this technique, a thin film of the sample was prepared over the carbon coated copper grids and extra sample were removed using blotting paper. Further, the prepared film is placed on the TEM probe and then allowed to dry under a mercury lamp for desired time.
The TEM micrograph of the AuNPs has been scanned in bright field mode to estimate the shape and size of the biosynthesized AuNPs using leaf extract and is shown in Figure 3b. The figure reveals that the leaves extract derived AuNPs exhibits spherical shape with an average particle size 16 nm. The selected-area electron diffraction (SAED) pattern is used to identify the crystalline nature of the material. The SAED pattern of the AuNPs has been recorded in the dark field mode and is shown in Figure 3c. The figure reveals the formation of circular lattice fringes, which confirms the polycrystalline nature of the AuNPs due to aggregation [34]. It also reveals that the synthesized AuNPs are stable in solution.
Fourier transform infrared (FTIR) spectroscopy: The FTIR studies have been carried out to identify the presence of possible vibrational modes of different molecules responsible for the reduction and capping of the Au NPs synthesized by sodium citrate. The FTIR spectra of the AuNPs have been recorded in 400 - 4000 cm-1 and are shown in Figure 4.
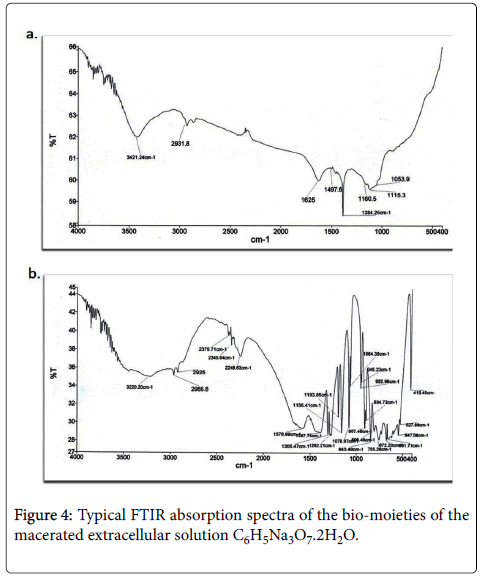
Figure 4: Typical FTIR absorption spectra of the bio-moieties of the macerated extracellular solution C6H5Na3O7.2H2O.
The spectra contain various vibrational modes centered at 1625, 14.97.6, 1384.25, 1160.5, and 1053.9 cm-1 due to tulsi leaf extract. The strong peak observed at 1630 cm-1 is assigned as C=O stretching vibrations due to the carbonyl stretch in proteins of the respective amide I group of proteins [35,36]. The peaks seen at 1,526 cm-1 and 1670 cm-1 are the characteristic asymmetric stretching vibrations of N-O compounds and the -C=C stretching vibrations corresponding to the -C=O stretching vibrations due to carboxylic acids and carbonyl groups, respectively [37,38]. The small peak at 1239 cm-1 is assigned to arise due to C-N stretching vibrations of aliphatic amine groups Table 2. The Au NPs is expected to bind to proteins through free carboxylate groups or amine groups in the protein. The presence of the intense peak at 2248 cm−1 is due to the C=O stretching vibration of carboxylic groups in the material to bound Au NPs [39].
| Observed Wave Number (cm-1) |
Functional group Functional Groups |
Visible Intensity |
|---|---|---|
| 3421.24 | NH, OH | Strong, Broad |
| 2931.8 | C-H | Strong, Variable |
| 1625 | C=O, C=O | Medium |
| 1497.6 | C-H | Medium |
| 1160.5 | C-H | Medium |
| 1384.25 | C-H | Medium |
| 1115.3 | C-O-C, as + C-CHO (skeletal) + C-O + N-N- + C-F- | Srong, Variable |
| 1053.9 | C-O | Medium |
Table 2: Typical FTIR absorption spectra functional group analysis.
IC50 and dose optimization: To optimize the IC50 (the concentration at which 50% growth inhibition was observed is IC50) of the AuNPs at 24 h. It was observed that treatment with the synthesized AuNPs showed significantly decreased cell viability as compared to control. The anti-tumor effect and dose optimization of AuNPs was done on Daltons lymphoma cells. Prepared AuNPs were lyophilized and dissolved in PBS at the concentration of mg/ml and ug/ml for the treatment. Dalton’s lymphoma cells (DL Cells) were incubated for with 24 h at the dose concentration of 5 to 100 mg for the1 × 106 cells (Figures 5a and 5b) and cell viability was observed at 6 h, 12 h, and 24 h of incubation using trypan blue exclusion method (data not shown).
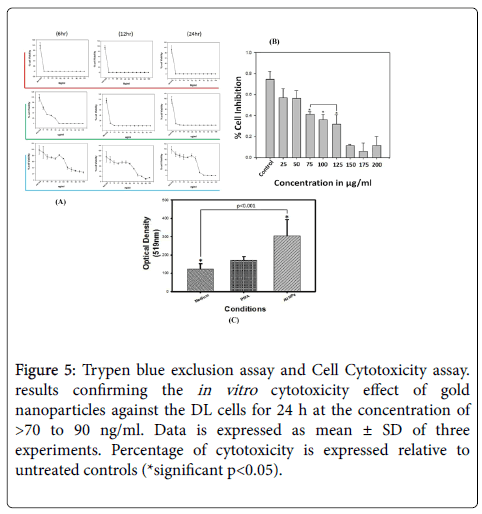
Figure 5: Trypen blue exclusion assay and Cell Cytotoxicity assay. results confirming the in vitro cytotoxicity effect of gold nanoparticles against the DL cells for 24 h at the concentration of >70 to 90 ng/ml. Data is expressed as mean ± SD of three experiments. Percentage of cytotoxicity is expressed relative to untreated controls (*significant p<0.05).
It was found that at this concentration the cell viability was found 0.00 at 6 h of treated cells as compare to control group whose cell viability percent value was 93 ± 11. On this dose DL cells were killed and cell proliferation was inhibited but the dose was not optimized so further dose of amps was used in ug/ml for 1 × 10⁶ for 24 h. It was found that more than 40-50% cell viability was found in the concentration of 5 μg, 10 μg, 20 μg, 40 μg, 60 μg, 80 μg and 100 μg at 24 h of incubation. It was confirmed by MTT assay when cell were treated in μg/ml for 24 h.
Effect of AuNPs on mitochondrial membrane potential: Further, mitochondrial membrane potential (ΔΨm) was checked to confirm the apoptosis by using Rhodamine 123, is a cationic fluorescent dye quantity mitochondrial membrane potential (ΔΨm). Fluorescence was measured via flow cytometry at an excitation wavelength of 485 nm. It was found that the intensity of Red dye (Rh-123) decreases as compared to the untreated group of DL cells whose intensity was found high (Figure 6).
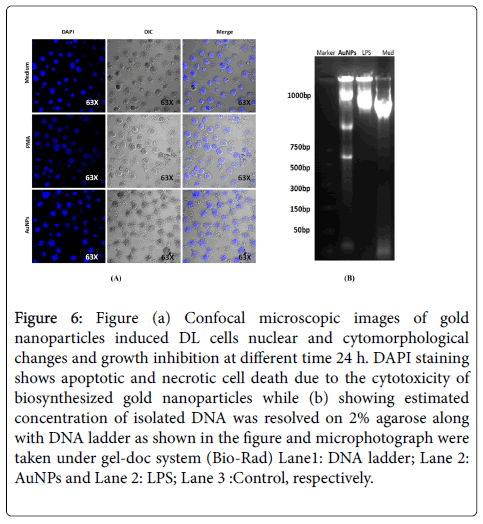
Figure 6: Figure (a) Confocal microscopic images of gold nanoparticles induced DL cells nuclear and cytomorphological changes and growth inhibition at different time 24 h. DAPI staining shows apoptotic and necrotic cell death due to the cytotoxicity of biosynthesized gold nanoparticles while (b) showing estimated concentration of isolated DNA was resolved on 2% agarose along with DNA ladder as shown in the figure and microphotograph were taken under gel-doc system (Bio-Rad) Lane1: DNA ladder; Lane 2: AuNPs and Lane 2: LPS; Lane 3 :Control, respectively.
Further flow cytometric analysis was performed. Substantial decrease in ΔΨm was observed upon exposure to AuNPs which indicates that AuNPs induces DL cell apoptosis via the mitochondrial induction pathway (Figures 7a and 7b).
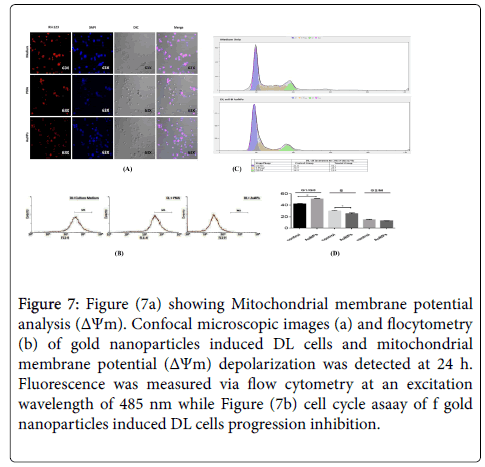
Figure 7: Figure (7a) showing Mitochondrial membrane potential analysis (ΔΨm). Confocal microscopic images (a) and flocytometry (b) of gold nanoparticles induced DL cells and mitochondrial membrane potential (ΔΨm) depolarization was detected at 24 h. Fluorescence was measured via flow cytometry at an excitation wavelength of 485 nm while Figure (7b) cell cycle asaay of f gold nanoparticles induced DL cells progression inhibition.
Effect of AuNPs DNA fragmentation assay and analysis of cell cycle: Cell cycle arrest assay, It was found that the proportions of cells in the G0/G1, S and G2/M phases were 50.0%, 24.5%, 13.10% in treating cell while in untreated cells the % value of G0/G1, S and G2/M phases was found 41.6, 30.5, 14.2% respectively (Figures 7c and 7d). DL cells were treated with 100μg dose and compared with the control group of untreated cells, it was found that the nuclear abrogation of DL cell in treating group more as compared to control whose nuclear condensation was found higher and more circular which resulted in significantly higher numbers of cells showing apoptotic feature in tumor cells. DNA fragments were observed in treating group 1000 bp, 750 bp, 500 bp, 50 bp respectively, as compared to control. AuNPs are capable of inducing apoptosis in DL cells by inducing apoptotic factors.
Effect of AuNPs on macrophages enhanced the ROS production: The co-localization study via florescence microscopy showed that in presence of AuNPs, TAMs produced more ROS as compared to control (Figure 8a). It was further confirmed by FL spectroscopy of cultured supernatant in which the ROS production was found to be more as compared to untreated control (Figure 8b). The ROS includes NO and H2O2 which was estimated by Griess method and TiSO4 method Results showed that TAMs treated with different concentration of AuNPs produced higher NO production as compared to PMA treated TAMs or compare with untreated macrophages at 24 h of incubation but the production of NO was decreased with increasing time (Figure 8c). It was also found that, TAMs treated with different concentration of AuNPs produced high amount of H2O2 production as compared to untreated TAMs (Figure 8d).
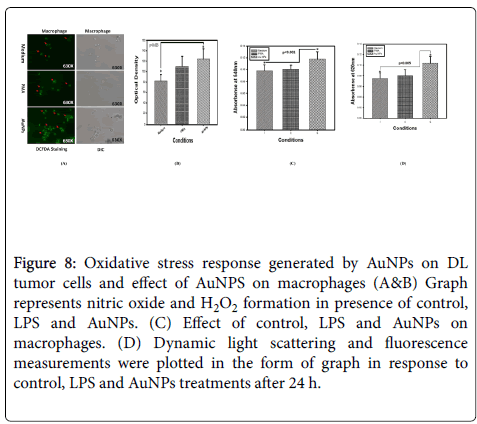
Figure 8: Oxidative stress response generated by AuNPs on DL tumor cells and effect of AuNPS on macrophages (A&B) Graph represents nitric oxide and H2O2 formation in presence of control, LPS and AuNPs. (C) Effect of control, LPS and AuNPs on macrophages. (D) Dynamic light scattering and fluorescence measurements were plotted in the form of graph in response to control, LPS and AuNPs treatments after 24 h.
The leaf extract induced synthesized amps were primarily confirmed by a change in color from a pale yellow to a deep wine red. The change in absorption spectra was firstly carried out by UV spectroscopy in the range of 500-550 nm. Further FT-IR analysis was carried out to find out the functional group on AuNPs induced by citrate shows various absorption peaks which represent the functional group Table 1.
XRD were done for determination of phase composition and crystalline structure of AuNPs. It was found similar to an international database of JCPDS file number no- 04-0784 (Table 2). The uniform surface structure was observed when AuNPs were further analysed by SEM at 50 μm scale. The topographic structure of AuNPs surface was found the spherical and uniform structure everywhere in the figure. The size and shape of AuNPs were done using TEM at 100-200 nm scale.
It was found that the majority of AuNPs size was found in between12-20 mm in size [35-37,39,40]. To optimize the IC50 (the concentration at which 50% growth inhibition was observed is IC50) of the AuNPs 24 h. It was observed that treatment with the synthesized AuNPs showed significantly decreased cell viability as compared to control. 40-50% cell viability was found in the concentration of 80 μg and 100 μg at 24 h of incubation [22-28]. Anticancer property of AuNPs was evaluated in DL cell cells by using primarily trypan blue exclusion assay, which shows the growth inhibitory activity of DL cells.
Uncontrolled growth and increased proliferation of cell is an important hallmark of cancer. Nuclear condensation and ΔΨm decreased upon treatment of AuNPs in DL cells. Fragmentation of genomic DNA was found upon AuNPs treatment and several ladders were observed over gel. Tumor progression is linked with unregulated cell cycle and it is one of the most important cellular event is commonly observed. Treatment of AuNPs to DL Cells showed strong G1 arrest at 24 h, usually, induction of apoptosis found to be linked with cell cycle arrest [33,34,38,41].
The fresh tulsi leaf extract reduced the gold ions and synthesized the gold nanoparticles. Tulsi Leaf extract of are suitable for synthesized gold nano-particles in aqueous solution by green synthesis method which are low cost-effective and eco-friendly. IC50 value >50 μg/ml was very significant on inhibiting DL tumor cells growth and progression. Form the above finding it can be concluded that AuNPs have potential to decrease the proliferation of tumor cells. The brief description of this study is represented in the form of a graphical abstract (Figure 9). Gold nanoparticles used in cancer detection and diagnosis/treatment are mainly in preclinical stages of cancer development.
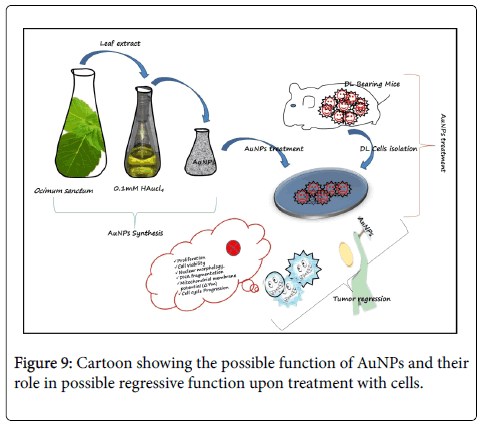
Figure 9: Cartoon showing the possible function of AuNPs and their role in possible regressive function upon treatment with cells.
Authors are thankful to Department of Botany, Banaras Hindu University for UV-spectroscopy. Department of Chemistry, Banaras Hindu University for FTIR facilities and Professor O. N. Srivastava, Department of Physics, Banaras Hindu University, Varanasi for providing XRD and SEM, TEM facilities. The authors also thankful to Prof. J. K. Roy, Department of Zoology, Banaras Hindu University, Varanasi, for providing the fluorescent microscopy facilities. Dr. Gautam expresses his appreciation to University Grants Commission, New Delhi for student supports.